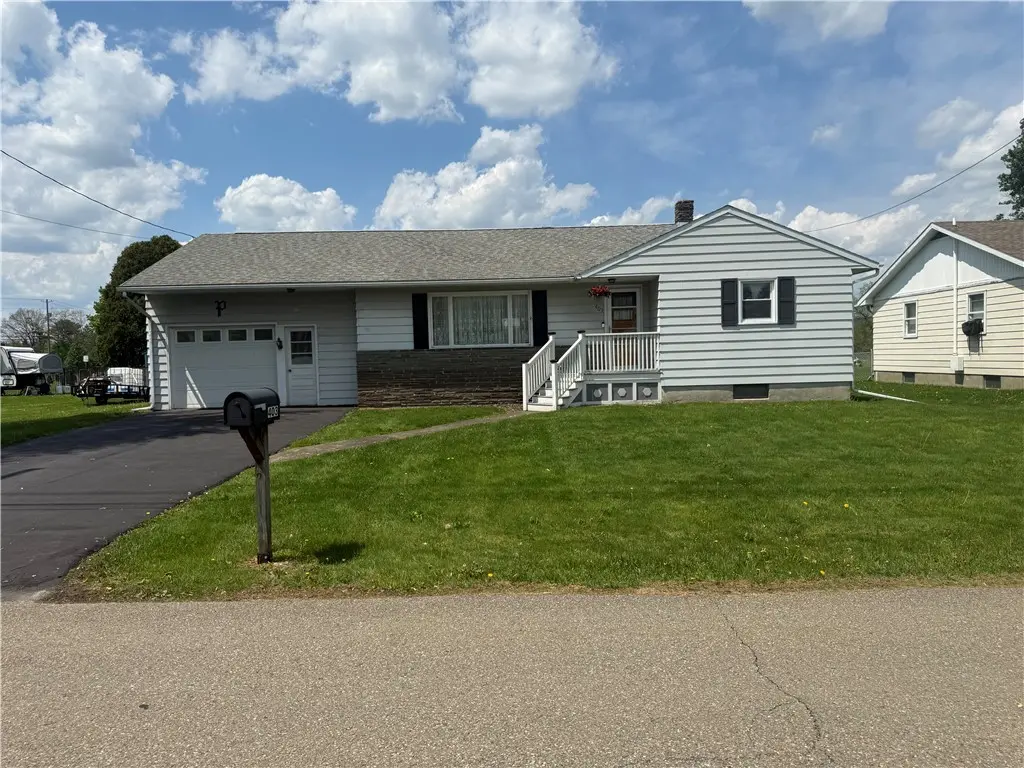
403 Maple Dr · Southport, NY
Flood risk 1/10 · Minimal
- FEMA flood zone
- X
- Chance of flooding over 30 yrs
- 0.0%
- Est. flood insurance / yr
- $473 – $860
Fire risk 2/10 · Minimal
- Est. fire insurance / yr
- $691 – $1,283
Heat risk 3/10 · Minor
- Hot days now (above 94°F)
- 7 days/yr
- Hot days in 30 yrs
- 16 days/yr
Wind risk 2/10 · Minimal
- Chance of severe wind over 30 yrs
- 1.0%
Air-quality risk 1/10 · Minimal
- Unhealthy air days now
- 0 days/yr
- Unhealthy air days in 30 yrs
- 0 days/yr
Risk factors via First Street. Map © Google.
Why this score? — see what drove the D- grade
The composite is a weighted blend of 9 inputs, each scored 0–100. Each bar is that input's sub-score; the figure is the points it added to the 100-point composite (weight × sub-score).
- ARV discount +15.0/15.0
- Cash flow +7.4/30.0
- 1% rule +3.5/10.0
- Livability +3.2/5.0
- Rent growth +2.5/5.0
- Condition / age +2.5/5.0
- Schools +2.4/10.0
- DSCR +1.5/10.0
- Appreciation +0.0/10.0
$115,000
🖨 Deal sheet 📄 Offer letter ✓ Due diligence
Listing remarks
Discover the blend of comfort and functionality in this great ranch-style home! This home welcomes you into a large inviting living room with built ins and hardwoods - perfect for relaxing or entertaining guests! The kitchen space is small but highly functional with lots of counterspace! It flows into a bright and inviting dining area that offers ample space for gatherings. French doors lead you to a deck with a partially fenced yard. Two large bedrooms with great closet space! There are two split systems for additional comfort. One in the dining room and the other in the main bedroom. The garage features a heat source and has a workshop. Large basement with a partially finished room that w
Key facts
- Ranch style home
- Bright dining area
- 0.26 acre lot
Tags
Property features AI
Exterior
- Parking: Attached heated garage with garage door opener (1 car)
- Utilities: Electricity connected (circuit breakers); Public water connected; Septic tank; Cable available
- Home design: Single-story home; Entry level: main; Shingle roof; Aluminum siding
- Construction: Built as existing structure; Block foundation
- Exterior features: Blacktop driveway; Deck; Fence (partial); Shed(s) / storage; Located on a cul-de-sac; Rectangular lot
Interior
- Kitchen: Gas range; Gas oven; Refrigerator
- Bedrooms: 2 bedrooms on the main level
- Flooring: Carpet; Hardwood; Tile; Vinyl; Varies
- Bathrooms: 1 full bathroom on the main level
- Heating & cooling: Gas forced-air heating; Central air conditioning
- Interior features: Ceiling fan(s); Separate/formal living room; Country kitchen; Pull-down attic stairs; Workshop; Thermal windows
- Laundry & utility: Washer and dryer in basement; Gas water heater
Neighborhood map
What this means for you Summary
Snapshot
- This is a 2-bed/1.0-bath single-family listed at $115k.
Deal economics
- At list price, monthly cash flow is $-150 ($-2k/yr) — negative.
- To cash-flow at today's rent, offer at most $88k (23.1% below list).
- To meet the 1% rule (rent ≥ 1% of price), the offer needs to be $97k (15.5% below list).
- Recommended offer: $88k (23.1% below list) — sets the bar for cash-flow.
- Cap rate 4.7% vs local median 6.5% in Southport — below-typical yield; the buyer is paying a premium for something (appreciation thesis, condition, location) that the cap rate doesn't capture.
Location & tenants
- Location reads 65/100 on livability (#690 in NY) — a middle-class / working-renter tenant base. Strengths: cost of living A+, housing A; Watch: schools D+, employment D, health & safety D.
- Elmira City School District (urban): math 23% / reading 35% proficiency, ranked #580 of 590 in NY (top 98%) — low school quality limits family demand, transient renter base, plan for 1-2y turnover.
- Market conditions: 101 active listings in the ZIP; 2 comparable units currently listed for rent nearby; 91 units permitted in Chemung County in 2024 (63 in 5+ unit buildings).
Forward outlook
- Local home prices are declining (-3.0%/yr); year-one equity from $795 of loan paydown is wiped out by about $3k of value loss. Plan a longer hold.
- Chemung County population projected at -17% by 2050 — secular population decline; favor cash flow + early exit over multi-decade hold.
Negotiation context
- Only 4 days on market — expect competitive offers; lowballing is unlikely to land.
- Current owner paid $66k; list at $115k implies a 74% gain — meaningful room to come down on a strong offer.
Risks & watch-outs
- Watch-outs: property tax is 2.8% of price.
Questions for the listing agent
- What do current leases actually rent for vs. the listed asking? Can we see a recent rent roll and the last 12 months of T-12 income?
- Built in 1962 — when were the roof, HVAC, electrical panel, plumbing, and water heater last replaced?
- Property tax is high relative to price — has the assessment been appealed recently, and will the sale trigger a re-assessment?
- Is there a deadline driving the sale (1031 exchange, divorce, estate, relocation)? That informs how much negotiation room exists.
- Schools are D-rated, which usually means shorter tenancies and higher turnover. Who's the typical renter profile here, and what's been the actual vacancy rate?
- Crime grade is D in this area — have there been break-ins, vandalism, or insurance claims at this property in the last 3 years? What carrier currently insures it and at what premium?
- The area grade is low — what's the realistic commute time and amenity access for the typical tenant pool here? Any planned neighborhood developments (good or bad) we should know about?
- What's the average days-on-market for RENTAL listings here right now (not sales)? A rising rental-DOM trend means longer vacancies and softer asking-rent achievability than the comps imply.
- What's the recent tenant-quality profile in this submarket — average credit score on applications, eviction rate, late-payment / NSF rate, and stable-employment percentage? A property-management company in the area should have these aggregated.
- How much new for-sale + rental construction is in the pipeline within 1–3 miles? Heavy new supply typically softens prices + rents 12–24 months out; constrained supply supports both.
Investment metrics
- 1% rule
- 0.85% ✗
- Cap rate
- 4.73%
- Cash-on-cash
- -5.60%
- DSCR
- 0.75
- GRM
- 9.9
CMA / ARV
- ARV (on-the-fly)
- $153,456
- Comps found
- 10
Show comp detail 10 sales within ~0.75 mi
| Address | Dist | Beds/Ba | Sqft | Sold | Price | $/sf | Match |
|---|---|---|---|---|---|---|---|
| 1500 Maple Ave Unit B | 0.08mi | 3/1.0 (+1) | 1,196 (+8%) | 12mo | $105,000 | $88 | 69 |
| 407 Maple Dr | 0.03mi | 3/1.5 (+1) | 1,204 (+8%) | 11mo | $170,000 | $141 | 68 |
| 502 Palomino | 0.35mi | 3/1.0 (+1) | 1,134 (+2%) | 14mo | $175,000 | $154 | 64 |
| 1529 Maple Ave | 0.21mi | 3/1.0 (+1) | 1,181 (+6%) | 14mo | $167,000 | $141 | 63 |
| 397 Merrill Pl | 0.20mi | 3/1.0 (+1) | 1,266 (+14%) | 10mo | $174,900 | $138 | 54 |
| 415 Charlesmont Rd | 0.63mi | 2/1.0 | 1,008 (-9%) | 15mo | $111,300 | $110 | 43 |
| 1241 Maple Ave | 0.56mi | 3/1.0 (+1) | 1,172 (+5%) | 23mo | $90,000 | $77 | 41 |
| 387 Coldbrook Dr | 0.48mi | 3/1.5 (+1) | 1,232 (+11%) | 18mo | $175,000 | $142 | 38 |
| 1263 Shannon Ave | 0.44mi | 3/2.0 (+1) | 1,242 (+12%) | 18mo | $155,000 | $125 | 36 |
| 1157 Charles St | 0.63mi | 3/1.5 (+1) | 1,232 (+11%) | 23mo | $136,000 | $110 | 26 |
Match score weights: distance 35% · size 25% · config 20% · recency 20%. Top-matched comps best support the ARV.
Projected returns pro-forma
-3.0% appreciation · 3.0% rent growth · sell at horizon
- IRR
- -25.8%
- Equity multiple
- 0.13×
- Total profit
- $-28,110
- Equity at exit
- $17,147
- IRR
- -22.0%
- Equity multiple
- -0.13×
- Total profit
- $-36,428
- Equity at exit
- $9,943
Cash invested: $32,200 (down + closing). Projections, not guarantees.
Landlord ↔ Tenant lean methodology
- Overall (STATE)
- 15 Strongly Tenant-Friendly
- State New York
- 15 Strongly Tenant-Friendly · D+10
- County
- — inherits STATE
- City
- — inherits STATE
ZIP-level market 14904
- Home prices YoY
- -9.6%
- Active inventory
- 101
- Price-to-rent
- 9.9×
Monthly cashflow live
- Estimated rent
- $972 medium interval (Pro) →
- Mortgage (P&I)
- −$603
- Tax from tax record
- −$267 /mo · $3,205/yr
- Insurance
- −$48
- HOA
- −$0
- Vacancy / Maint / Mgmt
- −$204
- Net cashflow
- $-150
Break-even live
UW: 25.0% down · 7.5% · 30yr · 1.5% tax · 5.0% vac · 8.0% maint · 8.0% mgmt
Financing live
Cash to close
- Down payment
- $28,750
- Closing costs
- $3,450
- Reserves months
- —
- Total cash needed
- —
Loan-product check · same deal, 3 products live
Conventional
25% down · 7.5% · 30yr
- Down + closing
- —
- Monthly P&I
- —
- Monthly cashflow
- —
- DSCR
- —
- Eligible?
- —
Personal DTI + credit; lowest rate.
DSCR
20% down · 8.5% · 30yr
- Down + closing
- —
- Monthly P&I
- —
- Monthly cashflow
- —
- DSCR
- —
- Eligible?
- —
No personal income docs; deal must DSCR.
Hard money
10% down · 12.0% · 12mo
- Down + closing
- —
- Monthly P&I
- —
- Monthly cashflow
- —
- DSCR
- —
- Eligible?
- —
Short-term bridge; refi at stabilization.
Rent comps 2 comps
| Address | Beds | Baths | Sqft | Rent | $/sqft | DOM | Units | Dist |
|---|---|---|---|---|---|---|---|---|
| 235 Allen St Elmira, NY | 2.0 | 1.0 | 780 | $950 | $1.22 | 43d | 1 | 1.02mi |
| 752 S Main St Unit 2 Elmira, NY | 1.0 | 1.0 | 841 | $995 | $1.18 | 43d | 1 | 1.15mi |
Listing history 2 events
-
2026-05-18$115,000 Active
-
1994-06-21soldstatus $66,000
ⓘ Source: listings_history table (triggers on properties + properties_extension) + one-shot
backfill from property_details.listing_events for pre-trigger history.
Tax reassessment forecast NY · Partial reset (capped growth)
- Current annual tax
- $3,205 · $267/mo
- Projected year-2 tax
- $3,205 · $267/mo
- Expected delta
- $0/yr ($0/mo · 0.0%)
ⓘ Screening estimate from a state-policy table — verify with the county assessor before closing.
Climate risk First Street
- Flood 1/10 Low FEMA zone X · 0% chance over 30 yrs
- Wildfire 2/10 Low
- Heat 3/10 Moderate 7 d/yr ≥94°F today · 16 d/yr by 30 yrs out
- Wind 2/10 Low 100% chance of damaging wind over 30 yrs
- Air quality 1/10 Low 0 unhealthy d/yr today · 0 by 30 yrs out
Nearby sold comps map
Loading sold comps map…
Walkable amenities ~0.75 mi
Loading nearby amenities…
Taxation est. · year 1
- Rental income
- $11,664
- − Mortgage interest
- −$6,442
- − Property taxes
- −$3,205
- − Insurance
- −$575
- − Repairs & maintenance
- −$933
- − Management
- −$933
- − Depreciation
- −$3,345
- Taxable loss
- −$3,769
- Est. tax savings @ 24.0%
- +$905
- After-tax cash flow
- $-898/yr
For passive investors: Depreciation is non-cash, so a rental often shows a tax loss while cash-flowing — sheltering income. Rental losses are passive: they offset passive income freely, and up to $25,000/yr can offset ordinary (W-2) income if you actively participate and your MAGI is under $100k (phasing out to $0 by $150k); unused losses carry forward. On sale, claimed depreciation is recaptured at up to 25%, and gains may owe capital-gains tax (a 1031 exchange can defer both). Figures are a year-1 estimate at your 24.0% rate — not tax advice; consult a CPA.
Schools (NCES district)
- District
- Elmira City School District
- NCES district ID
- 3610560
- Math proficiency
- 23% ▼ -7.00%
- Reading proficiency
- 35% ▲ 7.00%
- Median HH income
- $40,180
- Composite
- 24.39/100
- National rank
- #7688
- State rank
- #580 of 590 in NY
Livability — Southport
- Score
- 65/100
- State rank
- #690
- US rank
- #13026
Category grades
Schools grade is shown separately in the Schools card above.
Census & demographics
- Census place
- Southport, NY
- Population (ZIP)
- 14,276
Population outlook (Chemung County) Hauer SSP2
- Today (2025)
- 82,931 people
- By 2030
- 80,356 · -3.1%
- By 2040
- 74,745 · -9.9%
- By 2050
- 69,012 · -16.8%
- By 2075
- 55,689 · -32.8%
- By 2100
- 41,428 · -50.0%
Race, ethnicity, and origin ACS 2023
- Neighborhood character
- Predominantly White (83%)
- Race & ethnicity
- White 83% Two or more races 7% Black 7% Hispanic / Latino 5% Native American 1%
- Common ancestry
- Romanian 7% Lithuanian 3% Slovak 2%
- Foreign-born
- 2% · Canada, Jamaica, Dominican Republic
- Languages at home
- 97% English-only · Spanish 2%
Political lean MEDSL · Chemung
- 2024 margin
- R (+16.8) · D 41.6% · R 58.4%
- 2008→2024 swing
- -15.6pp toward R · 2008: -1.2pp · 2024: -16.8pp
- All cycles
- 2024: R+16.8 2020: R+13.4 2016: R+20.0 2012: R+2.9 2008: R+1.2
Not yet ingested
- Civics
- —
Market trends
- HPI YoY
- ▼ -23.33%
- Current HPI
- 220.688
- Rent YoY
- —
- Metro
- —
- State GDP YoY
- ▲ 2.60%
- F500 in state
- 92
Industry mix (Fortune 500 HQ in NY)
| Industry | F500 HQs | Revenue |
|---|---|---|
| Financial Services | 10 | $950B |
|
||
| Consumer Goods | 9 | $162B |
|
||
| Insurance | 4 | $225B |
|
||
| Telecommunications | 2 | $144B |
|
||
| Pharmaceuticals | 2 | $112B |
|
||
| Media / Entertainment | 2 | $69B |
|
||
Price history
+74.2% since first listed2 events — show timeline
- 2026-05-18 Listed $115,000 UNYREIS
- 1994-06-21 Sold (Public Records) $66,000 Public Records
Property tax history
+3.4%/yrLatest (2025): $3,205 · -1.3% YoY. Source: county tax records.
Cash-flow waterfall
monthlySold comps — $/sqft
last 12 mo · ≤1 miLoading sold comps…