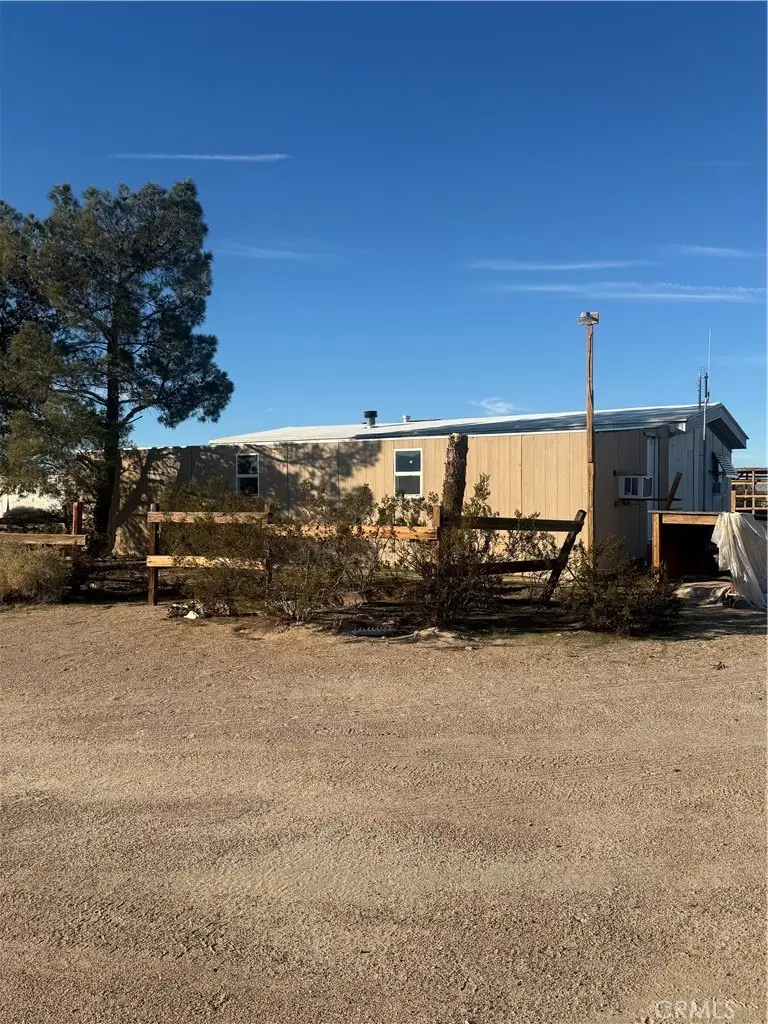
49122 Bedford Dr · Newberry Springs, CA
Flood risk 1/10 · Minimal
- FEMA flood zone
- D
- Chance of flooding over 30 yrs
- 0.0%
- Est. flood insurance / yr
- $544 – $1,084
Fire risk 4/10 · Minor
- Est. fire insurance / yr
- $659 – $1,223
Heat risk 8/10 · Major
- Hot days now (above 106°F)
- 7 days/yr
- Hot days in 30 yrs
- 19 days/yr
Wind risk 1/10 · Minimal
- Chance of severe wind over 30 yrs
- —
Air-quality risk 6/10 · Moderate
- Unhealthy air days now
- 10 days/yr
- Unhealthy air days in 30 yrs
- 13 days/yr
Risk factors via First Street. Map © Google.
Why this score? — see what drove the C- grade
The composite is a weighted blend of 9 inputs, each scored 0–100. Each bar is that input's sub-score; the figure is the points it added to the 100-point composite (weight × sub-score).
- Cash flow +19.7/30.0
- ARV discount +7.5/15.0
- DSCR +6.2/10.0
- Appreciation +5.0/10.0
- 1% rule +4.0/10.0
- Schools +2.7/10.0
- Rent growth +2.5/5.0
- Livability +2.5/5.0
- Condition / age +2.5/5.0
$125,000
🖨 Deal sheet (PDF) 📄 Offer letter ✓ Due diligence
Listing remarks MLS
Two 10 acre parcels being sold together for a total of 20 acres and 3 manufactured homes. Manufactured homes are personal property, not on permanent foundation. No 433A, cash buyers only. This property offers wide-open desert views and endless potential. Enjoy the peace, privacy, and room for animals, toys, or future improvements, all while being a short drive from Barstow with easy access to major freeways. A great chance to own a slice of High Desert living!
Key facts
- 20 acre lot
- Room for animals
- Desert views
Tags
Neighborhood map
What this means for you Summary
Snapshot
- This is a 2-bed/1.0-bath manufactured listed at $125k.
Deal economics
- At list price, monthly cash flow is $146 ($2k/yr) — positive.
- The deal already cash-flows at list — no discount required.
- To meet the 1% rule (rent ≥ 1% of price), the offer needs to be $112k (10.3% below list).
- Recommended offer: $110k (12.0% below list) — sets the bar for market timing.
Location & tenants
- Location reads: area grade C — affects rentability + tenant quality, not the cash-flow math above.
- Silver Valley Unified (town): math 23% / reading 39% proficiency, ranked #323 of 517 in CA (top 62%) — families likely to look elsewhere, expect single-tenant / working-renter base with shorter leases.
- Zoned schools: Yermo Elementary (math 17% / reading 27%, grade F, #1,179 of 1,571 statewide, top 78%, 340 students, 83% FRL); Fort Irwin Middle (math 23% / reading 41%, grade F, #207 of 498 statewide, top 42%, 239 students, 40% FRL); Silver Valley High (math 37% / reading 67%, grade D+, #296 of 1,170 statewide, top 27%, 369 students, 59% FRL) — zoned schools average 60% FRL vs 32% district-wide (29 pts higher); higher-poverty schools than district average — tighter screening recommended.
- Market conditions: 211 active listings in the ZIP; 5,458 units permitted in San Bernardino County in 2024 (1,500 in 5+ unit buildings).
Forward outlook
- In year one you build about $5k of equity ($864 loan paydown + $4k appreciation (3.0% local appreciation)).
- San Bernardino County population projected at +15% by 2050 — modest demand growth; plan on rents tracking national, not racing it.
- At projected returns (3.0% appreciation + 3.0% rent growth), your $35k cash investment doubles in ~5 years — after that, you're playing with house money.
- By year 8, paydown + projected appreciation supports a ~$34k cash-out refi (75% LTV) — recoverable capital for the next deal without selling this one.
Negotiation context
- It's been on market 164 days — a 12% lower offer ($110k) is reasonable based on typical stale-listing flexibility.
- Current owner paid $42k; list at $125k implies a 198% gain — meaningful room to come down on a strong offer.
Risks & watch-outs
- Climate carrying-cost: extreme-heat days projected 7→19/yr by 2055 (HVAC capex compounding) — expect insurance premiums to compound above CPI over the hold.
Questions for the listing agent
- It's been on market 164 days. Have you received any prior offers? Is the seller open to a 12% concession, seller financing, or rate buy-down credit?
- Why hasn't it sold? Are there any deal-killer items the seller is aware of (foundation, flood, title, zoning, code violations)?
- Is there a deadline driving the sale (1031 exchange, divorce, estate, relocation)? That informs how much negotiation room exists.
- What's the average days-on-market for RENTAL listings here right now (not sales)? A rising rental-DOM trend means longer vacancies and softer asking-rent achievability than the comps imply.
- What's the recent tenant-quality profile in this submarket — average credit score on applications, eviction rate, late-payment / NSF rate, and stable-employment percentage? A property-management company in the area should have these aggregated.
- How much new for-sale + rental construction is in the pipeline within 1–3 miles? Heavy new supply typically softens prices + rents 12–24 months out; constrained supply supports both.
Investment metrics
- 1% rule
- 0.90% ✗
- Cap rate
- 7.69%
- Cash-on-cash
- 4.99%
- DSCR
- 1.22
- GRM
- 9.3
CMA / ARV
No comps found within radius.
Projected returns pro-forma
3.0% appreciation · 3.0% rent growth · sell at horizon
- IRR
- 12.1%
- Equity multiple
- 1.69×
- Total profit
- $24,269
- Equity at exit
- $56,205
- IRR
- 14.2%
- Equity multiple
- 3.10×
- Total profit
- $73,343
- Equity at exit
- $86,619
Cash invested: $35,000 (down + closing). Projections, not guarantees.
Landlord ↔ Tenant lean methodology
- Overall (STATE)
- 18 Strongly Tenant-Friendly
- State California
- 18 Strongly Tenant-Friendly · D+13
- County
- — inherits STATE
- City
- — inherits STATE
ZIP-level market 92365
- Active inventory
- 211
- Price-to-rent
- 9.3×
Monthly cashflow live
- Estimated rent
- $1,121 medium interval (Pro) →
- Mortgage (P&I)
- −$656
- Tax from tax record
- −$33 /mo · $390/yr
- Insurance
- −$52
- HOA
- −$0
- Lot rent leased land?
- −$0
- Vacancy / Maint / Mgmt
- −$235
- Net cashflow
- $146
Break-even live
Sensitivity live
| Price | -10% $216 | -5% $181 | +0% $146 | +5% $110 | +10% $75 |
|---|---|---|---|---|---|
| Rent | -10% $57 | -5% $101 | +0% $146 | +5% $190 | +10% $234 |
| Rate | -1.0pp $209 | -0.5pp $177 | base $146 | +0.5pp $113 | +1.0pp $80 |
UW: 25.0% down · 7.5% · 30yr · 1.5% tax · 5.0% vac · 8.0% maint · 8.0% mgmt
Financing live
Cash to close
- Down payment
- $31,250
- Closing costs
- $3,750
- Reserves months
- —
- Total cash needed
- —
Loan-product check · same deal, 3 products live
Conventional
25% down · 7.5% · 30yr
- Down + closing
- —
- Monthly P&I
- —
- Monthly cashflow
- —
- DSCR
- —
- Eligible?
- —
Personal DTI + credit; lowest rate.
DSCR
20% down · 8.5% · 30yr
- Down + closing
- —
- Monthly P&I
- —
- Monthly cashflow
- —
- DSCR
- —
- Eligible?
- —
No personal income docs; deal must DSCR.
Hard money
10% down · 12.0% · 12mo
- Down + closing
- —
- Monthly P&I
- —
- Monthly cashflow
- —
- DSCR
- —
- Eligible?
- —
Short-term bridge; refi at stabilization.
Listing history 21 events
-
2026-06-22days on market $125,000 Active 164 DOM
-
2026-06-21days on market $125,000 Active 163 DOM
-
2026-06-18days on market $125,000 Active 160 DOM
-
2026-06-17days on market $125,000 Active 159 DOM
-
2026-06-16days on market $125,000 Active 158 DOM
-
2026-06-15days on market $125,000 Active 157 DOM
-
2026-06-13days on market $125,000 Active 155 DOM
-
2026-06-13days on market $125,000 Active 154 DOM
-
2026-06-09days on market $125,000 Active 151 DOM
-
2026-06-08days on market $125,000 Active 150 DOM
-
2026-06-07days on market $125,000 Active 149 DOM
-
2026-06-04days on market $125,000 Active 146 DOM
-
2026-06-03days on market $125,000 Active 145 DOM
-
2026-06-02days on market $125,000 Active 144 DOM
-
2026-06-01days on market $125,000 Active 143 DOM
-
2026-05-31days on market $125,000 Active 142 DOM
-
2026-01-14price $125,000 464-char remark
Show marketing remark (464 chars)
Two 10 acre parcels being sold together for a total of 20 acres and 3 manufactured homes. Manufactured homes are personal property, not on permanent foundation. No 433A, cash buyers only. This property offers wide-open desert views and endless potential. Enjoy the peace, privacy, and room for animals, toys, or future improvements, all while being a short drive from Barstow with easy access to major freeways. A great chance to own a slice of High Desert living!
-
2026-01-09$115,000 Active 464-char remark
Show marketing remark (464 chars)
Two 10 acre parcels being sold together for a total of 20 acres and 3 manufactured homes. Manufactured homes are personal property, not on permanent foundation. No 433A, cash buyers only. This property offers wide-open desert views and endless potential. Enjoy the peace, privacy, and room for animals, toys, or future improvements, all while being a short drive from Barstow with easy access to major freeways. A great chance to own a slice of High Desert living!
-
2015-05-01soldstatus $42,000
-
1985-02-27soldstatus $10,000
-
1983-08-08soldstatus $10,000
ⓘ Source: listings_history table (triggers on properties + properties_extension) + one-shot
backfill from property_details.listing_events for pre-trigger history.
Tax reassessment forecast CA · Resets to sale price
- Current annual tax
- $390 · $33/mo
- Projected year-2 tax
- $950 · $79/mo
- Expected delta
- +$560/yr (+$47/mo · 143.4%)
ⓘ Screening estimate from a state-policy table — verify with the county assessor before closing.
Climate risk First Street
- Flood 1/10 Low FEMA zone D · 0% chance over 30 yrs
- Wildfire 4/10 Moderate
- Heat 8/10 Severe 7 d/yr ≥106°F today · 19 d/yr by 30 yrs out
- Wind 1/10 Low
- Air quality 6/10 Major 10 unhealthy d/yr today · 13 by 30 yrs out
Nearby sold comps map
Loading sold comps map…
Walkable amenities ~0.75 mi
Loading nearby amenities…
Taxation est. · year 1
- Rental income
- $13,453
- − Mortgage interest
- −$7,002
- − Property taxes
- −$390
- − Insurance
- −$625
- − Repairs & maintenance
- −$1,076
- − Management
- −$1,076
- − Depreciation
- −$3,636
- Taxable loss
- −$353
- Est. tax savings @ 24.0%
- +$85
- After-tax cash flow
- $1,831/yr
For passive investors: Depreciation is non-cash, so a rental often shows a tax loss while cash-flowing — sheltering income. Rental losses are passive: they offset passive income freely, and up to $25,000/yr can offset ordinary (W-2) income if you actively participate and your MAGI is under $100k (phasing out to $0 by $150k); unused losses carry forward. On sale, claimed depreciation is recaptured at up to 25%, and gains may owe capital-gains tax (a 1031 exchange can defer both). Figures are a year-1 estimate at your 24.0% rate — not tax advice; consult a CPA.
Schools (NCES district)
- District
- Silver Valley Unified
- NCES district ID
- 0636820
- Math proficiency
- 23% ▼ -12.00%
- Reading proficiency
- 39% ▼ -12.00%
- Median HH income
- $48,754
- Composite
- 26.85/100
- National rank
- #7105
- State rank
- #323 of 517 in CA
Livability — Newberry Springs
No livability data for this city. (Only ~50 U.S. cities are tracked.)
Census & demographics
- Population (ZIP)
- 2,514
Population outlook (San Bernardino County) Hauer SSP2
- Today (2025)
- 2,300,329 people
- By 2030
- 2,378,907 · +3.4%
- By 2040
- 2,523,137 · +9.7%
- By 2050
- 2,642,388 · +14.9%
- By 2075
- 2,880,769 · +25.2%
- By 2100
- 2,909,436 · +26.5%
Race, ethnicity, and origin ACS 2023
- Neighborhood character
- Diverse neighborhood (Simpson 0.60)
- Race & ethnicity
- White 56% Hispanic / Latino 29% Two or more races 20% Asian 8% Black 2%
- Hispanic origin (detail)
- Mexican 14% Dominican 7%
- Common ancestry
- Romanian 5% Slovak 2% Serbian 2%
- Foreign-born
- 16% · Canada, Vietnam
- Languages at home
- 85% English-only · Spanish 8% Vietnamese 2% German/W. Germanic 2%
Political lean MEDSL · San Bernardino
- 2024 margin
- Toss-up / Even · D 47.5% · R 49.7% · Other 2.8%
- 2008→2024 swing
- -8.5pp toward R · 2008: 6.3pp · 2024: -2.1pp
- All cycles
- 2024: R+2.1 2020: D+10.7 2016: D+9.8 2012: D+5.4 2008: D+6.3
Not yet ingested
- Civics
- —
Market trends
- HPI YoY
- —
- Current HPI
- —
- Rent YoY
- —
- Metro
- —
- State GDP YoY
- ▲ 3.21%
- F500 in state
- 116
Industry mix (Fortune 500 HQ in CA)
| Industry | F500 HQs | Revenue |
|---|---|---|
| Technology | 27 | $1,492B |
|
||
| Financial Services | 3 | $174B |
|
||
| Retail | 3 | $44B |
|
||
| Insurance | 3 | $26B |
|
||
| Media / Entertainment | 2 | $115B |
|
||
| Pharmaceuticals / Biotech | 2 | $62B |
|
||
Price history
+1150.0% since first listed5 events — show timeline
- 2026-01-14 Price Changed $125,000 CRMLS
- 2026-01-09 Listed $115,000 CRMLS
- 2015-05-01 Sold (Public Records) $42,000 Public Records
- 1985-02-27 Sold (Public Records) $10,000 Public Records
- 1983-08-08 Sold (Public Records) $10,000 Public Records
Property tax history
-2.0%/yrLatest (2025): $390 · +1.4% YoY. Source: county tax records.
Cash-flow waterfall
monthlySold comps — $/sqft
last 12 mo · ≤1 miLoading sold comps…