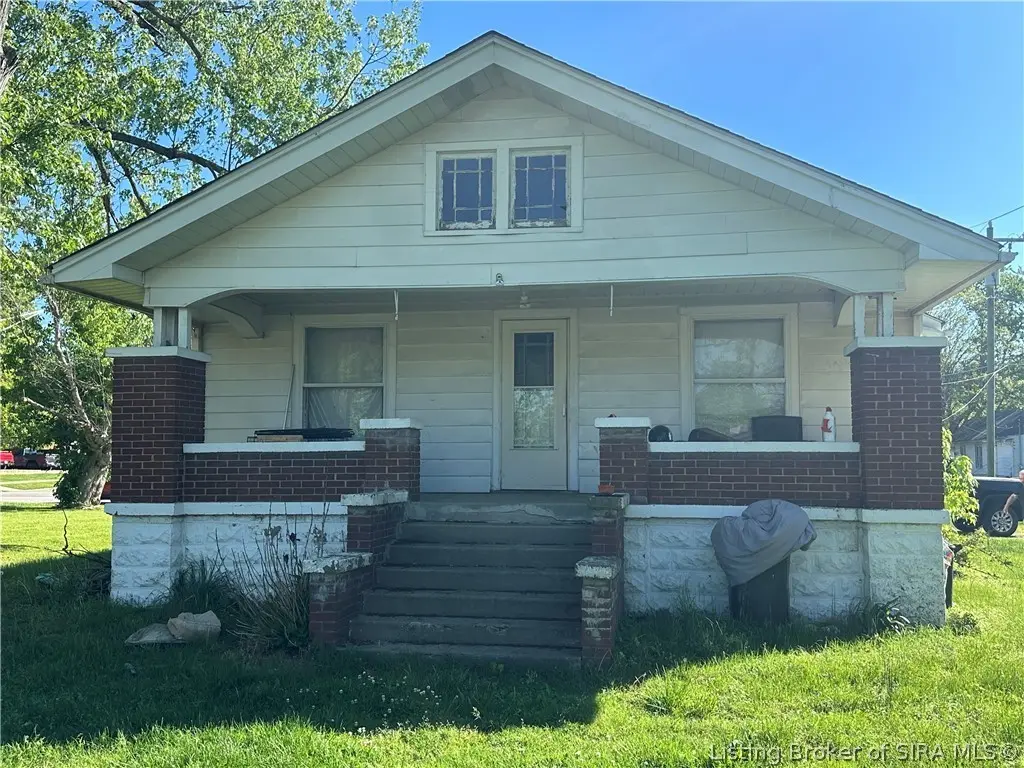
225 E State Road 60 · New Pekin, IN
Flood risk 1/10 · Minimal
- FEMA flood zone
- X (unshaded)
- Chance of flooding over 30 yrs
- 0.0%
- Est. flood insurance / yr
- $473 – $860
Fire risk 1/10 · Minimal
- Est. fire insurance / yr
- $717 – $1,331
Heat risk 5/10 · Moderate
- Hot days now (above 104°F)
- 7 days/yr
- Hot days in 30 yrs
- 20 days/yr
Wind risk 2/10 · Minimal
- Chance of severe wind over 30 yrs
- 2.0%
Air-quality risk 2/10 · Minimal
- Unhealthy air days now
- 1 days/yr
- Unhealthy air days in 30 yrs
- 2 days/yr
Risk factors via First Street. Map © Google.
Why this score? — see what drove the C- grade
The composite is a weighted blend of 9 inputs, each scored 0–100. Each bar is that input's sub-score; the figure is the points it added to the 100-point composite (weight × sub-score).
- Cash flow +15.0/30.0
- ARV discount +15.0/15.0
- 1% rule +5.0/10.0
- DSCR +4.6/10.0
- Schools +3.1/10.0
- Livability +3.1/5.0
- Rent growth +2.5/5.0
- Condition / age +2.5/5.0
- Appreciation +0.0/10.0
$95,000
🖨 Deal sheet (PDF) 📄 Offer letter ✓ Due diligence
Listing remarks
Investment Opportunity in Pekin – Full Renovation Needed! Unlock the potential at 225 SR 60 in Pekin, Indiana. This property presents a prime opportunity for investors, flippers, or ambitious renovators looking to bring new life to a home with solid upside potential. Situated in a convenient location with easy access to surrounding areas, this property offers the chance to create value through a complete renovation. The home is in need of significant repairs and updates and is being sold as-is, making it ideal for those seeking a full rehab project. Whether you're looking to restore it as a primary residence, renovate for resale, or add to your rental portfolio, the possibilities here
Key facts
- Growing area
- 7,405 sq ft lot
- Garage
Tags
Property features AI
Finance
- Financial info: Lease considered
Exterior
- Parking: Attached garage with 1 garage space
- Utilities: Public water; Septic tank sewer
- Home design: Single-story home; Resale property
- Construction: Block foundation
- Exterior features: Residential zoning; Lot approximately 0.17 acres
Interior
- Bathrooms: 1 full bathroom
- Interior features: Unfinished basement
- Laundry & utility: Laundry in basement
Neighborhood map
What this means for you Summary
Snapshot
- This is a 3-bed/1.0-bath single-family listed at $95k.
Deal economics
- At list price, monthly cash flow is $30 ($355/yr) — positive.
- The deal already cash-flows at list — no discount required.
- Meets the 1% rule at list price ($950 rent vs $95k).
- Recommended offer: $92k (3.0% below list) — sets the bar for market timing.
Location & tenants
- Location reads 61/100 on livability (#492 in IN) — a middle-class / working-renter tenant base. Strengths: crime A+, cost of living A+, housing A+; Watch: employment D, amenities F, commute F.
- East Washington School Corporation (rural): math 32% / reading 40% proficiency, ranked #183 of 301 in IN (top 61%) — families likely to look elsewhere, expect single-tenant / working-renter base with shorter leases.
- Zoned schools: East Washington Elementary School (math 52% / reading 40%, grade D-, #357 of 994 statewide, top 37%, 542 students, 50% FRL); East Washington Middle School (math 23% / reading 32%, grade F, #230 of 330 statewide, top 71%, 415 students, 52% FRL); Eastern High School (math 27% / reading 72%, grade D, #123 of 369 statewide, top 36%, 389 students, 42% FRL).
- Market conditions: 26 active listings in the ZIP; 1 comparable units currently listed for rent nearby; 25 units permitted in Washington County in 2024 (0 in 5+ unit buildings).
Forward outlook
- Local home prices are declining (-3.0%/yr); year-one equity from $657 of loan paydown is wiped out by about $3k of value loss. Plan a longer hold.
- Washington County population projected at -22% by 2050 — secular population decline; favor cash flow + early exit over multi-decade hold.
Negotiation context
- It's been on market 58 days — a 3% lower offer ($92k) is reasonable based on typical stale-listing flexibility.
Risks & watch-outs
- Climate carrying-cost: extreme-heat days projected 7→20/yr by 2055 (HVAC capex compounding) — expect insurance premiums to compound above CPI over the hold.
Questions for the listing agent
- It's been on market 58 days. Have you received any prior offers? Is the seller open to a 3% concession, seller financing, or rate buy-down credit?
- Built in 1960 — when were the roof, HVAC, electrical panel, plumbing, and water heater last replaced?
- Is there a deadline driving the sale (1031 exchange, divorce, estate, relocation)? That informs how much negotiation room exists.
- Schools are F-rated, which usually means shorter tenancies and higher turnover. Who's the typical renter profile here, and what's been the actual vacancy rate?
- What's the average days-on-market for RENTAL listings here right now (not sales)? A rising rental-DOM trend means longer vacancies and softer asking-rent achievability than the comps imply.
- What's the recent tenant-quality profile in this submarket — average credit score on applications, eviction rate, late-payment / NSF rate, and stable-employment percentage? A property-management company in the area should have these aggregated.
- How much new for-sale + rental construction is in the pipeline within 1–3 miles? Heavy new supply typically softens prices + rents 12–24 months out; constrained supply supports both.
Investment metrics
- 1% rule
- 1.00% ✓
- Cap rate
- 6.67%
- Cash-on-cash
- 1.33%
- DSCR
- 1.06
- GRM
- 8.3
CMA / ARV
- ARV (median comp)
- $164,318
- List price
- $95,000
- Delta
- -42.19%
- Verdict
- UNDERPRICED
- Comps
- 20 within 1.0 mi
Show comp detail 7 sales within ~0.75 mi
| Address | Dist | Beds/Ba | Sqft | Sold | Price | $/sf | Match |
|---|---|---|---|---|---|---|---|
| 453 W Park St | 0.20mi | 3/1.0 | 1,014 (-5%) | 9mo | $77,500 | $76 | 76 |
| 599 N Susan Way | 0.60mi | 3/1.5 | 1,148 (+8%) | 2mo | $226,500 | $197 | 55 |
| 805 E State Road 60 | 0.57mi | 2/1.0 (-1) | 1,114 (+5%) | 14mo | $165,000 | $148 | 49 |
| 430 N Cress Dr | 0.46mi | 3/2.0 | 1,120 (+5%) | 21mo | $215,000 | $192 | 49 |
| 448 N Cress Dr | 0.48mi | 3/2.0 | 1,152 (+8%) | 16mo | $208,000 | $181 | 46 |
| 1120 E 5th St | 0.75mi | 3/1.0 | 984 (-8%) | 9mo | $211,300 | $215 | 45 |
| 511 N Cress Dr | 0.59mi | 3/2.0 | 1,196 (+12%) | 22mo | $215,000 | $180 | 30 |
Match score weights: distance 35% · size 25% · config 20% · recency 20%. Top-matched comps best support the ARV.
Projected returns pro-forma
-3.0% appreciation · 3.0% rent growth · sell at horizon
- IRR
- -14.1%
- Equity multiple
- 0.49×
- Total profit
- $-13,457
- Equity at exit
- $14,165
- IRR
- -5.2%
- Equity multiple
- 0.66×
- Total profit
- $-9,075
- Equity at exit
- $8,214
Cash invested: $26,600 (down + closing). Projections, not guarantees.
Landlord ↔ Tenant lean methodology
- Overall (STATE)
- 90 Strongly Landlord-Friendly
- State Indiana
- 90 Strongly Landlord-Friendly · R+11
- County
- — inherits STATE
- City
- — inherits STATE
ZIP-level market 47165
- Home prices YoY
- -5.0%
- Active inventory
- 26
- Price-to-rent
- 8.3×
Monthly cashflow live
- Estimated rent
- $950 medium interval (Pro) →
- Mortgage (P&I)
- −$498
- Tax from tax record
- −$183 /mo · $2,198/yr
- Insurance
- −$40
- HOA
- −$0
- Vacancy / Maint / Mgmt
- −$200
- Net cashflow
- $30
Break-even live
Sensitivity live
| Price | -10% $83 | -5% $56 | +0% $30 | +5% $3 | +10% $-24 |
|---|---|---|---|---|---|
| Rent | -10% $-45 | -5% $-8 | +0% $30 | +5% $67 | +10% $105 |
| Rate | -1.0pp $77 | -0.5pp $54 | base $30 | +0.5pp $5 | +1.0pp $-20 |
UW: 25.0% down · 7.5% · 30yr · 1.5% tax · 5.0% vac · 8.0% maint · 8.0% mgmt
Financing live
Cash to close
- Down payment
- $23,750
- Closing costs
- $2,850
- Reserves months
- —
- Total cash needed
- —
Loan-product check · same deal, 3 products live
Conventional
25% down · 7.5% · 30yr
- Down + closing
- —
- Monthly P&I
- —
- Monthly cashflow
- —
- DSCR
- —
- Eligible?
- —
Personal DTI + credit; lowest rate.
DSCR
20% down · 8.5% · 30yr
- Down + closing
- —
- Monthly P&I
- —
- Monthly cashflow
- —
- DSCR
- —
- Eligible?
- —
No personal income docs; deal must DSCR.
Hard money
10% down · 12.0% · 12mo
- Down + closing
- —
- Monthly P&I
- —
- Monthly cashflow
- —
- DSCR
- —
- Eligible?
- —
Short-term bridge; refi at stabilization.
Rent comps 1 comps
| Address | Beds | Baths | Sqft | Rent | $/sqft | DOM | Units | Dist |
|---|---|---|---|---|---|---|---|---|
| 515 E Brookelynn Ct Pekin, IN | 2.0 | 1.0 | 1000 | $950 | $0.95 | 4d | 1 | 0.47mi |
Listing history 19 events
-
2026-06-21days on market $95,000 Active 58 DOM
-
2026-06-21days on market $95,000 Active 57 DOM
-
2026-06-18days on market $95,000 Active 55 DOM
-
2026-06-17days on market $95,000 Active 54 DOM
-
2026-06-16days on market $95,000 Active 53 DOM
-
2026-06-15days on market $95,000 Active 52 DOM
-
2026-06-13days on market $95,000 Active 50 DOM
-
2026-06-12days on market $95,000 Active 49 DOM
-
2026-06-09days on market $95,000 Active 46 DOM
-
2026-06-08days on market $95,000 Active 45 DOM
-
2026-06-07days on market $95,000 Active 44 DOM
-
2026-06-05pricedays on market $95,000 Active 42 DOM
-
2026-06-04days on market $105,000 Active 40 DOM
-
2026-06-02days on market $105,000 Active 39 DOM
-
2026-06-01days on market $105,000 Active 38 DOM
-
2026-05-31days on market $105,000 Active 37 DOM
-
2026-05-31days on market $105,000 Active 36 DOM
-
2026-05-06price $105,000 928-char remark
-
2026-04-25$115,000 Active 928-char remark
ⓘ Source: listings_history table (triggers on properties + properties_extension) + one-shot
backfill from property_details.listing_events for pre-trigger history.
Tax reassessment forecast IN · Partial reset (capped growth)
- Current annual tax
- $2,198 · $183/mo
- Projected year-2 tax
- $2,198 · $183/mo
- Expected delta
- $0/yr ($0/mo · 0.0%)
ⓘ Screening estimate from a state-policy table — verify with the county assessor before closing.
Climate risk First Street
- Flood 1/10 Low FEMA zone X (unshaded) · 0% chance over 30 yrs
- Wildfire 1/10 Low
- Heat 5/10 Major 7 d/yr ≥104°F today · 20 d/yr by 30 yrs out
- Wind 2/10 Low 2% chance of damaging wind over 30 yrs
- Air quality 2/10 Low 1 unhealthy d/yr today · 2 by 30 yrs out
Nearby sold comps map
Loading sold comps map…
Walkable amenities ~0.75 mi
Loading nearby amenities…
Taxation est. · year 1
- Rental income
- $11,400
- − Mortgage interest
- −$5,321
- − Property taxes
- −$2,198
- − Insurance
- −$475
- − Repairs & maintenance
- −$912
- − Management
- −$912
- − Depreciation
- −$2,764
- Taxable loss
- −$1,182
- Est. tax savings @ 24.0%
- +$284
- After-tax cash flow
- $638/yr
For passive investors: Depreciation is non-cash, so a rental often shows a tax loss while cash-flowing — sheltering income. Rental losses are passive: they offset passive income freely, and up to $25,000/yr can offset ordinary (W-2) income if you actively participate and your MAGI is under $100k (phasing out to $0 by $150k); unused losses carry forward. On sale, claimed depreciation is recaptured at up to 25%, and gains may owe capital-gains tax (a 1031 exchange can defer both). Figures are a year-1 estimate at your 24.0% rate — not tax advice; consult a CPA.
Schools (NCES district)
- District
- East Washington School Corporation
- NCES district ID
- 1803000
- Math proficiency
- 32% ▼ -10.00%
- Reading proficiency
- 40% ▼ -9.00%
- Median HH income
- $46,840
- Composite
- 30.85/100
- National rank
- #6127
- State rank
- #183 of 301 in IN
Livability — New Pekin
- Score
- 61/100
- State rank
- #492
- US rank
- #17523
Category grades
Schools grade is shown separately in the Schools card above.
Census & demographics
- Census place
- New Pekin, IN
- City population
- 6,599
- Population (ZIP)
- 6,599
Population outlook (Washington County) Hauer SSP2
- Today (2025)
- 26,460 people
- By 2030
- 25,498 · -3.6%
- By 2040
- 23,127 · -12.6%
- By 2050
- 20,505 · -22.5%
- By 2075
- 14,941 · -43.5%
- By 2100
- 10,453 · -60.5%
Race, ethnicity, and origin ACS 2023
- Neighborhood character
- Predominantly White (95%)
- Race & ethnicity
- White 95% Hispanic / Latino 2% Two or more races 2%
- Common ancestry
- Lithuanian 5% Italian 2% Serbian 2%
- Foreign-born
- 1% · Canada
- Languages at home
- 98% English-only · Spanish 1%
Political lean MEDSL · Washington
- 2024 margin
- Solid R (+54.8) · D 21.7% · R 76.5% · Other 1.7%
- 2008→2024 swing
- -37.5pp toward R · 2008: -17.3pp · 2024: -54.8pp
- All cycles
- 2024: R+54.8 2020: R+52.1 2016: R+49.1 2012: R+24.4 2008: R+17.3
Not yet ingested
- Civics
- —
Market trends
- HPI YoY
- ▼ -12.39%
- Current HPI
- 235.9666
- Rent YoY
- —
- Metro
- —
- State GDP YoY
- ▲ 2.90%
- F500 in state
- 18
Industry mix (Fortune 500 HQ in IN)
| Industry | F500 HQs | Revenue |
|---|---|---|
| Industrial Machinery | 2 | $37B |
|
||
| Healthcare | 1 | $177B |
|
||
| Pharmaceuticals | 1 | $45B |
|
||
| Metals / Steel | 1 | $18B |
|
||
| Agriculture | 1 | $17B |
|
||
| Packaging | 1 | $12B |
|
||
Price history
-17.4% since first listed3 events — show timeline
- 2026-06-04 Price Changed $95,000 SIRA
- 2026-05-06 Price Changed $105,000 SIRA
- 2026-04-25 Listed $115,000 SIRA
Property tax history
+4.6%/yrLatest (2024): $2,198 · +7.0% YoY. Source: county tax records.
Cash-flow waterfall
monthlySold comps — $/sqft
last 12 mo · ≤1 miLoading sold comps…