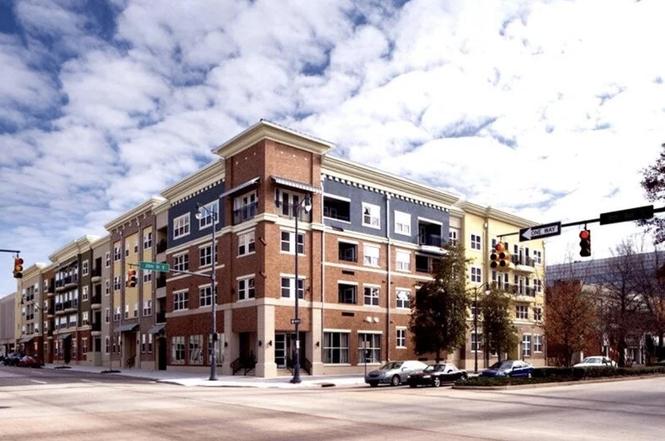
401 20th St S #306 · Birmingham, AL
Flood risk No data
- FEMA flood zone
- —
- Chance of flooding over 30 yrs
- —
- Est. flood insurance / yr
- —
Fire risk No data
- Est. fire insurance / yr
- —
Heat risk No data
- Hot days now (above threshold)
- —
- Hot days in 30 yrs
- —
Wind risk No data
- Chance of severe wind over 30 yrs
- —
Air-quality risk No data
- Unhealthy air days now
- —
- Unhealthy air days in 30 yrs
- —
Risk factors via First Street. Map © Google.
Why this score? — see what drove the F grade
The composite is a weighted blend of 9 inputs, each scored 0–100. Each bar is that input's sub-score; the figure is the points it added to the 100-point composite (weight × sub-score).
- ARV discount +7.5/15.0
- Appreciation +4.3/10.0
- 1% rule +4.2/10.0
- Livability +3.4/5.0
- Cash flow +2.5/30.0
- Condition / age +2.5/5.0
- Rent growth +1.8/5.0
- Schools +0.9/10.0
- DSCR +0.0/10.0
$180,000
🖨 Deal sheet (PDF) 📄 Offer letter ✓ Due diligence
Listing remarks
Bristol Southside Condo – Downtown Birmingham! Enjoy downtown living in this spacious 1 bedroom, 1 bathroom condo just two blocks from UAB Hospital and within walking distance of Publix, Starbucks, and Chipotle. Features include an eat-in kitchen with all appliances, ample cabinet space, a large walk-in closet, shower, and a covered, gated assigned parking space. Community amenities include a fitness center and resort style outdoor pool. Don't miss this opportunity to enjoy convenient, low-maintenance living in the heart of Birmingham!
Key facts
- Fitness center
- Eat-in kitchen
- Ample cabinet space
Tags
Property features AI
Finance
- Other: Unit/lot number 306; Located in Bristol Southside subdivision; Not in flood plain
- HOA & community: Monthly condo fee of $400; HOA fees cover cable TV, garbage collection, common grounds maintenance, building insurance, management fee, recreation facility, reserve for improvements, sewage service, utilities for common areas, water, and internet
Exterior
- Parking: Assigned parking; On-street parking available; Side garage entry with 1 garage space
- Security: No specific security features listed
- Utilities: Electric water heater; Private water; Connected sewer; Internet availability unknown
- Home design: Condominium unit on level 3; Existing (previously built) property; 4-side brick construction
- Construction: Slab foundation
- Exterior features: Balcony; No pool, patio, deck, or garden/patio listed; Not waterfront
Interior
- Kitchen: Stone countertops; Built-in dishwasher; Built-in microwave; Refrigerator; Electric stove
- Bedrooms: One bedroom on main level with walk-in closet
- Flooring: Carpet; Hardwood
- Bathrooms: One full bathroom on main level
- Heating & cooling: Central heating; Central air conditioning
- Interior features: 9-foot-plus ceilings; No additional built-in interior features listed
- Laundry & utility: Washer hookup in a closet on the main level; Dryer hookup (electric)
Neighborhood map
What this means for you Summary
Snapshot
- This is a 1-bed/1.0-bath condo listed at $180k.
Deal economics
- At list price, monthly cash flow is $-626 ($-8k/yr) — negative.
- To cash-flow at today's rent, offer at most $179k (0.6% below list).
- To meet the 1% rule (rent ≥ 1% of price), the offer needs to be $166k (8.0% below list).
- Recommended offer: $166k (8.0% below list) — sets the bar for 1% rule.
- Cap rate 2.1% vs local median 6.2% in Birmingham — below-typical yield; the buyer is paying a premium for something (appreciation thesis, condition, location) that the cap rate doesn't capture.
Location & tenants
- Location reads 67/100 on livability (#78 in AL) — a middle-class / working-renter tenant base. Strengths: commute A+, cost of living A+, housing A+; Watch: amenities C-, schools F, crime F.
- Birmingham City (urban): math 4% / reading 20% proficiency, ranked #116 of 129 in AL (top 90%) — low school quality limits family demand, transient renter base, plan for 1-2y turnover; 82% free/reduced lunch — lower-income household profile, screen leases tightly.
- Market conditions: Rents soft (-2.8%/yr); 54 active listings in the ZIP; 40 comparable units currently listed for rent nearby; rentals leasing fast (median 12d on market — plan ~1-2 weeks tenant-placement turnaround); 2,114 units permitted in Jefferson County in 2024 (556 in 5+ unit buildings).
- This rent runs 33% of the median local income ($60k/yr) — at the standard rent-burdened threshold; future hikes will face affordability resistance.
Forward outlook
- Local home prices are declining (-1.3%/yr); year-one equity from $1k of loan paydown is wiped out by about $2k of value loss. Plan a longer hold.
- Jefferson County population projected to shrink 4% by 2050 — rents likely to lag national; underwrite the cash flow, not the appreciation.
Negotiation context
- Only 11 days on market — expect competitive offers; lowballing is unlikely to land.
Risks & watch-outs
- Watch-outs: HOA is 37% of rent.
Questions for the listing agent
- What do current leases actually rent for vs. the listed asking? Can we see a recent rent roll and the last 12 months of T-12 income?
- What does the HOA fee cover, when was the last increase, and are there any pending special assessments or reserve-fund shortfalls?
- Any open or pending special assessments — roof, HVAC, plumbing, elevator, façade? What's the per-unit balance and payoff schedule, and is the seller paying it off at close or rolling it to the buyer?
- Is there a deadline driving the sale (1031 exchange, divorce, estate, relocation)? That informs how much negotiation room exists.
- Schools are F-rated, which usually means shorter tenancies and higher turnover. Who's the typical renter profile here, and what's been the actual vacancy rate?
- Crime grade is F in this area — have there been break-ins, vandalism, or insurance claims at this property in the last 3 years? What carrier currently insures it and at what premium?
- The area grade is low — what's the realistic commute time and amenity access for the typical tenant pool here? Any planned neighborhood developments (good or bad) we should know about?
- What's the average days-on-market for RENTAL listings here right now (not sales)? A rising rental-DOM trend means longer vacancies and softer asking-rent achievability than the comps imply.
- What's the recent tenant-quality profile in this submarket — average credit score on applications, eviction rate, late-payment / NSF rate, and stable-employment percentage? A property-management company in the area should have these aggregated.
- How much new apartment / multifamily construction is in the pipeline within 1–3 miles? Heavy new supply (>2% of stock underway) typically softens rents 12–24 months out; light construction supports rent growth.
Investment metrics
- 1% rule
- 0.92% ✗
- Cap rate
- 2.12%
- Cash-on-cash
- -14.89%
- DSCR
- 0.34
- GRM
- 9.1
CMA / ARV
No comps found within radius.
Projected returns pro-forma
-1.32% appreciation · 0.0% rent growth · sell at horizon
- IRR
- -31.0%
- Equity multiple
- -0.20×
- Total profit
- $-60,407
- Equity at exit
- $40,675
- IRR
- -32.1%
- Equity multiple
- -1.16×
- Total profit
- $-108,829
- Equity at exit
- $40,391
Cash invested: $50,400 (down + closing). Projections, not guarantees.
Landlord ↔ Tenant lean methodology
- Overall (STATE)
- 90 Strongly Landlord-Friendly
- State Alabama
- 90 Strongly Landlord-Friendly · R+15
- County
- — inherits STATE
- City
- — inherits STATE
ZIP-level market 35233
- Home prices YoY
- -1.2%
- Rents YoY
- -2.8%
- Active inventory
- 54
- Price-to-rent
- 9.1×
Monthly cashflow live
- Estimated rent
- $1,657 high interval (Pro) →
- Mortgage (P&I)
- −$944
- Tax from tax record
- −$297 /mo · $3,558/yr
- Insurance
- −$75
- HOA est. from 7 same-building comps
- −$619
- Vacancy / Maint / Mgmt
- −$348
- Net cashflow
- $-626
Break-even live
Sensitivity live
| Price | -10% $-524 | -5% $-575 | +0% $-626 | +5% $-676 | +10% $-727 |
|---|---|---|---|---|---|
| Rent | -10% $-756 | -5% $-691 | +0% $-626 | +5% $-560 | +10% $-495 |
| Rate | -1.0pp $-535 | -0.5pp $-580 | base $-626 | +0.5pp $-672 | +1.0pp $-720 |
UW: 25.0% down · 7.5% · 30yr · 1.5% tax · 5.0% vac · 8.0% maint · 8.0% mgmt
Financing live
Cash to close
- Down payment
- $45,000
- Closing costs
- $5,400
- Reserves months
- —
- Total cash needed
- —
Loan-product check · same deal, 3 products live
Conventional
25% down · 7.5% · 30yr
- Down + closing
- —
- Monthly P&I
- —
- Monthly cashflow
- —
- DSCR
- —
- Eligible?
- —
Personal DTI + credit; lowest rate.
DSCR
20% down · 8.5% · 30yr
- Down + closing
- —
- Monthly P&I
- —
- Monthly cashflow
- —
- DSCR
- —
- Eligible?
- —
No personal income docs; deal must DSCR.
Hard money
10% down · 12.0% · 12mo
- Down + closing
- —
- Monthly P&I
- —
- Monthly cashflow
- —
- DSCR
- —
- Eligible?
- —
Short-term bridge; refi at stabilization.
Rent comps 40 comps
| Address | Beds | Baths | Sqft | Rent | $/sqft | DOM | Units | Dist |
|---|---|---|---|---|---|---|---|---|
| 401 20th St S Birmingham, AL | 2.0–3.0 | 2.0 | 1163 | $2,100 | $1.81 | 18d | 2 | 0.02mi |
| 401 20th St S Birmingham, AL | 2.0 | 2.0 | 1295 | $2,000 | $1.54 | 13d | 2 | 0.02mi |
| 2020 5th Ave S Birmingham, AL | 1.0–3.0 | 1.0–2.5 | 1108 | $1,450 | $1.31 | 16d | 4 | 0.04mi |
| 425 20th St S Birmingham, AL | 2.0 | 1.0 | 532 | $1,955 | $3.67 | 23d | 18 | 0.04mi |
| 2014 3rd Ave S Birmingham, AL | 3.0 | 1.0–3.0 | 1107 | $1,772 | $1.60 | 4d | 73 | 0.13mi |
| 2000 2nd Ave S Birmingham, AL | 2.0 | 1.0–2.0 | 980 | $1,884 | $1.92 | 5d | 27 | 0.20mi |
| 1701 1st Ave S Birmingham, AL | 1.0–2.0 | 1.0–2.0 | 889 | $1,437 | $1.62 | 4d | 21 | 0.37mi |
| 2212 Morris Ave Apt 208 Birmingham, AL | 1.0 | 1.0 | 600 | $1,423 | $2.37 | 5d | 1 | 0.46mi |
| 1508 4th Ave S Birmingham, AL | 2.0 | 2.0 | 1142 | $2,222 | $1.95 | 5d | 3 | 0.48mi |
| 951 18th St S Birmingham, AL | 2.0 | 1.0–2.0 | 466 | $1,690 | $3.63 | 5d | 9 | 0.51mi |
| 2400 1st Ave S Birmingham, AL | 2.0 | 1.0–2.0 | 824 | $1,638 | $1.99 | 3d | 29 | 0.53mi |
| 120 19th St N Unit 312 Birmingham, AL | 2.0 | 2.0 | 952 | $3,495 | $3.67 | 45d | 1 | 0.54mi |
| 1001 20th St S Birmingham, AL | 4.0 | 1.0–4.0 | 824 | $1,670 | $2.03 | 4d | 22 | 0.55mi |
| 201 20th St N Birmingham, AL | 1.0 | 1.0 | 491 | $1,619 | $3.29 | 5d | 30 | 0.55mi |
| 120 19th St N Birmingham, AL | 1.0–2.0 | 1.0–2.0 | 886 | $1,670 | $1.88 | 4d | 14 | 0.55mi |
| 2021 10th Ave S Birmingham, AL | 1.0 | 1.0 | 484 | $1,160 | $2.40 | 45d | 1 | 0.55mi |
| 1911 3rd Ave N Birmingham, AL | — | 1.0 | 655 | $1,788 | $2.73 | 25d | 3 | 0.60mi |
| 1000 18th St S Unit 1000-11 Birmingham, AL | 1.0 | 1.0 | 600 | $812 | $1.35 | 45d | 1 | 0.60mi |
| 1010 18th St S Birmingham, AL | 1.0 | 1.0 | 600 | $865 | $1.44 | 5d | 1 | 0.61mi |
| 1329 4th Ave S #312 Birmingham, AL | 1.0 | 1.0 | 630 | $1,700 | $2.70 | 25d | 1 | 0.62mi |
| 1329 4th Ave S Birmingham, AL | 1.0 | 1.0 | 485 | $1,700 | $3.51 | 23d | 2 | 0.62mi |
| 2722 5th Ave S Birmingham, AL | 2.0 | 1.0–2.0 | 794 | $1,810 | $2.28 | 3d | 11 | 0.64mi |
| 1816 3rd Ave N Birmingham, AL | 1.0 | 1.0–1.5 | 1305 | $2,865 | $2.20 | 5d | 15 | 0.65mi |
| 2020 11th Ave S Birmingham, AL | 1.0 | 1.0 | 515 | $1,100 | $2.14 | 5d | 5 | 0.65mi |
| 2412 2nd Ave N #11 Birmingham, AL | 1.0 | 1.0 | 990 | $1,800 | $1.82 | 45d | 1 | 0.68mi |
| 1124 20th St S Birmingham, AL | 1.0–2.0 | 1.0 | 1123 | $1,048 | $0.93 | 12d | 2 | 0.70mi |
| 2155 11th Ct S Unit 1 Birmingham, AL | 1.0 | 1.0 | 625 | $811 | $1.30 | 4d | 1 | 0.76mi |
| 2155 11th Ct S Unit 11 Birmingham, AL | 1.0 | 1.0 | 625 | $851 | $1.36 | 23d | 1 | 0.76mi |
| 2808 7th Ave S Birmingham, AL | 1.0–2.0 | 1.0–2.0 | 933 | $1,309 | $1.40 | 3d | 11 | 0.76mi |
| 2808 7th Ave S Birmingham, AL | 1.0–2.0 | 1.0–2.0 | 933 | $1,214 | $1.30 | 12d | 11 | 0.76mi |
| 2230 Highland Ave Birmingham, AL | 2.0 | 1.0–2.0 | 968 | $2,390 | $2.47 | 3d | 272 | 0.78mi |
| 2251 Highland Ave S Birmingham, AL | 1.0 | 1.0 | 522 | $950 | $1.82 | 4d | 5 | 0.82mi |
| 2900 7th Ave S Birmingham, AL | 1.0–2.0 | 1.0–2.0 | 889 | $1,180 | $1.33 | 3d | 15 | 0.82mi |
| 1301 20th St S Unit B-11 Birmingham, AL | — | 1.0 | 636 | $750 | $1.18 | 45d | 1 | 0.83mi |
| 1711 13th Ave S Birmingham, AL | 1.0 | 2.0 | 1000 | $1,875 | $1.88 | 45d | 1 | 0.85mi |
| 57 Hanover Cir S Birmingham, AL | 1.0 | 1.0 | 600 | $1,300 | $2.17 | 45d | 1 | 0.85mi |
| 2173 Highland Ave S Birmingham, AL | 1.0–2.0 | 1.0–2.0 | 908 | $1,578 | $1.74 | 3d | 32 | 0.86mi |
| 1744 13th Ct S Unit 101 Birmingham, AL | 2.0 | 1.0 | 800 | $695 | $0.87 | 45d | 1 | 0.87mi |
| 2704 Hanover Cir Unit 2 Birmingham, AL | 1.0 | 1.0 | 600 | $915 | $1.52 | 25d | 1 | 0.87mi |
| 1701 13th Ave S Unit 2 Birmingham, AL | 2.0 | 1.0 | 708 | $1,168 | $1.65 | 45d | 1 | 0.88mi |
HOA detail condo
- Monthly dues
- $0 · $0/yr
- Likely covers
- poolgymsecurityparking
- Assessments
- None detected in remarks — confirm with the listing agent.
Listing history 7 events
-
2026-06-21days on market $180,000 Active 11 DOM
-
2026-06-18days on market $180,000 Active 8 DOM
-
2026-06-17days on market $180,000 Active 7 DOM
-
2026-06-16days on market $180,000 Active 6 DOM
-
2026-06-15days on market $180,000 Active 5 DOM
-
2026-06-13remarks 541-char remark
-
2026-06-13$180,000 Active 3 DOM
ⓘ Source: listings_history table (triggers on properties + properties_extension) + one-shot
backfill from property_details.listing_events for pre-trigger history.
Tax reassessment forecast AL · Resets to sale price
- Current annual tax
- $3,558 · $297/mo
- Projected year-2 tax
- $3,558 · $297/mo
- Expected delta
- $0/yr ($0/mo · 0.0%)
ⓘ Screening estimate from a state-policy table — verify with the county assessor before closing.
Nearby sold comps map
Loading sold comps map…
Walkable amenities ~0.75 mi
Loading nearby amenities…
Taxation est. · year 1
- Rental income
- $19,883
- − Mortgage interest
- −$10,083
- − Property taxes
- −$3,558
- − Insurance
- −$900
- − Repairs & maintenance
- −$1,591
- − Management
- −$1,591
- − HOA
- −$7,428
- − Depreciation
- −$5,236
- Taxable loss
- −$10,504
- Est. tax savings @ 24.0%
- +$2,521
- After-tax cash flow
- $-4,985/yr
For passive investors: Depreciation is non-cash, so a rental often shows a tax loss while cash-flowing — sheltering income. Rental losses are passive: they offset passive income freely, and up to $25,000/yr can offset ordinary (W-2) income if you actively participate and your MAGI is under $100k (phasing out to $0 by $150k); unused losses carry forward. On sale, claimed depreciation is recaptured at up to 25%, and gains may owe capital-gains tax (a 1031 exchange can defer both). Figures are a year-1 estimate at your 24.0% rate — not tax advice; consult a CPA.
Schools (NCES district)
- District
- Birmingham City
- NCES district ID
- 0100390
- Math proficiency
- 4% ▼ -17.00%
- Reading proficiency
- 20% ▼ -4.00%
- Median HH income
- $31,988
- Composite
- 9.49/100
- National rank
- #9850
- State rank
- #116 of 129 in AL
Livability — Birmingham
- Score
- 67/100
- State rank
- #78
- US rank
- #10412
Category grades
Schools grade is shown separately in the Schools card above.
Census & demographics
- Census place
- Birmingham, AL
- County
- Jefferson County · 527,445 people
- City population
- 210,422
- Metro
- Birmingham-Hoover, AL
- Population (ZIP)
- 3,570
- Household income
- $60,336
- Rent vs Own
- Severe rent burden
- 695.0
Population outlook (Jefferson County) Hauer SSP2
- Today (2025)
- 669,185 people
- By 2030
- 669,694 · +0.1%
- By 2040
- 661,388 · -1.2%
- By 2050
- 643,086 · -3.9%
- By 2075
- 577,267 · -13.7%
- By 2100
- 474,758 · -29.1%
Race, ethnicity, and origin ACS 2023
- Neighborhood character
- Highly diverse neighborhood (Simpson 0.70)
- Race & ethnicity
- White 44% Black 22% Asian 21% Hispanic / Latino 9% Two or more races 4%
- Hispanic origin (detail)
- Mexican 1% Puerto Rican 5%
- Common ancestry
- Lithuanian 3% Slovak 2% Portuguese 2%
- Foreign-born
- 20% · China, Canada, South Korea
- Languages at home
- 68% English-only · Other Indo-European 9% Spanish 8% Chinese 8%
Political lean MEDSL · Jefferson
- 2024 margin
- D (+10.4) · D 54.6% · R 44.2% · Other 1.2%
- 2008→2024 swing
- +5.4pp toward D · 2008: 5.1pp · 2024: 10.4pp
- All cycles
- 2024: D+10.4 2020: D+13.2 2016: D+7.2 2012: D+6.0 2008: D+5.1
Not yet ingested
- Civics
- —
Market trends
- HPI YoY
- ▼ -1.32%
- Current HPI
- 111.6176
- Rent YoY
- ▼ -2.84%
- Metro
- Birmingham-Hoover, AL
- State GDP YoY
- ▲ 2.94%
- F500 in state
- 4
Industry mix (Fortune 500 HQ in AL)
| Industry | F500 HQs | Revenue |
|---|---|---|
| Financial Services | 1 | $8B |
|
||
| Healthcare | 1 | $5B |
|
||
Price history
+12757.1% since first listed2 events — show timeline
- 2026-06-10 Listed $180,000 Greater Alabama MLS
- 2022-08-22 Price Changed $1,400 RENT.
Property tax history
+2.8%/yrLatest (2025): $3,558 · +0.0% YoY. Source: county tax records.
Cash-flow waterfall
monthlySold comps — $/sqft
last 12 mo · ≤1 miLoading sold comps…