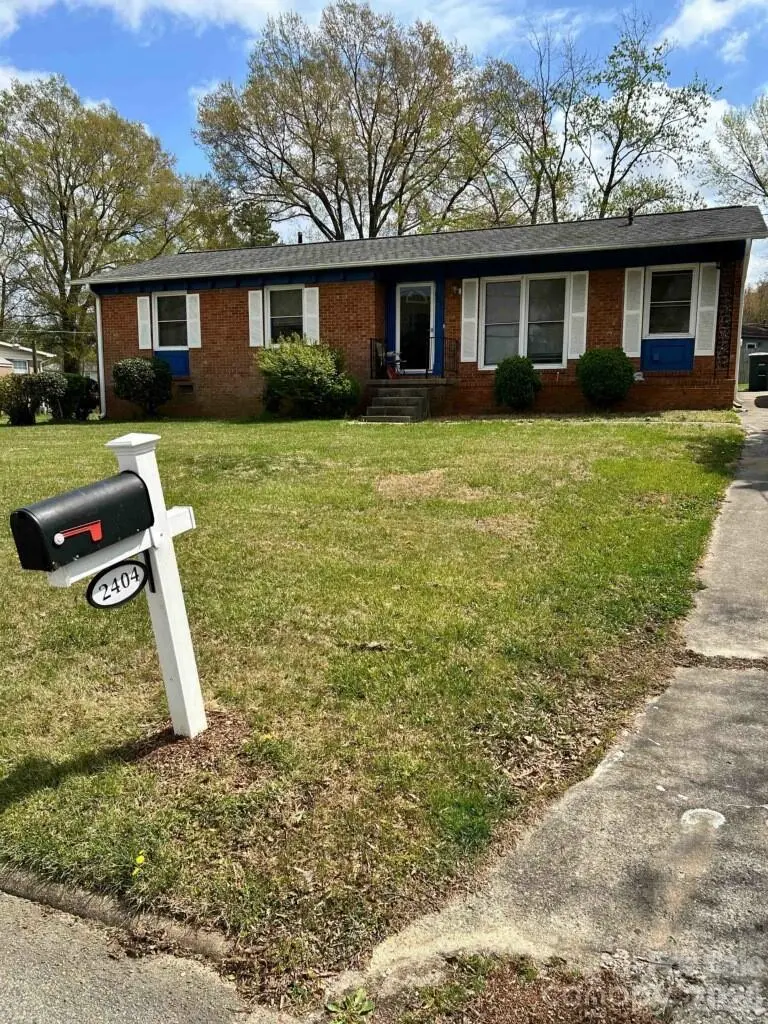
2404 Larkspur Dr · Greensboro, NC
Flood risk 1/10 · Minimal
- FEMA flood zone
- X (unshaded)
- Chance of flooding over 30 yrs
- 0.0%
- Est. flood insurance / yr
- $507 – $1,088
Fire risk 1/10 · Minimal
- Est. fire insurance / yr
- $906 – $1,684
Heat risk 6/10 · Moderate
- Hot days now (above 103°F)
- 7 days/yr
- Hot days in 30 yrs
- 18 days/yr
Wind risk 4/10 · Minor
- Chance of severe wind over 30 yrs
- 15.0%
Air-quality risk 2/10 · Minimal
- Unhealthy air days now
- 1 days/yr
- Unhealthy air days in 30 yrs
- 2 days/yr
Risk factors via First Street. Map © Google.
Why this score? — see what drove the C- grade
The composite is a weighted blend of 9 inputs, each scored 0–100. Each bar is that input's sub-score; the figure is the points it added to the 100-point composite (weight × sub-score).
- ARV discount +15.0/15.0
- Cash flow +14.6/30.0
- DSCR +4.5/10.0
- Livability +4.0/5.0
- Schools +3.6/10.0
- Rent growth +3.5/5.0
- 1% rule +3.4/10.0
- Condition / age +2.5/5.0
- Appreciation +0.0/10.0
$165,000
🖨 Deal sheet (PDF) 📄 Offer letter ✓ Due diligence
Listing remarks
Welcome to 2404 Larkspur Drive — a charming 3-bedroom, 1.5-bath home nestled in an established neighborhood in Greensboro. Offering approximately 1,225 square feet of comfortable living space on a spacious 0.27-acre lot, this property blends classic character with everyday functionality. The home features a welcoming layout with generously sized bedrooms, inviting living areas, and plenty of outdoor space for entertaining, gardening, or relaxing. Conveniently located near shopping, dining, schools, and major roadways, this home is a fantastic opportunity for first-time buyers, investors, or anyone looking to add their personal touch. Don’t miss your chance to make this Greensbor
Key facts
- 0.27 acre lot
- Built 1962
- Listed 31 days
Property features AI
Finance
- HOA & community: No HOA
Exterior
- Parking: Driveway
- Utilities: City/county water; Public/county sewer
- Home design: Single-family residence (site built); One story; Brick exterior; RS-9 zoning
- Construction: Brick construction; Built on site (site built); Other foundation (see remarks)
- Exterior features: Publicly maintained road access; Asphalt, gravel and paved road surfaces
Interior
- Kitchen: No appliances included
- Bedrooms: Three bedrooms on the main level
- Bathrooms: One full bathroom; One half bathroom
- Heating & cooling: Forced air heating; Natural gas heating; Wall furnace; Central air conditioning
- Interior features: Fireplace; One main-level room count
- Laundry & utility: Laundry inside the home
Neighborhood map
What this means for you Summary
Snapshot
- This is a 3-bed/1.5-bath single-family listed at $165k.
Deal economics
- At list price, monthly cash flow is $41 ($487/yr) — positive.
- The deal already cash-flows at list — no discount required.
- To meet the 1% rule (rent ≥ 1% of price), the offer needs to be $139k (15.9% below list).
- Recommended offer: $139k (15.9% below list) — sets the bar for 1% rule.
- Cap rate 6.6% vs local median 3.7% in Greensboro — top-decile yield for the area; either an underpriced asset or a hidden risk that comps aren't pricing in. Stress-test before assuming the spread holds.
Location & tenants
- Location reads 81/100 on livability (#12 in NC, #1,335 nationally) — a professional / high-income tenant draw. Strengths: amenities A+, commute A+, cost of living A+; Watch: employment D, crime F.
- Guilford County Schools (urban): math 39% / reading 45% proficiency, ranked #99 of 178 in NC (top 56%) — families likely to look elsewhere, expect single-tenant / working-renter base with shorter leases.
- Zoned schools: Ceasar Cone Elementary (math 13% / reading 14%, grade F, #1,355 of 1,410 statewide, top 96%, 465 students, 99% FRL); Swann Middle School (math 23% / reading 35%, grade F, #350 of 475 statewide, top 74%, 542 students, 99% FRL); Page High (math 42% / reading 52%, grade D-, #334 of 535 statewide, top 64%, 1,744 students, 56% FRL) — zoned schools average 85% FRL vs 52% district-wide (32 pts higher); higher-poverty schools than district average — tighter screening recommended.
- Zoned-school proficiency averages 30% at this address vs 42% district-wide (-12 pts) — the specific schools serving this property underperform the Guilford County Schools average; the district grade overstates school quality for this exact location.
- Market conditions: Rents rising (+3.8%/yr); 386 active listings in the ZIP; 29 comparable units currently listed for rent nearby; rentals at typical pace (median 25d on market — plan ~3-4 weeks tenant-placement turnaround); 3,843 units permitted in Guilford County in 2024 (2,397 in 5+ unit buildings).
- This rent runs 35% of the median local income ($47k/yr) — at the standard rent-burdened threshold; future hikes will face affordability resistance.
Forward outlook
- Local home prices are declining (-3.0%/yr); year-one equity from $1k of loan paydown is wiped out by about $5k of value loss. Plan a longer hold.
- Guilford County population projected at +26% by 2050 — long-run rental-demand tailwind backs the buy-and-hold thesis.
Negotiation context
- It's been on market 31 days — a 3% lower offer ($160k) is reasonable based on typical stale-listing flexibility.
- 2 sale attempts; this cycle's ask has dropped $12k (7%) from the opening price — seller is motivated, your offer sets the floor, not the list.
- Current owner paid $65k; list at $165k implies a 154% gain — meaningful room to come down on a strong offer.
Risks & watch-outs
- Climate carrying-cost: extreme-heat days projected 7→18/yr by 2055 (HVAC capex compounding) — expect insurance premiums to compound above CPI over the hold.
Questions for the listing agent
- It's been on market 31 days. Have you received any prior offers? Is the seller open to a 16% concession, seller financing, or rate buy-down credit?
- Built in 1962 — when were the roof, HVAC, electrical panel, plumbing, and water heater last replaced?
- Is there a deadline driving the sale (1031 exchange, divorce, estate, relocation)? That informs how much negotiation room exists.
- Crime grade is F in this area — have there been break-ins, vandalism, or insurance claims at this property in the last 3 years? What carrier currently insures it and at what premium?
- What's the average days-on-market for RENTAL listings here right now (not sales)? A rising rental-DOM trend means longer vacancies and softer asking-rent achievability than the comps imply.
- What's the recent tenant-quality profile in this submarket — average credit score on applications, eviction rate, late-payment / NSF rate, and stable-employment percentage? A property-management company in the area should have these aggregated.
- How much new for-sale + rental construction is in the pipeline within 1–3 miles? Heavy new supply typically softens prices + rents 12–24 months out; constrained supply supports both.
Investment metrics
- 1% rule
- 0.84% ✗
- Cap rate
- 6.59%
- Cash-on-cash
- 1.05%
- DSCR
- 1.05
- GRM
- 9.9
CMA / ARV
- ARV (on-the-fly)
- $214,375
- Comps found
- 12
Show comp detail 12 sales within ~0.75 mi
| Address | Dist | Beds/Ba | Sqft | Sold | Price | $/sf | Match |
|---|---|---|---|---|---|---|---|
| 1600 Glenridge Rd | 0.13mi | 3/1.5 | 1,256 (+2%) | 2mo | $185,000 | $147 | 88 |
| 1302 Haverhill Dr | 0.29mi | 4/2.0 (+1) | 1,215 (-1%) | 9mo | $215,000 | $177 | 70 |
| 2900 Patio Pl | 0.32mi | 4/2.0 (+1) | 1,198 (-2%) | 6mo | $95,000 | $79 | 70 |
| 1402 Wayside Dr | 0.67mi | 3/2.0 | 1,226 (+0%) | 4mo | $208,000 | $170 | 63 |
| 1429 Old Hickory Dr | 0.40mi | 3/2.0 | 1,092 (-11%) | 1mo | $225,000 | $206 | 60 |
| 2302 Bywood Rd | 0.22mi | 3/1.0 | 1,081 (-12%) | 10mo | $195,000 | $180 | 60 |
| 2019 Phillips Ave | 0.44mi | 3/1.0 | 1,096 (-10%) | 4mo | $160,000 | $146 | 57 |
| 1209 Willard St | 0.60mi | 3/2.5 | 1,150 (-6%) | 9mo | $229,900 | $200 | 50 |
| 1 Partnership Ct | 0.44mi | 3/2.0 | 1,076 (-12%) | 9mo | $205,000 | $191 | 50 |
| 2902 Phillips Ave | 0.70mi | 3/1.5 | 1,385 (+13%) | 2mo | $220,000 | $159 | 44 |
| 2619 Phillips Ave | 0.56mi | 2/1.0 (-1) | 1,063 (-13%) | 2mo | $90,000 | $85 | 43 |
| 1814 Gordon St | 0.74mi | 4/2.0 (+1) | 1,374 (+12%) | 10mo | $240,000 | $175 | 30 |
Match score weights: distance 35% · size 25% · config 20% · recency 20%. Top-matched comps best support the ARV.
Projected returns pro-forma
-3.0% appreciation · 3.83% rent growth · sell at horizon
- IRR
- -13.8%
- Equity multiple
- 0.50×
- Total profit
- $-23,014
- Equity at exit
- $24,602
- IRR
- -3.8%
- Equity multiple
- 0.74×
- Total profit
- $-11,960
- Equity at exit
- $14,266
Cash invested: $46,200 (down + closing). Projections, not guarantees.
Landlord ↔ Tenant lean methodology
- Overall (STATE)
- 85 Strongly Landlord-Friendly
- State North Carolina
- 85 Strongly Landlord-Friendly · R+3
- County
- — inherits STATE
- City
- — inherits STATE
ZIP-level market 27405
- Home prices YoY
- -20.6%
- Rents YoY
- 3.8%
- Active inventory
- 386
- Price-to-rent
- 9.9×
Monthly cashflow live
- Estimated rent
- $1,388 high interval (Pro) →
- Mortgage (P&I)
- −$865
- Tax from tax record
- −$122 /mo · $1,460/yr
- Insurance
- −$69
- HOA
- −$0
- Vacancy / Maint / Mgmt
- −$291
- Net cashflow
- $41
Break-even live
Sensitivity live
| Price | -10% $134 | -5% $87 | +0% $41 | +5% $-6 | +10% $-53 |
|---|---|---|---|---|---|
| Rent | -10% $-69 | -5% $-14 | +0% $41 | +5% $95 | +10% $150 |
| Rate | -1.0pp $124 | -0.5pp $83 | base $41 | +0.5pp $-2 | +1.0pp $-46 |
UW: 25.0% down · 7.5% · 30yr · 1.5% tax · 5.0% vac · 8.0% maint · 8.0% mgmt
Financing live
Cash to close
- Down payment
- $41,250
- Closing costs
- $4,950
- Reserves months
- —
- Total cash needed
- —
Loan-product check · same deal, 3 products live
Conventional
25% down · 7.5% · 30yr
- Down + closing
- —
- Monthly P&I
- —
- Monthly cashflow
- —
- DSCR
- —
- Eligible?
- —
Personal DTI + credit; lowest rate.
DSCR
20% down · 8.5% · 30yr
- Down + closing
- —
- Monthly P&I
- —
- Monthly cashflow
- —
- DSCR
- —
- Eligible?
- —
No personal income docs; deal must DSCR.
Hard money
10% down · 12.0% · 12mo
- Down + closing
- —
- Monthly P&I
- —
- Monthly cashflow
- —
- DSCR
- —
- Eligible?
- —
Short-term bridge; refi at stabilization.
Rent comps 29 comps
| Address | Beds | Baths | Sqft | Rent | $/sqft | DOM | Units | Dist |
|---|---|---|---|---|---|---|---|---|
| 8 Kings Forest Ct Greensboro, NC | 3.0 | 2.0 | 1120 | $1,650 | $1.47 | 25d | 1 | 0.19mi |
| 1622 Mcpherson St Unit 1912 Greensboro, NC | 2.0 | 1.0 | 860 | $850 | $0.99 | 25d | 1 | 0.63mi |
| 4302 Belfield Dr Greensboro, NC | 3.0 | 2.0 | 1300 | $1,755 | $1.35 | 25d | 1 | 0.64mi |
| 1608 McPherson St Greensboro, NC | 3.0 | 2.0 | 1100 | $1,450 | $1.32 | 25d | 1 | 0.71mi |
| 1504 Autumn Dr Unit A Greensboro, NC | 2.0 | 1.0 | 820 | $895 | $1.09 | 25d | 1 | 0.87mi |
| 1603 Autumn Dr Apt A Greensboro, NC | 2.0 | 1.0 | 820 | $925 | $1.13 | 16d | 1 | 0.89mi |
| 1703 10th St Unit A Greensboro, NC | 3.0 | 1.0 | 864 | $1,075 | $1.24 | 25d | 1 | 0.92mi |
| 4214 Kildare Dr Greensboro, NC | 3.0 | 1.5 | 1329 | $1,450 | $1.09 | 25d | 1 | 0.95mi |
| 810 Elwell Ave Greensboro, NC | 3.0 | 2.0 | 1280 | $1,500 | $1.17 | 16d | 1 | 0.95mi |
| 2811 N Ohenry Blvd Unit D Greensboro, NC | 2.0 | 1.0 | 1000 | $1,050 | $1.05 | 25d | 1 | 1.00mi |
| 703 Sykes Ave Greensboro, NC | 2.0 | 1.0 | 923 | $1,295 | $1.40 | 25d | 1 | 1.03mi |
| 1508 Tucker St Greensboro, NC | 2.0 | 2.0 | 875 | $1,195 | $1.37 | 25d | 1 | 1.05mi |
| 2829 N Ohenry Blvd Unit D Greensboro, NC | 2.0 | 1.0 | 912 | $1,250 | $1.37 | 25d | 1 | 1.07mi |
| 2825 N O.Henry Blvd Unit 2825C Greensboro, NC | 2.0 | 1.0 | 836 | $1,300 | $1.56 | 16d | 1 | 1.07mi |
| 2831 N Ohenry Blvd Greensboro, NC | 2.0 | 1.0 | 912 | $950 | $1.04 | 16d | 1 | 1.09mi |
| 1604 17th St Greensboro, NC | 2.0 | 1.0 | 990 | $992 | $1.00 | 25d | 7 | 1.12mi |
| 610 Holt Ave Greensboro, NC | 2.0 | 1.0 | 1092 | $1,300 | $1.19 | 16d | 1 | 1.13mi |
| 209 Woodnell St Unit H Greensboro, NC | 2.0 | 1.0 | 750 | $975 | $1.30 | 21d | 1 | 1.14mi |
| 3128 Utah Pl Greensboro, NC | 1.0–3.0 | 1.0–2.0 | 1076 | $1,375 | $1.28 | 25d | 6 | 1.14mi |
| 2509 Pinnix St Unit B Greensboro, NC | 3.0 | 2.0 | 860 | $995 | $1.16 | 25d | 1 | 1.15mi |
| 210 Woodnell St Unit G Greensboro, NC | 2.0 | 1.0 | 750 | $975 | $1.30 | 25d | 1 | 1.17mi |
| 1604 Textile Dr Greensboro, NC | 2.0 | 1.0 | 930 | $1,245 | $1.34 | 25d | 1 | 1.19mi |
| 129 Aunt Mary Ave Unit A Greensboro, NC | 2.0 | 1.0 | 800 | $950 | $1.19 | 25d | 1 | 1.20mi |
| 4216 Parker St Unit C Greensboro, NC | 2.0 | 1.0 | 800 | $825 | $1.03 | 23d | 1 | 1.23mi |
| 1724 Kay St Greensboro, NC | 3.0 | 2.0 | 1332 | $1,600 | $1.20 | 23d | 1 | 1.23mi |
| 3206 Spring St Greensboro, NC | 4.0 | 2.0 | 1200 | $1,500 | $1.25 | 23d | 1 | 1.33mi |
| 1608 Kay St Greensboro, NC | 3.0 | 2.0 | 1184 | $1,525 | $1.29 | 25d | 1 | 1.36mi |
| 3102 Summit Ave Greensboro, NC | 2.0 | 1.0 | 999 | $1,100 | $1.10 | 25d | 1 | 1.39mi |
| 309 Holt Ave Greensboro, NC | 2.0 | 1.0 | 1000 | $1,175 | $1.18 | 25d | 1 | 1.40mi |
Listing history 13 events
-
2026-06-22days on market $165,000 Active 31 DOM
-
2026-06-18days on market $165,000 Active 28 DOM
-
2026-06-17days on market $165,000 Active 27 DOM
-
2026-06-16days on market $165,000 Active 26 DOM
-
2026-06-15pricedays on market $165,000 Active 25 DOM
-
2026-06-14days on market $172,000 Active 23 DOM
-
2026-06-10days on market $172,000 Active 20 DOM
-
2026-06-09days on market $172,000 Active 19 DOM
-
2026-06-08days on market $172,000 Active 18 DOM
-
2026-06-07days on market $172,000 Active 17 DOM
-
2026-06-03days on market $172,000 Active 13 DOM
-
2026-06-03remarks 687-char remark
-
2026-06-03$172,000 Active 12 DOM
ⓘ Source: listings_history table (triggers on properties + properties_extension) + one-shot
backfill from property_details.listing_events for pre-trigger history.
Tax reassessment forecast NC · Resets to sale price
- Current annual tax
- $1,460 · $122/mo
- Projected year-2 tax
- $1,460 · $122/mo
- Expected delta
- $0/yr ($0/mo · 0.0%)
ⓘ Screening estimate from a state-policy table — verify with the county assessor before closing.
Climate risk First Street
- Flood 1/10 Low FEMA zone X (unshaded) · 0% chance over 30 yrs
- Wildfire 1/10 Low
- Heat 6/10 Major 7 d/yr ≥103°F today · 18 d/yr by 30 yrs out
- Wind 4/10 Moderate 15% chance of damaging wind over 30 yrs
- Air quality 2/10 Low 1 unhealthy d/yr today · 2 by 30 yrs out
Nearby sold comps map
Loading sold comps map…
Walkable amenities ~0.75 mi
Loading nearby amenities…
Taxation est. · year 1
- Rental income
- $16,652
- − Mortgage interest
- −$9,243
- − Property taxes
- −$1,460
- − Insurance
- −$825
- − Repairs & maintenance
- −$1,332
- − Management
- −$1,332
- − Depreciation
- −$4,800
- Taxable loss
- −$2,339
- Est. tax savings @ 24.0%
- +$561
- After-tax cash flow
- $1,049/yr
For passive investors: Depreciation is non-cash, so a rental often shows a tax loss while cash-flowing — sheltering income. Rental losses are passive: they offset passive income freely, and up to $25,000/yr can offset ordinary (W-2) income if you actively participate and your MAGI is under $100k (phasing out to $0 by $150k); unused losses carry forward. On sale, claimed depreciation is recaptured at up to 25%, and gains may owe capital-gains tax (a 1031 exchange can defer both). Figures are a year-1 estimate at your 24.0% rate — not tax advice; consult a CPA.
Schools (NCES district)
- District
- Guilford County Schools
- NCES district ID
- 3701920
- Math proficiency
- 39% ▲ 1.00%
- Reading proficiency
- 45% ▲ 1.00%
- Median HH income
- $46,315
- Composite
- 35.78/100
- National rank
- #4842
- State rank
- #99 of 178 in NC
Livability — Greensboro
- Score
- 81/100
- State rank
- #12
- US rank
- #1335
Category grades
Schools grade is shown separately in the Schools card above.
Census & demographics
- Census place
- Greensboro, NC
- County
- Guilford County · 487,190 people
- City population
- 329,421
- Metro
- Greensboro-High Point, NC
- Population (ZIP)
- 54,303
- Household income
- $47,431
- Rent vs Own
- Severe rent burden
- 2517.0
Population outlook (Guilford County) Hauer SSP2
- Today (2025)
- 584,596 people
- By 2030
- 616,851 · +5.5%
- By 2040
- 678,451 · +16.1%
- By 2050
- 734,788 · +25.7%
- By 2075
- 862,985 · +47.6%
- By 2100
- 948,704 · +62.3%
Race, ethnicity, and origin ACS 2023
- Neighborhood character
- Diverse neighborhood (Simpson 0.62)
- Race & ethnicity
- Black 57% White 20% Hispanic / Latino 14% Two or more races 7% Asian 4%
- Hispanic origin (detail)
- Mexican 9% Puerto Rican 2%
- Common ancestry
- Romanian 1% Ukrainian 1% Italian 1%
- Foreign-born
- 15% · Canada, Vietnam, China
- Languages at home
- 79% English-only · Spanish 11% Other Asian/Pacific 2% Other Indo-European 1%
Political lean MEDSL · Guilford
- 2024 margin
- Strong D (+21.8) · D 60.2% · R 38.4% · Other 1.4%
- 2008→2024 swing
- +3.5pp toward D · 2008: 18.4pp · 2024: 21.8pp
- All cycles
- 2024: D+21.8 2020: D+23.1 2016: D+20.0 2012: D+16.5 2008: D+18.4
Not yet ingested
- Civics
- —
Market trends
- HPI YoY
- ▼ -63.02%
- Current HPI
- 243.1261
- Rent YoY
- ▲ 3.83%
- Metro
- Greensboro-High Point, NC
- State GDP YoY
- ▲ 3.28%
- F500 in state
- 26
Industry mix (Fortune 500 HQ in NC)
| Industry | F500 HQs | Revenue |
|---|---|---|
| Financial Services | 2 | $213B |
|
||
| Retail | 2 | $95B |
|
||
| Industrial Conglomerate | 1 | $38B |
|
||
| Metals / Steel | 1 | $35B |
|
||
| Utilities | 1 | $30B |
|
||
| Industrial Machinery | 1 | $19B |
|
||
Price history
+142.3% since first listed5 events — show timeline
- 2026-06-02 Relisted — CANOPYMLS as Distributed by MLS Grid
- 2026-05-18 Price Changed $172,000 CANOPYMLS as Distributed by MLS Grid
- 2026-05-09 Listed $177,000 CANOPYMLS as Distributed by MLS Grid
- 1996-11-21 Sold (Public Records) $65,000 Public Records
- 1995-12-06 Sold (Public Records) $71,000 Public Records
Property tax history
+3.5%/yrLatest (2025): $1,460 · -1.0% YoY. Source: county tax records.
Cash-flow waterfall
monthlySold comps — $/sqft
last 12 mo · ≤1 miLoading sold comps…