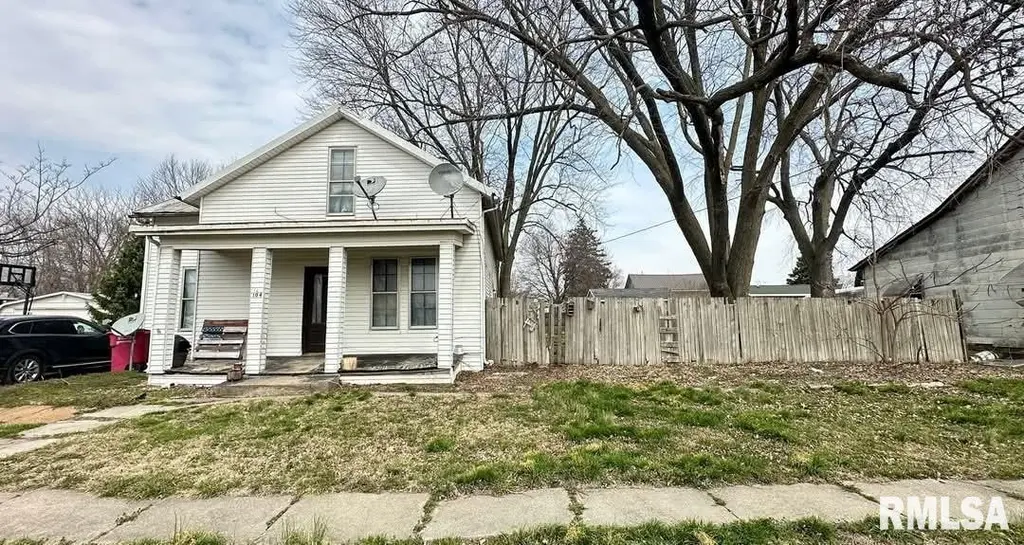
104 W Edwards St · Payson, IL
Flood risk 1/10 · Minimal
- FEMA flood zone
- X (unshaded)
- Chance of flooding over 30 yrs
- 0.0%
- Est. flood insurance / yr
- $473 – $860
Fire risk 1/10 · Minimal
- Est. fire insurance / yr
- $804 – $1,492
Heat risk 3/10 · Minor
- Hot days now (above 105°F)
- 7 days/yr
- Hot days in 30 yrs
- 18 days/yr
Wind risk 2/10 · Minimal
- Chance of severe wind over 30 yrs
- —
Air-quality risk 1/10 · Minimal
- Unhealthy air days now
- 0 days/yr
- Unhealthy air days in 30 yrs
- 0 days/yr
Risk factors via First Street. Map © Google.
Why this score? — see what drove the B- grade
The composite is a weighted blend of 9 inputs, each scored 0–100. Each bar is that input's sub-score; the figure is the points it added to the 100-point composite (weight × sub-score).
- Cash flow +30.0/30.0
- 1% rule +10.0/10.0
- DSCR +10.0/10.0
- ARV discount +7.5/15.0
- Livability +3.4/5.0
- Rent growth +2.5/5.0
- Condition / age +2.5/5.0
- Schools +1.6/10.0
- Appreciation +0.0/10.0
$40,000
🖨 Deal sheet 📄 Offer letter ✓ Due diligence
Listing remarks
1.5-story home offering strong potential for the right buyer ready to take on a project. This 3-bedroom home—with the possibility of a 4th bedroom—features main floor laundry and a layout that allows for flexible redesign. Situated on a large lot with a 1-car detached garage, the property offers a solid footprint to work with. The home is in need of an overhaul and does not currently have ductwork to the second story, making this an ideal candidate for a full rehab or investment opportunity. Bring your vision and transform this property into something special.
Key facts
- 0.23 acre lot
- Garage
- Listed 62 days
Property features AI
Exterior
- Parking: Detached 1-car garage
- Utilities: Public water; Public sewer
- Home design: Single-family residence; Multiple levels including main, upper, lower and basement
- Construction: Not new construction
- Exterior features: Level lot; Metal roof
Interior
- Kitchen: Kitchen present (includes refrigerator)
- Bedrooms: 3 bedrooms (one on main level, others on upper level)
- Flooring: Carpet in bedrooms, living room, and recreation room; Vinyl flooring in kitchen; Other flooring in laundry
- Bathrooms: 1 full bathroom
- Heating & cooling: Forced air heating; Gas water heater
- Interior features: Refrigerator included; Partial basement
- Laundry & utility: Main-level laundry room
Neighborhood map
What this means for you Summary
Snapshot
- This is a 3-bed/1.0-bath single-family listed at $40k.
Deal economics
- At list price, monthly cash flow is $678 ($8k/yr) — positive.
- The deal already cash-flows at list — no discount required.
- Meets the 1% rule at list price ($1k rent vs $40k).
- Recommended offer: $38k (6.0% below list) — sets the bar for market timing.
Location & tenants
- Location reads 67/100 on livability (#536 in IL) — a middle-class / working-renter tenant base. Strengths: crime A+, cost of living A+, housing A+; Watch: schools F, amenities F, commute F.
- Payson CUSD 1 (rural): math 16% / reading 18% proficiency, ranked #463 of 620 in IL (top 75%) — low school quality limits family demand, transient renter base, plan for 1-2y turnover.
- Market conditions: 9 active listings in the ZIP; 68 units permitted in Adams County in 2024 (0 in 5+ unit buildings).
Forward outlook
- Local home prices are declining (-3.0%/yr); year-one equity from $277 of loan paydown is wiped out by about $1k of value loss. Plan a longer hold.
- Adams County population projected at -14% by 2050 — secular population decline; favor cash flow + early exit over multi-decade hold.
- At projected returns (-3.0% appreciation + 3.0% rent growth), your $11k cash investment doubles in ~2 years — after that, you're playing with house money.
Negotiation context
- It's been on market 62 days — a 6% lower offer ($38k) is reasonable based on typical stale-listing flexibility.
Questions for the listing agent
- It's been on market 62 days. Have you received any prior offers? Is the seller open to a 6% concession, seller financing, or rate buy-down credit?
- Why hasn't it sold? Are there any deal-killer items the seller is aware of (foundation, flood, title, zoning, code violations)?
- Is there a deadline driving the sale (1031 exchange, divorce, estate, relocation)? That informs how much negotiation room exists.
- Schools are F-rated, which usually means shorter tenancies and higher turnover. Who's the typical renter profile here, and what's been the actual vacancy rate?
- What's the average days-on-market for RENTAL listings here right now (not sales)? A rising rental-DOM trend means longer vacancies and softer asking-rent achievability than the comps imply.
- What's the recent tenant-quality profile in this submarket — average credit score on applications, eviction rate, late-payment / NSF rate, and stable-employment percentage? A property-management company in the area should have these aggregated.
- How much new for-sale + rental construction is in the pipeline within 1–3 miles? Heavy new supply typically softens prices + rents 12–24 months out; constrained supply supports both.
Investment metrics
- 1% rule
- 3.07% ✓
- Cap rate
- 26.63%
- Cash-on-cash
- 72.65%
- DSCR
- 4.23
- GRM
- 2.7
CMA / ARV
- ARV (on-the-fly)
- $198,541
- Comps found
- 8
Show comp detail 8 sales within ~0.75 mi
| Address | Dist | Beds/Ba | Sqft | Sold | Price | $/sf | Match |
|---|---|---|---|---|---|---|---|
| 104 W Edwards St | 0.00mi | 3/1.0 | 1,757 (0%) | 1mo | $37,000 | $21 | 99 |
| 307 E State St | 0.25mi | 3/1.0 | 1,849 (+5%) | 2mo | $210,000 | $114 | 78 |
| 309 W Edwards St | 0.20mi | 3/2.0 | 1,935 (+10%) | 0mo | $265,000 | $137 | 70 |
| 406 N Main St | 0.21mi | 3/2.0 | 1,565 (-11%) | 4mo | $255,000 | $163 | 65 |
| 101 W Perkins St | 0.29mi | 3/2.0 | 1,620 (-8%) | 14mo | $179,000 | $110 | 58 |
| 335 Sumac St | 0.66mi | 3/1.0 | 1,801 (+2%) | 10mo | $94,900 | $53 | 57 |
| 506 Magnolia St | 0.48mi | 3/2.0 | 1,588 (-10%) | 4mo | $180,000 | $113 | 54 |
| 427 Briarwood Dr | 0.45mi | 2/2.0 (-1) | 1,602 (-9%) | 5mo | $120,000 | $75 | 51 |
Match score weights: distance 35% · size 25% · config 20% · recency 20%. Top-matched comps best support the ARV.
Projected returns pro-forma
-3.0% appreciation · 3.0% rent growth · sell at horizon
- IRR
- 72.4%
- Equity multiple
- 4.28×
- Total profit
- $36,731
- Equity at exit
- $5,964
- IRR
- 76.3%
- Equity multiple
- 8.83×
- Total profit
- $87,709
- Equity at exit
- $3,458
Cash invested: $11,200 (down + closing). Projections, not guarantees.
Landlord ↔ Tenant lean methodology
- Overall (STATE)
- 43 Moderately Tenant-Leaning
- State Illinois
- 43 Moderately Tenant-Leaning · D+7
- County
- — inherits STATE
- City
- — inherits STATE
ZIP-level market 62360
- Home prices YoY
- -8.4%
- Active inventory
- 9
- Price-to-rent
- 2.7×
Monthly cashflow live
- Estimated rent
- $1,229 medium interval (Pro) →
- Mortgage (P&I)
- −$210
- Tax from tax record
- −$67 /mo · $801/yr
- Insurance
- −$17
- HOA
- −$0
- Vacancy / Maint / Mgmt
- −$258
- Net cashflow
- $678
Break-even live
UW: 25.0% down · 7.5% · 30yr · 1.5% tax · 5.0% vac · 8.0% maint · 8.0% mgmt
Financing live
Cash to close
- Down payment
- $10,000
- Closing costs
- $1,200
- Reserves months
- —
- Total cash needed
- —
Loan-product check · same deal, 3 products live
Conventional
25% down · 7.5% · 30yr
- Down + closing
- —
- Monthly P&I
- —
- Monthly cashflow
- —
- DSCR
- —
- Eligible?
- —
Personal DTI + credit; lowest rate.
DSCR
20% down · 8.5% · 30yr
- Down + closing
- —
- Monthly P&I
- —
- Monthly cashflow
- —
- DSCR
- —
- Eligible?
- —
No personal income docs; deal must DSCR.
Hard money
10% down · 12.0% · 12mo
- Down + closing
- —
- Monthly P&I
- —
- Monthly cashflow
- —
- DSCR
- —
- Eligible?
- —
Short-term bridge; refi at stabilization.
Listing history 9 events
-
2026-04-14historical Under Contract
-
2026-04-02price $40,000
-
2026-03-25$50,000 Active
-
2022-09-27historical
-
2022-09-27historical
-
2022-09-27historical
-
2013-07-18historical
-
2011-06-02historical
-
2008-02-15historical
ⓘ Source: listings_history table (triggers on properties + properties_extension) + one-shot
backfill from property_details.listing_events for pre-trigger history.
Tax reassessment forecast IL · Partial reset (capped growth)
- Current annual tax
- $801 · $67/mo
- Projected year-2 tax
- $855 · $71/mo
- Expected delta
- +$53/yr (+$4/mo · 6.6%)
ⓘ Screening estimate from a state-policy table — verify with the county assessor before closing.
Climate risk First Street
- Flood 1/10 Low FEMA zone X (unshaded) · 0% chance over 30 yrs
- Wildfire 1/10 Low
- Heat 3/10 Moderate 7 d/yr ≥105°F today · 18 d/yr by 30 yrs out
- Wind 2/10 Low
- Air quality 1/10 Low 0 unhealthy d/yr today · 0 by 30 yrs out
Nearby sold comps map
Loading sold comps map…
Walkable amenities ~0.75 mi
Loading nearby amenities…
Taxation est. · year 1
- Rental income
- $14,753
- − Mortgage interest
- −$2,241
- − Property taxes
- −$801
- − Insurance
- −$200
- − Repairs & maintenance
- −$1,180
- − Management
- −$1,180
- − Depreciation
- −$1,164
- Taxable income
- $7,987
- Est. tax owed @ 24.0%
- −$1,917
- After-tax cash flow
- $6,220/yr
For passive investors: Depreciation is non-cash, so a rental often shows a tax loss while cash-flowing — sheltering income. Rental losses are passive: they offset passive income freely, and up to $25,000/yr can offset ordinary (W-2) income if you actively participate and your MAGI is under $100k (phasing out to $0 by $150k); unused losses carry forward. On sale, claimed depreciation is recaptured at up to 25%, and gains may owe capital-gains tax (a 1031 exchange can defer both). Figures are a year-1 estimate at your 24.0% rate — not tax advice; consult a CPA.
Schools (NCES district)
- District
- Payson CUSD 1
- NCES district ID
- 1730990
- Math proficiency
- 16% ▼ -3.00%
- Reading proficiency
- 18% ▼ -10.00%
- Median HH income
- $52,664
- Composite
- 15.68/100
- National rank
- #9284
- State rank
- #463 of 620 in IL
Livability — Payson
- Score
- 67/100
- State rank
- #536
- US rank
- #11127
Category grades
Schools grade is shown separately in the Schools card above.
Census & demographics
- Census place
- Payson, IL
- Population (ZIP)
- 1,540
Population outlook (Adams County) Hauer SSP2
- Today (2025)
- 65,795 people
- By 2030
- 64,436 · -2.1%
- By 2040
- 61,007 · -7.3%
- By 2050
- 56,851 · -13.6%
- By 2075
- 46,424 · -29.4%
- By 2100
- 34,305 · -47.9%
Race, ethnicity, and origin ACS 2023
- Neighborhood character
- Predominantly White (96%)
- Race & ethnicity
- White 96% Asian 2% Two or more races 2% Hispanic / Latino 1%
- Common ancestry
- Italian 3% Slovak 1% Serbian 1%
- Foreign-born
- 0%
Political lean MEDSL · Adams
- 2024 margin
- Solid R (+47.4) · D 25.6% · R 73.0% · Other 1.5%
- 2008→2024 swing
- -25.0pp toward R · 2008: -22.4pp · 2024: -47.4pp
- All cycles
- 2024: R+47.4 2020: R+46.5 2016: R+47.5 2012: R+35.2 2008: R+22.4
Not yet ingested
- Civics
- —
Market trends
- HPI YoY
- ▼ -12.55%
- Current HPI
- 135.975
- Rent YoY
- —
- Metro
- —
- State GDP YoY
- ▲ 1.59%
- F500 in state
- 60
Industry mix (Fortune 500 HQ in IL)
| Industry | F500 HQs | Revenue |
|---|---|---|
| Insurance | 4 | $201B |
|
||
| Consumer Goods | 4 | $87B |
|
||
| Industrial Machinery | 3 | $64B |
|
||
| Healthcare | 2 | $55B |
|
||
| Retail / Pharmacy | 1 | $148B |
|
||
| Agriculture / Food | 1 | $86B |
|
||
Price history
-20.0% since first listed9 events — show timeline
- 2026-04-14 Contingent — RMLSA as Distributed by MLS Grid
- 2026-04-02 Price Changed $40,000 RMLSA as Distributed by MLS Grid
- 2026-03-25 Listed $50,000 RMLSA as Distributed by MLS Grid
- 2022-09-27 Listing Removed — RMLSA as Distributed by MLS Grid
- 2022-09-27 Listing Removed — RMLSA as Distributed by MLS Grid
- 2022-09-27 Listing Removed — RMLSA as Distributed by MLS Grid
- 2013-07-18 Listing Removed — MRED as Distributed by MLS Grid
- 2011-06-02 Listing Removed — MRED as Distributed by MLS Grid
- 2008-02-15 Listing Removed — MRED as Distributed by MLS Grid
Property tax history
+6.5%/yrLatest (2023): $801 · +4.9% YoY. Source: county tax records.
Cash-flow waterfall
monthlySold comps — $/sqft
last 12 mo · ≤1 miLoading sold comps…