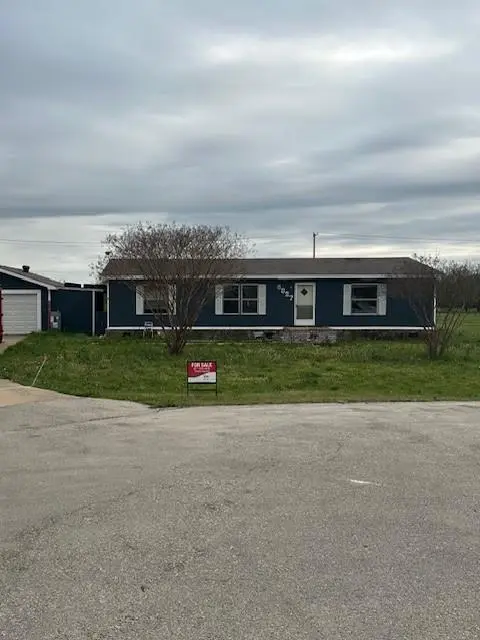
6827 Spring Branch Dr · Denton, TX
Flood risk 1/10 · Minimal
- FEMA flood zone
- X (unshaded)
- Chance of flooding over 30 yrs
- 0.0%
- Est. flood insurance / yr
- $507 – $1,088
Fire risk 6/10 · Moderate
- Est. fire insurance / yr
- $1,222 – $2,270
Heat risk 7/10 · Major
- Hot days now (above 109°F)
- 7 days/yr
- Hot days in 30 yrs
- 22 days/yr
Wind risk 6/10 · Moderate
- Chance of severe wind over 30 yrs
- 27.0%
Air-quality risk 4/10 · Minor
- Unhealthy air days now
- 4 days/yr
- Unhealthy air days in 30 yrs
- 5 days/yr
Risk factors via First Street. Map © Google.
Why this score? — see what drove the B+ grade
The composite is a weighted blend of 9 inputs, each scored 0–100. Each bar is that input's sub-score; the figure is the points it added to the 100-point composite (weight × sub-score).
- Cash flow +30.0/30.0
- ARV discount +15.0/15.0
- DSCR +10.0/10.0
- 1% rule +9.7/10.0
- Livability +4.4/5.0
- Schools +4.1/10.0
- Rent growth +2.5/5.0
- Condition / age +2.5/5.0
- Appreciation +0.0/10.0
$150,000
🖨 Deal sheet 📄 Offer letter ✓ Due diligence
Listing remarks
Double-wide manufactured home on 1 acre of land in Krum, TX with great potential. Property is in need of updates and is being sold as-is. Existing flooring has been removed, offering a blank canvas for the new owner to install their own finishes and design. Ideal for investors or buyers looking to customize a home to their taste. Spacious lot with room to expand or improve. Buyer to verify all information.
Key facts
- 1 acre lot
- 2 garage spots
- Built 1998
Neighborhood map
What this means for you Summary
Snapshot
- This is a 3-bed/2.0-bath manufactured listed at $150k.
Deal economics
- At list price, monthly cash flow is $797 ($10k/yr) — positive.
- The deal already cash-flows at list — no discount required.
- Meets the 1% rule at list price ($2k rent vs $150k).
- Cap rate 12.7% vs local median 3.4% in Denton — top-decile yield for the area; either an underpriced asset or a hidden risk that comps aren't pricing in. Stress-test before assuming the spread holds.
Location & tenants
- Location reads 88/100 on livability (#2 in TX, #210 nationally) — a professional / high-income tenant draw. Strengths: amenities A+, commute A+, housing A+.
- Krum ISD (rural): math 44% / reading 46% proficiency, ranked #218 of 826 in TX (top 26%) — families likely to look elsewhere, expect single-tenant / working-renter base with shorter leases.
- Zoned schools: Blanche Dodd El (math 45% / reading 47%, grade D-, #1,097 of 4,322 statewide, top 26%, 312 students, 43% FRL).
- Market conditions: 273 active listings in the ZIP; 2 comparable units currently listed for rent nearby; high-income renter base; 10,531 units permitted in Denton County in 2024 (2,713 in 5+ unit buildings).
Forward outlook
- Local home prices are declining (-3.0%/yr); year-one equity from $1k of loan paydown is wiped out by about $4k of value loss. Plan a longer hold.
- Denton County population projected at +66% by 2050 — long-run rental-demand tailwind backs the buy-and-hold thesis.
- At projected returns (-3.0% appreciation + 3.0% rent growth), your $42k cash investment doubles in ~6 years — after that, you're playing with house money.
Negotiation context
- Only 0 days on market — expect competitive offers; lowballing is unlikely to land.
- 2 sale attempts with the ask held roughly flat each time — persistent listings suggest the price (not the market) is what's stuck; bring a comps-based counter.
- Current owner paid $49k; list at $150k implies a 206% gain — meaningful room to come down on a strong offer.
Risks & watch-outs
- Climate carrying-cost: major wind risk, 27% chance of damaging wind over 30y; major wildfire risk; extreme-heat days projected 7→22/yr by 2055 (HVAC capex compounding) — expect insurance premiums to compound above CPI over the hold.
Questions for the listing agent
- Is there a deadline driving the sale (1031 exchange, divorce, estate, relocation)? That informs how much negotiation room exists.
- Schools are B-rated — typically a magnet for longer-tenancy family renters. What's the average tenant stay here, and is there a school-zone premium baked into asking?
- What's the average days-on-market for RENTAL listings here right now (not sales)? A rising rental-DOM trend means longer vacancies and softer asking-rent achievability than the comps imply.
- What's the recent tenant-quality profile in this submarket — average credit score on applications, eviction rate, late-payment / NSF rate, and stable-employment percentage? A property-management company in the area should have these aggregated.
- How much new for-sale + rental construction is in the pipeline within 1–3 miles? Heavy new supply typically softens prices + rents 12–24 months out; constrained supply supports both.
Investment metrics
- 1% rule
- 1.47% ✓
- Cap rate
- 12.67%
- Cash-on-cash
- 22.78%
- DSCR
- 2.01
- GRM
- 5.7
CMA / ARV
- ARV (median comp)
- $198,972
- List price
- $150,000
- Delta
- -12.05%
- Verdict
- UNDERPRICED
- Comps
- 3 within 1.0 mi
Show comp detail 1 sale within ~0.75 mi
| Address | Dist | Beds/Ba | Sqft | Sold | Price | $/sf | Match |
|---|---|---|---|---|---|---|---|
| 6827 Spring Branch Dr | 0.00mi | 3/2.0 | 1,344 (0%) | 0mo | $150,000 | $112 | 100 |
Match score weights: distance 35% · size 25% · config 20% · recency 20%. Top-matched comps best support the ARV.
Projected returns pro-forma
-3.0% appreciation · 3.0% rent growth · sell at horizon
- IRR
- 15.7%
- Equity multiple
- 1.63×
- Total profit
- $26,454
- Equity at exit
- $22,365
- IRR
- 24.3%
- Equity multiple
- 3.10×
- Total profit
- $88,342
- Equity at exit
- $12,969
Cash invested: $42,000 (down + closing). Projections, not guarantees.
Landlord ↔ Tenant lean methodology
- Overall (STATE)
- 87 Strongly Landlord-Friendly
- State Texas
- 87 Strongly Landlord-Friendly · R+5
- County
- — inherits STATE
- City
- — inherits STATE
ZIP-level market 76249
- Home prices YoY
- -11.1%
- Active inventory
- 273
- Price-to-rent
- 5.7×
Monthly cashflow live
- Estimated rent
- $2,211 medium interval (Pro) →
- Mortgage (P&I)
- −$787
- Tax from tax record
- −$100 /mo · $1,199/yr
- Insurance
- −$62
- HOA
- −$0
- Vacancy / Maint / Mgmt
- −$464
- Net cashflow
- $797
Break-even live
UW: 25.0% down · 7.5% · 30yr · 1.5% tax · 5.0% vac · 8.0% maint · 8.0% mgmt
Financing live
Cash to close
- Down payment
- $37,500
- Closing costs
- $4,500
- Reserves months
- —
- Total cash needed
- —
Loan-product check · same deal, 3 products live
Conventional
25% down · 7.5% · 30yr
- Down + closing
- —
- Monthly P&I
- —
- Monthly cashflow
- —
- DSCR
- —
- Eligible?
- —
Personal DTI + credit; lowest rate.
DSCR
20% down · 8.5% · 30yr
- Down + closing
- —
- Monthly P&I
- —
- Monthly cashflow
- —
- DSCR
- —
- Eligible?
- —
No personal income docs; deal must DSCR.
Hard money
10% down · 12.0% · 12mo
- Down + closing
- —
- Monthly P&I
- —
- Monthly cashflow
- —
- DSCR
- —
- Eligible?
- —
Short-term bridge; refi at stabilization.
Rent comps 2 comps
| Address | Beds | Baths | Sqft | Rent | $/sqft | DOM | Units | Dist |
|---|---|---|---|---|---|---|---|---|
| 1106 Spring Flower Dr Krum, TX | 3.0 | 2.0 | 1568 | $1,800 | $1.15 | 44d | 1 | 0.40mi |
| 5568 Corduroy Rd Krum, TX | 4.0 | 2.5 | 1568 | $2,100 | $1.34 | 5d | 1 | 1.46mi |
Listing history 8 events
-
2026-06-07pricestatusdays on market $150,000 Pending
-
2026-05-13historical Active Contingent 409-char remark
-
2026-05-13status Pending 409-char remark
-
2026-04-22price $175,000 409-char remark
-
2026-04-09price $199,000 409-char remark
-
2026-03-30$210,000 Active 409-char remark
-
2002-01-22soldstatus $49,000
-
1998-07-13soldstatus $120,000
ⓘ Source: listings_history table (triggers on properties + properties_extension) + one-shot
backfill from property_details.listing_events for pre-trigger history.
Tax reassessment forecast TX · Resets to sale price
- Current annual tax
- $1,199 · $100/mo
- Projected year-2 tax
- $2,745 · $229/mo
- Expected delta
- +$1,546/yr (+$129/mo · 128.9%)
ⓘ Screening estimate from a state-policy table — verify with the county assessor before closing.
Climate risk First Street
- Flood 1/10 Low FEMA zone X (unshaded) · 0% chance over 30 yrs
- Wildfire 6/10 Major
- Heat 7/10 Severe 7 d/yr ≥109°F today · 22 d/yr by 30 yrs out
- Wind 6/10 Major 27% chance of damaging wind over 30 yrs
- Air quality 4/10 Moderate 4 unhealthy d/yr today · 5 by 30 yrs out
Nearby sold comps map
Loading sold comps map…
Walkable amenities ~0.75 mi
Loading nearby amenities…
Taxation est. · year 1
- Rental income
- $26,527
- − Mortgage interest
- −$8,402
- − Property taxes
- −$1,199
- − Insurance
- −$750
- − Repairs & maintenance
- −$2,122
- − Management
- −$2,122
- − Depreciation
- −$4,364
- Taxable income
- $7,568
- Est. tax owed @ 24.0%
- −$1,816
- After-tax cash flow
- $7,752/yr
For passive investors: Depreciation is non-cash, so a rental often shows a tax loss while cash-flowing — sheltering income. Rental losses are passive: they offset passive income freely, and up to $25,000/yr can offset ordinary (W-2) income if you actively participate and your MAGI is under $100k (phasing out to $0 by $150k); unused losses carry forward. On sale, claimed depreciation is recaptured at up to 25%, and gains may owe capital-gains tax (a 1031 exchange can defer both). Figures are a year-1 estimate at your 24.0% rate — not tax advice; consult a CPA.
Schools (NCES district)
- District
- Krum ISD
- NCES district ID
- 4825980
- Math proficiency
- 44% ▼ -4.00%
- Reading proficiency
- 46% ▬ 0.00%
- Median HH income
- $71,808
- Composite
- 40.72/100
- National rank
- #3664
- State rank
- #218 of 826 in TX
Livability — Denton
- Score
- 88/100
- State rank
- #2
- US rank
- #210
Category grades
Schools grade is shown separately in the Schools card above.
Census & demographics
- County
- Denton County · 901,654 people
- City population
- 127,990
- Metro
- Dallas-Fort Worth-Arlington, TX
- Population (ZIP)
- 10,637
- Household income
- $120,169
- Rent vs Own
- Severe rent burden
- 134.0
Population outlook (Denton County) Hauer SSP2
- Today (2025)
- 1,053,010 people
- By 2030
- 1,192,269 · +13.2%
- By 2040
- 1,472,920 · +39.9%
- By 2050
- 1,746,506 · +65.9%
- By 2075
- 2,358,497 · +124.0%
- By 2100
- 2,779,183 · +163.9%
Race, ethnicity, and origin ACS 2023
- Neighborhood character
- Predominantly White (79%)
- Race & ethnicity
- White 79% Hispanic / Latino 15% Two or more races 8% Asian 1%
- Hispanic origin (detail)
- Mexican 8%
- Common ancestry
- Slovak 3% Lithuanian 2% Serbian 2%
- Foreign-born
- 8% · Canada
- Languages at home
- 86% English-only · Spanish 12% Arabic 1% Other Indo-European 1%
Political lean MEDSL · Denton
- 2024 margin
- R (+13.2) · D 42.7% · R 55.8% · Other 1.5%
- 2008→2024 swing
- +11.0pp toward D · 2008: -24.2pp · 2024: -13.2pp
- All cycles
- 2024: R+13.2 2020: R+8.1 2016: R+20.2 2012: R+31.7 2008: R+24.2
Not yet ingested
- Civics
- —
Market trends
- HPI YoY
- ▼ -34.45%
- Current HPI
- 276.067
- Rent YoY
- —
- Metro
- Dallas-Fort Worth-Arlington, TX
- State GDP YoY
- ▲ 3.95%
- F500 in state
- 110
Industry mix (Fortune 500 HQ in TX)
| Industry | F500 HQs | Revenue |
|---|---|---|
| Energy | 16 | $1,198B |
|
||
| Technology | 5 | $198B |
|
||
| Engineering / Construction | 4 | $72B |
|
||
| Energy Services | 3 | $60B |
|
||
| Utilities | 3 | $41B |
|
||
| Healthcare | 2 | $330B |
|
||
Price history
+25.0% since first listed12 events — show timeline
- 2026-06-05 Sold (Public Records) — Public Records
- 2026-06-05 Listed $150,000 NTREIS
- 2026-06-05 Listing Removed — NTREIS
- 2026-06-05 Sold (MLS) — NTREIS
- 2026-05-30 Listing Removed — NTREIS
- 2026-05-13 Contingent — NTREIS
- 2026-05-13 Pending — NTREIS
- 2026-04-22 Price Changed $175,000 NTREIS
- 2026-04-09 Price Changed $199,000 NTREIS
- 2026-03-30 Listed $210,000 NTREIS
- 2002-01-22 Sold (Public Records) $49,000 Public Records
- 1998-07-13 Sold (Public Records) $120,000 Public Records
Property tax history
-0.0%/yrLatest (2025): $1,199 · +7.2% YoY. Source: county tax records.
Cash-flow waterfall
monthlySold comps — $/sqft
last 12 mo · ≤1 miLoading sold comps…