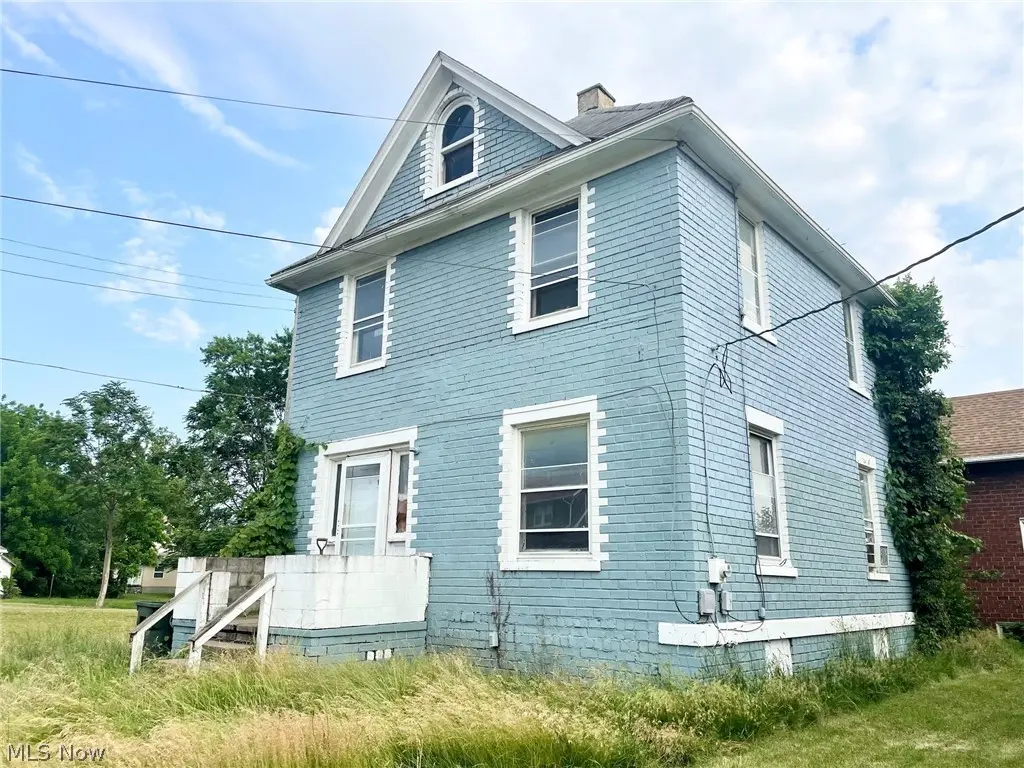
1720 5th St SE · Canton, OH
Flood risk 1/10 · Minimal
- FEMA flood zone
- X (unshaded)
- Chance of flooding over 30 yrs
- 0.0%
- Est. flood insurance / yr
- $473 – $860
Fire risk 1/10 · Minimal
- Est. fire insurance / yr
- $713 – $1,323
Heat risk 3/10 · Minor
- Hot days now (above 96°F)
- 7 days/yr
- Hot days in 30 yrs
- 17 days/yr
Wind risk 1/10 · Minimal
- Chance of severe wind over 30 yrs
- —
Air-quality risk 2/10 · Minimal
- Unhealthy air days now
- 0 days/yr
- Unhealthy air days in 30 yrs
- 1 days/yr
Risk factors via First Street. Map © Google.
Why this score? — see what drove the B- grade
The composite is a weighted blend of 9 inputs, each scored 0–100. Each bar is that input's sub-score; the figure is the points it added to the 100-point composite (weight × sub-score).
- Cash flow +30.0/30.0
- 1% rule +10.0/10.0
- DSCR +10.0/10.0
- ARV discount +7.5/15.0
- Livability +3.6/5.0
- Rent growth +2.5/5.0
- Condition / age +2.5/5.0
- Schools +1.7/10.0
- Appreciation +0.0/10.0
$49,900
🖨 Deal sheet 📄 Offer letter ✓ Due diligence
Listing remarks
Solid Brick 3–4-bedroom, 2 full bath colonial with attached garage. Looking for a good renovation project? Great prospect here, has good bones and plenty of old-world charm! Grand entry foyer, high profile woodwork, pocket doors between formal living room with fireplace and formal dining room, wood columns, hardwood floors and claw foot tub. Has 3 bedrooms upstairs along with a butler's kitchen, could be 4th bedroom, walk up to third floor attic. Attached garage and stairs to second floor. "Sold as is".
Key facts
- Pocket doors
- Attached garage
- Butler's kitchen
Tags
Property features AI
Finance
- HOA & community: Street lights; Sidewalks
Exterior
- Parking: Attached garage (1 car); Driveway and off-street parking; Garage faces side
- Utilities: Public water; Public sewer
- Home design: 3-story building; Faces north; Fixer condition
- Construction: Brick construction; Asphalt/fiberglass roof; Brick/mortar foundation; Built according to public records
- Exterior features: Rear porch; Front porch; Balcony
Interior
- Kitchen: Eat-in kitchen with laminate counters; Range
- Bedrooms: Bedroom on second level (10 x 10); Bedroom on second level (12 x 11)
- Flooring: Wood flooring in entry, dining room, and living room; Linoleum in first-level eat-in kitchen
- Bathrooms: Two full bathrooms; One main-level bathroom
- Heating & cooling: Forced-air gas heating
- Interior features: Built-in features; Entrance foyer; Eat-in kitchen; High ceilings; Soaking tub; Natural woodwork; Wood window frames
- Laundry & utility: Washer; Dryer; Laundry in basement
Neighborhood map
What this means for you Summary
Snapshot
- This is a 3-bed/2.0-bath single-family listed at $50k.
Deal economics
- At list price, monthly cash flow is $549 ($7k/yr) — positive.
- The deal already cash-flows at list — no discount required.
- Meets the 1% rule at list price ($1k rent vs $50k).
- Cap rate 19.5% vs local median 5.1% in Canton — top-decile yield for the area; either an underpriced asset or a hidden risk that comps aren't pricing in. Stress-test before assuming the spread holds.
Location & tenants
- Location reads 71/100 on livability (#441 in OH) — a middle-class / working-renter tenant base. Strengths: commute A+, cost of living A+, housing A; Watch: crime F, employment F.
- Canton City (urban): math 17% / reading 26% proficiency, ranked #627 of 656 in OH (top 96%) — low school quality limits family demand, transient renter base, plan for 1-2y turnover; 76% free/reduced lunch — lower-income household profile, screen leases tightly.
- Market conditions: 16 active listings in the ZIP; 13 comparable units currently listed for rent nearby; rentals leasing fast (median 14d on market — plan ~1-2 weeks tenant-placement turnaround); lower-income renter base — watch delinquency; 528 units permitted in Stark County in 2024 (84 in 5+ unit buildings).
- This rent runs 33% of the median local income ($39k/yr) — at the standard rent-burdened threshold; future hikes will face affordability resistance.
Forward outlook
- Local home prices are declining (-3.0%/yr); year-one equity from $345 of loan paydown is wiped out by about $1k of value loss. Plan a longer hold.
- Stark County population projected to shrink 8% by 2050 — rents likely to lag national; underwrite the cash flow, not the appreciation.
- At projected returns (-3.0% appreciation + 3.0% rent growth), your $14k cash investment doubles in ~3 years — after that, you're playing with house money.
Negotiation context
- Only 8 days on market — expect competitive offers; lowballing is unlikely to land.
- Current owner paid $10k; list at $50k implies a 399% gain — meaningful room to come down on a strong offer.
Risks & watch-outs
- Watch-outs: built in 1908 — expect roof / HVAC / electrical / plumbing capex.
Questions for the listing agent
- Built in 1908 — when were the roof, HVAC, electrical panel, plumbing, and water heater last replaced?
- Is there a deadline driving the sale (1031 exchange, divorce, estate, relocation)? That informs how much negotiation room exists.
- Crime grade is F in this area — have there been break-ins, vandalism, or insurance claims at this property in the last 3 years? What carrier currently insures it and at what premium?
- What's the average days-on-market for RENTAL listings here right now (not sales)? A rising rental-DOM trend means longer vacancies and softer asking-rent achievability than the comps imply.
- What's the recent tenant-quality profile in this submarket — average credit score on applications, eviction rate, late-payment / NSF rate, and stable-employment percentage? A property-management company in the area should have these aggregated.
- How much new for-sale + rental construction is in the pipeline within 1–3 miles? Heavy new supply typically softens prices + rents 12–24 months out; constrained supply supports both.
Investment metrics
- 1% rule
- 2.18% ✓
- Cap rate
- 19.50%
- Cash-on-cash
- 47.18%
- DSCR
- 3.10
- GRM
- 3.8
CMA / ARV
- ARV (on-the-fly)
- $104,832
- Comps found
- 12
Show comp detail 12 sales within ~0.75 mi
| Address | Dist | Beds/Ba | Sqft | Sold | Price | $/sf | Match |
|---|---|---|---|---|---|---|---|
| 1935 5th St SE | 0.21mi | 3/2.0 | 1,442 (-1%) | 13mo | $52,777 | $37 | 78 |
| 213 Hartford Ave SE | 0.21mi | 4/1.5 (+1) | 1,462 (+0%) | 9mo | $145,000 | $99 | 75 |
| 2001 3rd St SE | 0.32mi | 3/1.0 | 1,456 (0%) | 13mo | $126,000 | $87 | 70 |
| 507 Girard Ave SE | 0.57mi | 3/2.0 | 1,466 (+1%) | 6mo | $45,000 | $31 | 68 |
| 1817 3rd St NE | 0.37mi | 3/1.0 | 1,555 (+7%) | 6mo | $25,000 | $16 | 63 |
| 1942 4th St SE | 0.23mi | 4/1.0 (+1) | 1,536 (+6%) | 13mo | $40,000 | $26 | 61 |
| 515 Flamos Cir NE | 0.51mi | 3/1.5 | 1,300 (-11%) | 2mo | $119,000 | $92 | 54 |
| 1512 14th St SE | 0.44mi | 3/1.0 | 1,312 (-10%) | 11mo | $95,000 | $72 | 50 |
| 1817 Penn Pl NE | 0.66mi | 3/1.0 | 1,389 (-5%) | 10mo | $59,900 | $43 | 49 |
| 2306 3rd St NE | 0.68mi | 3/2.0 | 1,319 (-9%) | 11mo | $129,900 | $98 | 43 |
| 202 Young Ave NE | 0.42mi | 4/1.5 (+1) | 1,664 (+14%) | 18mo | $60,000 | $36 | 35 |
| 1116 4th St NE | 0.60mi | 4/1.0 (+1) | 1,256 (-14%) | 16mo | $112,000 | $89 | 27 |
Match score weights: distance 35% · size 25% · config 20% · recency 20%. Top-matched comps best support the ARV.
Projected returns pro-forma
-3.0% appreciation · 3.0% rent growth · sell at horizon
- IRR
- 44.5%
- Equity multiple
- 2.92×
- Total profit
- $26,896
- Equity at exit
- $7,440
- IRR
- 50.5%
- Equity multiple
- 5.90×
- Total profit
- $68,450
- Equity at exit
- $4,314
Cash invested: $13,972 (down + closing). Projections, not guarantees.
Landlord ↔ Tenant lean methodology
- Overall (STATE)
- 73 Landlord-Friendly
- State Ohio
- 73 Landlord-Friendly · R+6
- County
- — inherits STATE
- City
- — inherits STATE
ZIP-level market 44707
- Home prices YoY
- -26.0%
- Active inventory
- 16
- Price-to-rent
- 3.8×
Monthly cashflow live
- Estimated rent
- $1,087 high interval (Pro) →
- Mortgage (P&I)
- −$262
- Tax from tax record
- −$27 /mo · $324/yr
- Insurance
- −$21
- HOA
- −$0
- Vacancy / Maint / Mgmt
- −$228
- Net cashflow
- $549
Break-even live
UW: 25.0% down · 7.5% · 30yr · 1.5% tax · 5.0% vac · 8.0% maint · 8.0% mgmt
Financing live
Cash to close
- Down payment
- $12,475
- Closing costs
- $1,497
- Reserves months
- —
- Total cash needed
- —
Loan-product check · same deal, 3 products live
Conventional
25% down · 7.5% · 30yr
- Down + closing
- —
- Monthly P&I
- —
- Monthly cashflow
- —
- DSCR
- —
- Eligible?
- —
Personal DTI + credit; lowest rate.
DSCR
20% down · 8.5% · 30yr
- Down + closing
- —
- Monthly P&I
- —
- Monthly cashflow
- —
- DSCR
- —
- Eligible?
- —
No personal income docs; deal must DSCR.
Hard money
10% down · 12.0% · 12mo
- Down + closing
- —
- Monthly P&I
- —
- Monthly cashflow
- —
- DSCR
- —
- Eligible?
- —
Short-term bridge; refi at stabilization.
Rent comps 13 comps
| Address | Beds | Baths | Sqft | Rent | $/sqft | DOM | Units | Dist |
|---|---|---|---|---|---|---|---|---|
| 1511 2nd St NE Canton, OH | 3.0 | 1.0 | 1129 | $1,250 | $1.11 | 43d | 1 | 0.38mi |
| 1504 14th St SE Canton, OH | 3.0 | 1.0 | 924 | $1,120 | $1.21 | 13d | 1 | 0.42mi |
| 2048 2nd St NE Unit 2048 Canton, OH | 2.0 | 1.0 | 1092 | $950 | $0.87 | 13d | 1 | 0.49mi |
| 316 Young Ave NE Canton, OH | 4.0 | 1.0 | 1268 | $1,050 | $0.83 | 13d | 1 | 0.50mi |
| 1946 Otto Pl NE Canton, OH | 3.0 | 1.0 | 1499 | $28,000 | $18.68 | 13d | 1 | 0.51mi |
| 1906 6th St NE Unit 1906-002 Canton, OH | 3.0 | 1.0 | 906 | $1,000 | $1.10 | 13d | 1 | 0.60mi |
| 1000 Market Ave S Canton, OH | 1.0–2.0 | 1.0–2.0 | 1500 | $4,505 | $3.00 | 13d | 12 | 0.96mi |
| 1304 Cole Ave SE Canton, OH | 2.0 | 1.0 | 984 | $650 | $0.66 | 13d | 1 | 1.03mi |
| 924 Spring Ave NE Canton, OH | 4.0 | 1.5 | 1407 | $1,395 | $0.99 | 21d | 1 | 1.06mi |
| 1206 Lawrence Rd NE Apt 3 Canton, OH | 2.0 | 1.0 | 900 | $950 | $1.06 | 21d | 1 | 1.11mi |
| 1100 5th St SW Canton, OH | 4.0 | 1.0 | 1397 | $1,200 | $0.86 | 43d | 1 | 1.47mi |
| 1220 Market Ave N Unit 4 Canton, OH | 3.0 | 1.0 | 1400 | $1,100 | $0.79 | 43d | 1 | 1.48mi |
| 1016 2nd St NW Canton, OH | 1.0–3.0 | 1.0–2.0 | 916 | $1,050 | $1.15 | 13d | 20 | 1.49mi |
Listing history 7 events
-
2026-06-18days on market $49,900 Active 8 DOM
-
2026-06-17days on market $49,900 Active 7 DOM
-
2026-06-16days on market $49,900 Active 6 DOM
-
2026-06-15days on market $49,900 Active 5 DOM
-
2026-06-14days on market $49,900 Active 3 DOM
-
2026-06-13remarks 508-char remark
-
2026-06-13$49,900 Active 2 DOM
ⓘ Source: listings_history table (triggers on properties + properties_extension) + one-shot
backfill from property_details.listing_events for pre-trigger history.
Tax reassessment forecast OH · Partial reset (capped growth)
- Current annual tax
- $324 · $27/mo
- Projected year-2 tax
- $551 · $46/mo
- Expected delta
- +$227/yr (+$19/mo · 70.2%)
ⓘ Screening estimate from a state-policy table — verify with the county assessor before closing.
Climate risk First Street
- Flood 1/10 Low FEMA zone X (unshaded) · 0% chance over 30 yrs
- Wildfire 1/10 Low
- Heat 3/10 Moderate 7 d/yr ≥96°F today · 17 d/yr by 30 yrs out
- Wind 1/10 Low
- Air quality 2/10 Low 0 unhealthy d/yr today · 1 by 30 yrs out
Nearby sold comps map
Loading sold comps map…
Walkable amenities ~0.75 mi
Loading nearby amenities…
Taxation est. · year 1
- Rental income
- $13,045
- − Mortgage interest
- −$2,795
- − Property taxes
- −$324
- − Insurance
- −$250
- − Repairs & maintenance
- −$1,044
- − Management
- −$1,044
- − Depreciation
- −$1,452
- Taxable income
- $6,138
- Est. tax owed @ 24.0%
- −$1,473
- After-tax cash flow
- $5,119/yr
For passive investors: Depreciation is non-cash, so a rental often shows a tax loss while cash-flowing — sheltering income. Rental losses are passive: they offset passive income freely, and up to $25,000/yr can offset ordinary (W-2) income if you actively participate and your MAGI is under $100k (phasing out to $0 by $150k); unused losses carry forward. On sale, claimed depreciation is recaptured at up to 25%, and gains may owe capital-gains tax (a 1031 exchange can defer both). Figures are a year-1 estimate at your 24.0% rate — not tax advice; consult a CPA.
Schools (NCES district)
- District
- Canton City
- NCES district ID
- 3904371
- Math proficiency
- 17% ▼ -17.00%
- Reading proficiency
- 26% ▼ -12.00%
- Median HH income
- $28,825
- Composite
- 17.1/100
- National rank
- #9116
- State rank
- #627 of 656 in OH
Livability — Canton
- Score
- 71/100
- State rank
- #441
- US rank
- #7259
Category grades
Schools grade is shown separately in the Schools card above.
Census & demographics
- Census place
- Canton, OH
- County
- Stark · 366,688 people
- City population
- 103,614
- Metro
- Canton-Massillon, OH
- Population (ZIP)
- 8,849
- Household income
- $38,983
- Rent vs Own
- Severe rent burden
- 4.0
Population outlook (Stark County) Hauer SSP2
- Today (2025)
- 373,708 people
- By 2030
- 371,245 · -0.7%
- By 2040
- 361,331 · -3.3%
- By 2050
- 345,290 · -7.6%
- By 2075
- 302,669 · -19.0%
- By 2100
- 238,870 · -36.1%
Race, ethnicity, and origin ACS 2023
- Neighborhood character
- Diverse neighborhood (Simpson 0.56)
- Race & ethnicity
- White 60% Black 27% Two or more races 11% Hispanic / Latino 3%
- Common ancestry
- Italian 6% Iranian 4% Serbian 1%
- Foreign-born
- 0%
- Languages at home
- 99% English-only · Spanish 1%
Political lean MEDSL · Stark
- 2024 margin
- Strong R (+21.9) · D 38.6% · R 60.5%
- 2008→2024 swing
- -27.4pp toward R · 2008: 5.5pp · 2024: -21.9pp
- All cycles
- 2024: R+21.9 2020: R+18.5 2016: R+17.4 2012: R+0.4 2008: D+5.5
Not yet ingested
- Civics
- —
Market trends
- HPI YoY
- ▼ -74.96%
- Current HPI
- 212.9455
- Rent YoY
- —
- Metro
- —
- State GDP YoY
- ▲ 1.98%
- F500 in state
- 48
Industry mix (Fortune 500 HQ in OH)
| Industry | F500 HQs | Revenue |
|---|---|---|
| Insurance | 3 | $145B |
|
||
| Industrial Machinery | 3 | $49B |
|
||
| Financial Services | 3 | $24B |
|
||
| Consumer Goods | 2 | $93B |
|
||
| Aerospace / Defense | 2 | $47B |
|
||
| Utilities | 2 | $33B |
|
||
Price history
+399.0% since first listed2 events — show timeline
- 2026-06-11 Listed $49,900 MLSNOW
- 1995-11-28 Sold (Public Records) $10,000 Public Records
Property tax history
-15.5%/yrLatest (2024): $324 · -34.8% YoY. Source: county tax records.
Cash-flow waterfall
monthlySold comps — $/sqft
last 12 mo · ≤1 miLoading sold comps…