548 Shew Hollow Rd · Jefferson, NY
Flood risk 1/10 · Minimal
- FEMA flood zone
- X (unshaded)
- Chance of flooding over 30 yrs
- 0.0%
- Est. flood insurance / yr
- $473 – $860
Fire risk 1/10 · Minimal
- Est. fire insurance / yr
- $691 – $1,283
Heat risk 1/10 · Minimal
- Hot days now (above 90°F)
- 7 days/yr
- Hot days in 30 yrs
- 17 days/yr
Wind risk 2/10 · Minimal
- Chance of severe wind over 30 yrs
- 2.0%
Air-quality risk 1/10 · Minimal
- Unhealthy air days now
- 0 days/yr
- Unhealthy air days in 30 yrs
- 0 days/yr
Risk factors via First Street. Map © Google.
Why this score? — see what drove the B+ grade
The composite is a weighted blend of 9 inputs, each scored 0–100. Each bar is that input's sub-score; the figure is the points it added to the 100-point composite (weight × sub-score).
- Cash flow +30.0/30.0
- DSCR +10.0/10.0
- 1% rule +9.6/10.0
- Appreciation +7.6/10.0
- ARV discount +7.5/15.0
- Schools +2.9/10.0
- Rent growth +2.5/5.0
- Livability +2.5/5.0
- Condition / age +2.5/5.0
$199,000
🖨 Deal sheet (PDF) 📄 Offer letter ✓ Due diligence
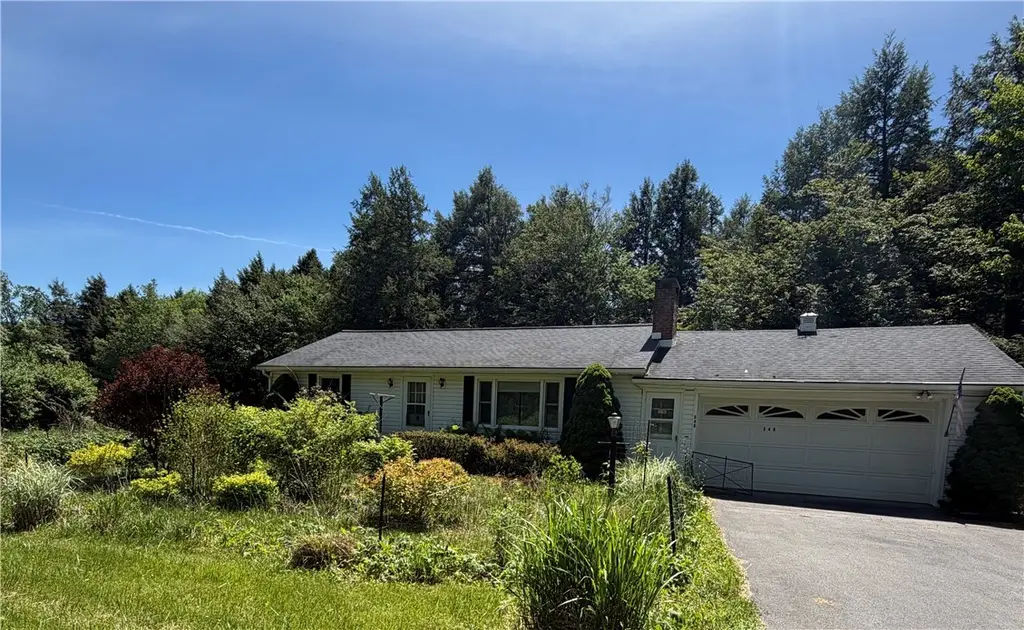
Listing remarks
Welcome to this delightful 1.5-acre retreat featuring scenic mountain views and a private pond. Surrounded by mature gardens, the home boasts a large screened-in porch for seamless, bug-free outdoor living. The main floor offers a comfortable kitchen, a living room centered around a cozy fireplace, two bedrooms, and a full bath. Additional living space awaits in the partially finished basement, which includes a third bedroom, a flexible bonus room with a door leading outside to the yard, gardens and pond. The basement includes a freshly updated bathroom with a brand-new stall shower. Complete with an attached two-car garage offering abundant storage.
Key facts
- Mature gardens
- Screened in porch
- Loads of storage
Tags
Property features AI
Exterior
- Parking: Attached garage; Two garage spaces
- Utilities: Well water; Septic tank
- Home design: Single-story home; Existing construction; Resale property
- Construction: Frame construction; Shingle roof; Poured foundation; Built previously (existing)
- Exterior features: Blacktop driveway; Rectangular residential lot; City street frontage
Interior
- Kitchen: Electric oven; Electric range; Refrigerator
- Bedrooms: Two main-level bedrooms
- Flooring: Carpet; Tile; Vinyl; Varies
- Bathrooms: Two full bathrooms; One main-level bathroom
- Heating & cooling: Oil heating; Baseboard heating; Has heating
- Interior features: Eat-in kitchen; Separate/formal living room; Bedroom on main level; Full, partially finished basement; One fireplace
- Laundry & utility: Washer; Dryer (in basement); Electric water heater
Neighborhood map
What this means for you Summary
Snapshot
- This is a 2-bed/1.5-bath single-family listed at $199k.
Deal economics
- At list price, monthly cash flow is $1k ($12k/yr) — positive.
- The deal already cash-flows at list — no discount required.
- Meets the 1% rule at list price ($3k rent vs $199k).
Location & tenants
- Location reads: area grade B — affects rentability + tenant quality, not the cash-flow math above.
- Jefferson Central School District (rural): math 30% / reading 30% proficiency, ranked #723 of 755 in NY (top 96%) — families likely to look elsewhere, expect single-tenant / working-renter base with shorter leases.
- Market conditions: 37 active listings in the ZIP; 35 units permitted in Schoharie County in 2024 (0 in 5+ unit buildings).
Forward outlook
- In year one you build about $12k of equity ($1k loan paydown + $10k appreciation (5.2% local appreciation)).
- Schoharie County population projected at -30% by 2050 — secular population decline; favor cash flow + early exit over multi-decade hold.
- At projected returns (5.2% appreciation + 3.0% rent growth), your $56k cash investment doubles in ~3 years — after that, you're playing with house money.
- By year 4, paydown + projected appreciation supports a ~$40k cash-out refi (75% LTV) — recoverable capital for the next deal without selling this one.
Negotiation context
- Only 11 days on market — expect competitive offers; lowballing is unlikely to land.
- Current owner paid $95k; list at $199k implies a 109% gain — meaningful room to come down on a strong offer.
Questions for the listing agent
- Built in 1972 — when were the roof, HVAC, electrical panel, plumbing, and water heater last replaced?
- Is there a deadline driving the sale (1031 exchange, divorce, estate, relocation)? That informs how much negotiation room exists.
- What's the average days-on-market for RENTAL listings here right now (not sales)? A rising rental-DOM trend means longer vacancies and softer asking-rent achievability than the comps imply.
- What's the recent tenant-quality profile in this submarket — average credit score on applications, eviction rate, late-payment / NSF rate, and stable-employment percentage? A property-management company in the area should have these aggregated.
- How much new for-sale + rental construction is in the pipeline within 1–3 miles? Heavy new supply typically softens prices + rents 12–24 months out; constrained supply supports both.
Investment metrics
- 1% rule
- 1.46% ✓
- Cap rate
- 12.40%
- Cash-on-cash
- 21.81%
- DSCR
- 1.97
- GRM
- 5.7
CMA / ARV
No comps found within radius.
Projected returns pro-forma
5.21% appreciation · 3.0% rent growth · sell at horizon
- IRR
- 32.2%
- Equity multiple
- 3.02×
- Total profit
- $112,708
- Equity at exit
- $115,282
- IRR
- 30.6%
- Equity multiple
- 6.10×
- Total profit
- $283,902
- Equity at exit
- $201,068
Cash invested: $55,720 (down + closing). Projections, not guarantees.
Landlord ↔ Tenant lean methodology
- Overall (STATE)
- 15 Strongly Tenant-Friendly
- State New York
- 15 Strongly Tenant-Friendly · D+10
- County
- — inherits STATE
- City
- — inherits STATE
ZIP-level market 12167
- Home prices YoY
- 1.4%
- Active inventory
- 37
- Price-to-rent
- 5.7×
Monthly cashflow live
- Estimated rent
- $2,912 medium interval (Pro) →
- Mortgage (P&I)
- −$1,044
- Tax from tax record
- −$161 /mo · $1,936/yr
- Insurance
- −$83
- HOA
- −$0
- Vacancy / Maint / Mgmt
- −$611
- Net cashflow
- $1,013
Break-even live
Sensitivity live
| Price | -10% $1,125 | -5% $1,069 | +0% $1,013 | +5% $956 | +10% $900 |
|---|---|---|---|---|---|
| Rent | -10% $783 | -5% $898 | +0% $1,013 | +5% $1,128 | +10% $1,243 |
| Rate | -1.0pp $1,113 | -0.5pp $1,063 | base $1,013 | +0.5pp $961 | +1.0pp $909 |
UW: 25.0% down · 7.5% · 30yr · 1.5% tax · 5.0% vac · 8.0% maint · 8.0% mgmt
Financing live
Cash to close
- Down payment
- $49,750
- Closing costs
- $5,970
- Reserves months
- —
- Total cash needed
- —
Loan-product check · same deal, 3 products live
Conventional
25% down · 7.5% · 30yr
- Down + closing
- —
- Monthly P&I
- —
- Monthly cashflow
- —
- DSCR
- —
- Eligible?
- —
Personal DTI + credit; lowest rate.
DSCR
20% down · 8.5% · 30yr
- Down + closing
- —
- Monthly P&I
- —
- Monthly cashflow
- —
- DSCR
- —
- Eligible?
- —
No personal income docs; deal must DSCR.
Hard money
10% down · 12.0% · 12mo
- Down + closing
- —
- Monthly P&I
- —
- Monthly cashflow
- —
- DSCR
- —
- Eligible?
- —
Short-term bridge; refi at stabilization.
Listing history 10 events
-
2026-06-22days on market $199,000 Active 11 DOM
-
2026-06-21days on market $199,000 Active 10 DOM
-
2026-06-21days on market $199,000 Active 9 DOM
-
2026-06-18days on market $199,000 Active 7 DOM
-
2026-06-17days on market $199,000 Active 6 DOM
-
2026-06-16days on market $199,000 Active 5 DOM
-
2026-06-15days on market $199,000 Active 4 DOM
-
2026-06-13days on market $199,000 Active 2 DOM
-
2026-06-12remarks 658-char remark
-
2026-06-12$199,000 Active 1 DOM
ⓘ Source: listings_history table (triggers on properties + properties_extension) + one-shot
backfill from property_details.listing_events for pre-trigger history.
Tax reassessment forecast NY · Partial reset (capped growth)
- Current annual tax
- $1,936 · $161/mo
- Projected year-2 tax
- $2,650 · $221/mo
- Expected delta
- +$714/yr (+$59/mo · 36.9%)
ⓘ Screening estimate from a state-policy table — verify with the county assessor before closing.
Climate risk First Street
- Flood 1/10 Low FEMA zone X (unshaded) · 0% chance over 30 yrs
- Wildfire 1/10 Low
- Heat 1/10 Low 7 d/yr ≥90°F today · 17 d/yr by 30 yrs out
- Wind 2/10 Low 2% chance of damaging wind over 30 yrs
- Air quality 1/10 Low 0 unhealthy d/yr today · 0 by 30 yrs out
Nearby sold comps map
Loading sold comps map…
Walkable amenities ~0.75 mi
Loading nearby amenities…
Taxation est. · year 1
- Rental income
- $34,943
- − Mortgage interest
- −$11,147
- − Property taxes
- −$1,936
- − Insurance
- −$995
- − Repairs & maintenance
- −$2,795
- − Management
- −$2,795
- − Depreciation
- −$5,789
- Taxable income
- $9,485
- Est. tax owed @ 24.0%
- −$2,276
- After-tax cash flow
- $9,874/yr
For passive investors: Depreciation is non-cash, so a rental often shows a tax loss while cash-flowing — sheltering income. Rental losses are passive: they offset passive income freely, and up to $25,000/yr can offset ordinary (W-2) income if you actively participate and your MAGI is under $100k (phasing out to $0 by $150k); unused losses carry forward. On sale, claimed depreciation is recaptured at up to 25%, and gains may owe capital-gains tax (a 1031 exchange can defer both). Figures are a year-1 estimate at your 24.0% rate — not tax advice; consult a CPA.
Schools (NCES district)
- District
- Jefferson Central School District
- NCES district ID
- 3615720
- Math proficiency
- 30% ▬ 0.00%
- Reading proficiency
- 30% ▬ 0.00%
- Median HH income
- $50,778
- Composite
- 29.11/100
- National rank
- #11892
- State rank
- #723 of 755 in NY
Livability — Jefferson
No livability data for this city. (Only ~50 U.S. cities are tracked.)
Census & demographics
- Population (ZIP)
- 2,257
Population outlook (Schoharie County) Hauer SSP2
- Today (2025)
- 29,080 people
- By 2030
- 27,417 · -5.7%
- By 2040
- 23,835 · -18.0%
- By 2050
- 20,482 · -29.6%
- By 2075
- 14,323 · -50.7%
- By 2100
- 9,636 · -66.9%
Race, ethnicity, and origin ACS 2023
- Neighborhood character
- Predominantly White (94%)
- Race & ethnicity
- White 94% Two or more races 4% Hispanic / Latino 2%
- Common ancestry
- Romanian 8% Iranian 3% Lithuanian 2%
- Foreign-born
- 3% · Canada, China
- Languages at home
- 94% English-only · Other Indo-European 3% Spanish 1% Russian/Polish/Slavic 1%
Political lean MEDSL · Schoharie
- 2024 margin
- Solid R (+30.5) · D 34.7% · R 65.3%
- 2008→2024 swing
- -16.2pp toward R · 2008: -14.3pp · 2024: -30.5pp
- All cycles
- 2024: R+30.5 2020: R+29.0 2016: R+34.7 2012: R+16.6 2008: R+14.3
Not yet ingested
- Civics
- —
Market trends
- HPI YoY
- ▲ 5.21%
- Current HPI
- 368.4492
- Rent YoY
- —
- Metro
- —
- State GDP YoY
- ▲ 2.60%
- F500 in state
- 92
Industry mix (Fortune 500 HQ in NY)
| Industry | F500 HQs | Revenue |
|---|---|---|
| Financial Services | 10 | $950B |
|
||
| Consumer Goods | 9 | $162B |
|
||
| Insurance | 4 | $225B |
|
||
| Telecommunications | 2 | $144B |
|
||
| Pharmaceuticals | 2 | $112B |
|
||
| Media / Entertainment | 2 | $69B |
|
||
Price history
+109.5% since first listed2 events — show timeline
- 2026-06-11 Listed $199,000 UNYREIS
- 2018-11-28 Sold (Public Records) $95,000 Public Records
Property tax history
+2.3%/yrLatest (2025): $1,936 · +10.1% YoY. Source: county tax records.
Cash-flow waterfall
monthlySold comps — $/sqft
last 12 mo · ≤1 miLoading sold comps…