 Duplex
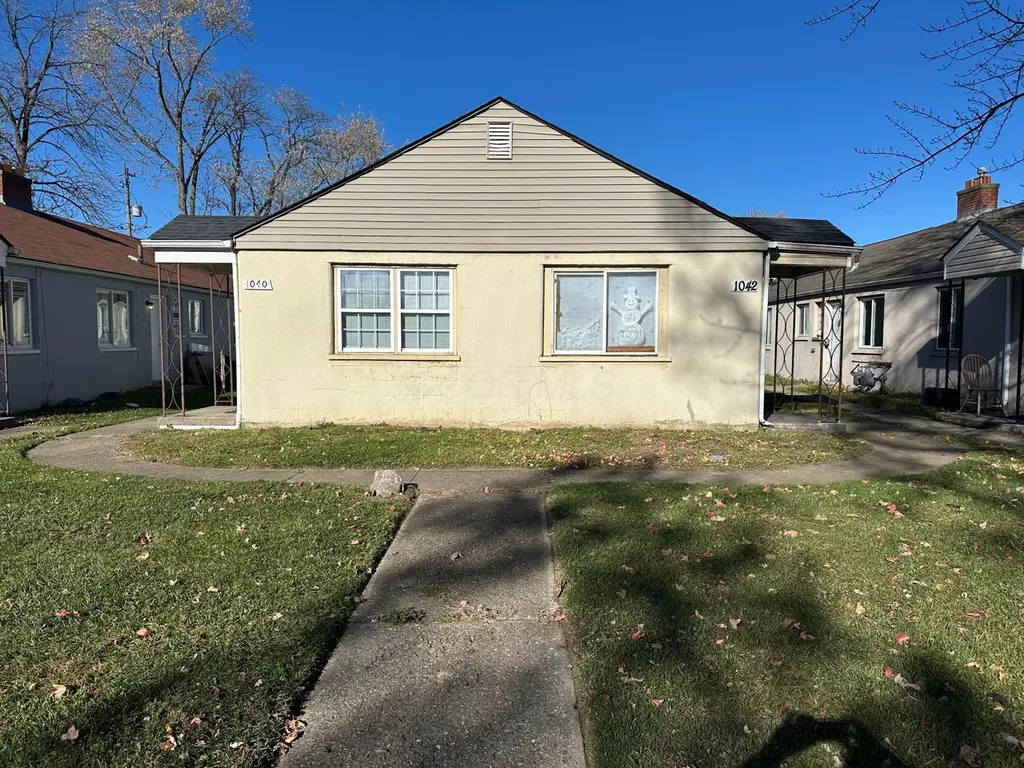
1040-1042 Loretta Ave · Columbus, OH
Flood risk 1/10 · Minimal
- FEMA flood zone
- X (unshaded)
- Chance of flooding over 30 yrs
- 0.0%
- Est. flood insurance / yr
- $507 – $1,088
Fire risk 1/10 · Minimal
- Est. fire insurance / yr
- $713 – $1,323
Heat risk 3/10 · Minor
- Hot days now (above 100°F)
- 7 days/yr
- Hot days in 30 yrs
- 17 days/yr
Wind risk 2/10 · Minimal
- Chance of severe wind over 30 yrs
- 1.0%
Air-quality risk 3/10 · Minor
- Unhealthy air days now
- 2 days/yr
- Unhealthy air days in 30 yrs
- 4 days/yr
Risk factors via First Street. Map © Google.
Why this score? — see what drove the B- grade
The composite is a weighted blend of 9 inputs, each scored 0–100. Each bar is that input's sub-score; the figure is the points it added to the 100-point composite (weight × sub-score).
- Cash flow +27.9/30.0
- ARV discount +10.2/15.0
- DSCR +9.9/10.0
- 1% rule +7.2/10.0
- Livability +4.0/5.0
- Rent growth +3.4/5.0
- Condition / age +2.5/5.0
- Schools +1.7/10.0
- Appreciation +0.0/10.0
$169,997
🖨 Deal sheet (PDF) 📄 Offer letter ✓ Due diligence
Multi-family units
County records classify this as Multi-Family (2-4 Unit). Listing-text estimate: 2 units. confirmed
Listing remarks MLS
CONCRETE BLOCK CONSTRUCTION. ONE OF FIVE AVAILABLE SIDE BY SIDE.
Key facts
- Minimal vacancy
- Strong rental income
- 4,791 sq ft lot
Tags
Property features AI
Finance
- Financial info: Annual tax (2024): $1,792
Exterior
- Parking: 2 parking spaces
- Utilities: Public water; Public sewer; Natural gas available; Electricity available; Storm sewer
- Home design: Duplex; Built in 1950
- Exterior features: Lot in Linden subdivision; Cross street: Hudson
Interior
- Bedrooms: Duplex with 2 total units
- Heating & cooling: Forced Air heating
- Interior features: Forced Air heating
Neighborhood map
What this means for you Summary
Snapshot
- This is a 2 × 2-bed/?-bath units multifamily listed at $170k.
Deal economics
- At list price, monthly cash flow is $524 ($6k/yr) — positive. Per door: $262/mo.
- The deal already cash-flows at list — no discount required.
- Meets the 1% rule at list price ($2k rent vs $170k).
- Recommended offer: $165k (3.0% below list) — sets the bar for market timing.
- Cap rate 10.0% vs local median 3.8% in Columbus — top-decile yield for the area; either an underpriced asset or a hidden risk that comps aren't pricing in. Stress-test before assuming the spread holds.
Location & tenants
- Location reads 81/100 on livability (#97 in OH, #1,491 nationally) — a professional / high-income tenant draw. Strengths: commute A+, cost of living A+, housing A+; Watch: employment C-, crime F.
- Columbus City School District (urban): math 15% / reading 26% proficiency, ranked #626 of 656 in OH (top 95%) — low school quality limits family demand, transient renter base, plan for 1-2y turnover; 72% free/reduced lunch — lower-income household profile, screen leases tightly.
- Market conditions: Rents rising (+3.4%/yr); 166 active listings in the ZIP; 40 comparable units currently listed for rent nearby; rentals at typical pace (median 25d on market — plan ~3-4 weeks tenant-placement turnaround); lower-income renter base — watch delinquency; 8,139 units permitted in Franklin County in 2024 (5,940 in 5+ unit buildings).
- At $2,070/mo this rent would consume 58% of the median local household income ($43k/yr) (locally 1282% of renters already pay >50% of income on rent) — very limited rent-growth headroom before tenants either downsize or default.
Forward outlook
- Local home prices are declining (-3.0%/yr); year-one equity from $1k of loan paydown is wiped out by about $5k of value loss. Plan a longer hold.
- Franklin County population projected at +34% by 2050 — long-run rental-demand tailwind backs the buy-and-hold thesis.
- At projected returns (-3.0% appreciation + 3.4% rent growth), your $48k cash investment doubles in ~9 years — after that, you're playing with house money.
Negotiation context
- It's been on market 37 days — a 3% lower offer ($165k) is reasonable based on typical stale-listing flexibility.
- 4 sale attempts since 28y ago with the ask held roughly flat each time — persistent listings suggest the price (not the market) is what's stuck; bring a comps-based counter.
Risks & watch-outs
- Watch-outs: built in 1950 — expect roof / HVAC / electrical / plumbing capex.
Questions for the listing agent
- It's been on market 37 days. Have you received any prior offers? Is the seller open to a 3% concession, seller financing, or rate buy-down credit?
- Can we see the unit-by-unit rent roll, current vacancy, and any below-market leases? What's the average tenancy length?
- What capital expenditures (roof, boiler, parking lot, exteriors) have been made in the last 5 years, and what's planned in the next 2?
- Built in 1950 — when were the roof, HVAC, electrical panel, plumbing, and water heater last replaced?
- Is there a deadline driving the sale (1031 exchange, divorce, estate, relocation)? That informs how much negotiation room exists.
- Crime grade is F in this area — have there been break-ins, vandalism, or insurance claims at this property in the last 3 years? What carrier currently insures it and at what premium?
- What's the average days-on-market for RENTAL listings here right now (not sales)? A rising rental-DOM trend means longer vacancies and softer asking-rent achievability than the comps imply.
- What's the recent tenant-quality profile in this submarket — average credit score on applications, eviction rate, late-payment / NSF rate, and stable-employment percentage? A property-management company in the area should have these aggregated.
- How much new apartment / multifamily construction is in the pipeline within 1–3 miles? Heavy new supply (>2% of stock underway) typically softens rents 12–24 months out; light construction supports rent growth.
Investment metrics
- 1% rule
- 1.22% ✓
- Cap rate
- 9.99%
- Cash-on-cash
- 13.20%
- DSCR
- 1.59
- GRM
- 6.8
CMA / ARV
- ARV (median comp)
- $180,732
- List price
- $169,997
- Delta
- -5.94%
- Verdict
- FAIR
- Comps
- 20 within 1.0 mi
Show comp detail 3 sales within ~0.75 mi
| Address | Dist | Beds/Ba | Sqft | Sold | Price | $/sf | Match |
|---|---|---|---|---|---|---|---|
| 1089-1091 E 26th Ave | 0.52mi | 4/— | 1,500 (+12%) | 2mo | $185,000 | $123 | 55 |
| 2243-2245 Jefferson Ave | 0.30mi | 4/— | 1,456 (+8%) | 24mo | $135,000 | $93 | 53 |
| 2885 Atwood Ter | 0.63mi | 4/— | 1,456 (+8%) | 22mo | $209,900 | $144 | 39 |
Match score weights: distance 35% · size 25% · config 20% · recency 20%. Top-matched comps best support the ARV.
Projected returns pro-forma
-3.0% appreciation · 3.41% rent growth · sell at horizon
- IRR
- 3.6%
- Equity multiple
- 1.14×
- Total profit
- $6,655
- Equity at exit
- $25,347
- IRR
- 13.5%
- Equity multiple
- 2.10×
- Total profit
- $52,259
- Equity at exit
- $14,698
Cash invested: $47,599 (down + closing). Projections, not guarantees.
Landlord ↔ Tenant lean methodology
- Overall (STATE)
- 73 Landlord-Friendly
- State Ohio
- 73 Landlord-Friendly · R+6
- County
- — inherits STATE
- City
- — inherits STATE
ZIP-level market 43211
- Home prices YoY
- -27.3%
- Rents YoY
- 3.4%
- Active inventory
- 166
- Price-to-rent
- 13.7×
Monthly cashflow live
- Estimated rent
- $2,070 high interval (Pro) →
- Mortgage (P&I)
- −$891
- Tax from tax record
- −$149 /mo · $1,792/yr
- Insurance
- −$71
- HOA
- −$0
- Vacancy / Maint / Mgmt
- −$435
- Net cashflow
- $524
Break-even live
Sensitivity live
| Price | -10% $620 | -5% $572 | +0% $524 | +5% $476 | +10% $427 |
|---|---|---|---|---|---|
| Rent | -10% $360 | -5% $442 | +0% $524 | +5% $605 | +10% $687 |
| Rate | -1.0pp $609 | -0.5pp $567 | base $524 | +0.5pp $480 | +1.0pp $435 |
2-unit breakdown (identical units grouped — click to expand)
| Units | Beds | Baths | Est. rent |
|---|---|---|---|
| 2× units | 2 | — | $2,070 |
| #1 | 2 | — | $1,035 |
| #2 | 2 | — | $1,035 |
| Total (2 units) | $2,070 | ||
UW: 25.0% down · 7.5% · 30yr · 1.5% tax · 5.0% vac · 8.0% maint · 8.0% mgmt
Financing live
Cash to close
- Down payment
- $42,499
- Closing costs
- $5,100
- Reserves months
- —
- Total cash needed
- —
Loan-product check · same deal, 3 products live
Conventional
25% down · 7.5% · 30yr
- Down + closing
- —
- Monthly P&I
- —
- Monthly cashflow
- —
- DSCR
- —
- Eligible?
- —
Personal DTI + credit; lowest rate.
DSCR
20% down · 8.5% · 30yr
- Down + closing
- —
- Monthly P&I
- —
- Monthly cashflow
- —
- DSCR
- —
- Eligible?
- —
No personal income docs; deal must DSCR.
Hard money
10% down · 12.0% · 12mo
- Down + closing
- —
- Monthly P&I
- —
- Monthly cashflow
- —
- DSCR
- —
- Eligible?
- —
Short-term bridge; refi at stabilization.
Rent comps 40 comps
| Address | Beds | Baths | Sqft | Rent | $/sqft | DOM | Units | Dist |
|---|---|---|---|---|---|---|---|---|
| 2453 McGuffey Rd Columbus, OH | 5.0 | 3.0 | 1782 | $2,200 | $1.23 | 45d | 1 | 0.07mi |
| 2566 Atwood Ter Columbus, OH | 3.0 | 1.0 | 979 | $1,500 | $1.53 | 25d | 1 | 0.16mi |
| 2460 Hiawatha St Columbus, OH | 3.0 | 1.0 | 1768 | $1,300 | $0.74 | 9d | 1 | 0.18mi |
| 1269 Minnesota Ave Columbus, OH | 3.0 | 1.0 | 1075 | $1,550 | $1.44 | 9d | 1 | 0.41mi |
| 2767 Hiawatha St Columbus, OH | 3.0 | 1.0 | 896 | $1,475 | $1.65 | 9d | 1 | 0.44mi |
| 2176 Ontario St Columbus, OH | 4.0 | 2.0 | 1066 | $1,650 | $1.55 | 25d | 1 | 0.51mi |
| 1354 Minnesota Ave Columbus, OH | 3.0 | 2.0 | 1350 | $1,800 | $1.33 | 13d | 1 | 0.52mi |
| 1435 Republic Ave Columbus, OH | 3.0 | 1.0 | 908 | $1,395 | $1.54 | 9d | 1 | 0.59mi |
| 1435 Republic Ave Columbus, OH | 3.0 | 1.0 | 908 | $1,425 | $1.57 | 21d | 1 | 0.59mi |
| 1410 E Blake Ave Columbus, OH | 3.0 | 1.0 | 1300 | $1,700 | $1.31 | 25d | 1 | 0.70mi |
| 1514 Republic Ave Unit 1514 Columbus, OH | 3.0 | 1.5 | 1288 | $1,450 | $1.13 | 25d | 1 | 0.70mi |
| 1527 Republic Ave Columbus, OH | 3.0 | 1.0 | 1176 | $1,345 | $1.14 | 45d | 1 | 0.72mi |
| 1527 Republic Ave Columbus, OH | 3.0 | 1.0 | 1176 | $1,299 | $1.10 | 25d | 1 | 0.72mi |
| 2552 Glenmawr Ave Unit 1407032P Columbus, OH | 3.0 | 3.0 | 1593 | $6,256 | $3.93 | 9d | 1 | 0.82mi |
| 2552 Glenmawr Ave Unit 1407028P Columbus, OH | 3.0 | 3.0 | 1593 | $6,320 | $3.97 | 13d | 1 | 0.82mi |
| 1536 E Weber Rd Columbus, OH | 3.0 | 2.0 | 1332 | $1,695 | $1.27 | 21d | 1 | 0.83mi |
| 1536 E Weber Rd Columbus, OH | 3.0 | 2.0 | 1332 | $1,695 | $1.27 | 25d | 1 | 0.83mi |
| 1185 E 22nd Ave Columbus, OH | 3.0 | 1.0 | 1304 | $1,400 | $1.07 | 45d | 1 | 0.85mi |
| 1269 E 23rd Ave Columbus, OH | 3.0 | 1.0 | 1175 | $1,350 | $1.15 | 9d | 1 | 0.85mi |
| 3054 McGuffey Rd Columbus, OH | 3.0 | 1.0 | 1106 | $1,450 | $1.31 | 45d | 1 | 0.86mi |
| 1320 E 23rd Ave Unit 1320 Columbus, OH | 3.0 | 1.0 | 1134 | $1,050 | $0.93 | 45d | 1 | 0.88mi |
| 431 E Tompkins St Unit 433 Columbus, OH | 3.0 | 1.0 | 1200 | $1,595 | $1.33 | 9d | 1 | 0.88mi |
| 1624 Kohr Pl Columbus, OH | 3.0 | 1.0 | 1176 | $1,400 | $1.19 | 16d | 1 | 0.91mi |
| 1906-1908 Cleveland Ave Columbus, OH | 3.0 | 1.0 | 1384 | $1,295 | $0.94 | 45d | 1 | 0.94mi |
| 1272 E 21st Ave Unit 1272 Columbus, OH | 3.0 | 1.5 | 1176 | $1,400 | $1.19 | 12d | 1 | 0.94mi |
| 1695 E Weber Rd Columbus, OH | 4.0 | 2.0 | 1560 | $1,600 | $1.03 | 17d | 1 | 1.01mi |
| 2350 Indiana Ave Columbus, OH | 3.0 | 2.0 | 1195 | $2,600 | $2.18 | 45d | 1 | 1.02mi |
| 1709 E Weber Rd Columbus, OH | 3.0 | 1.0 | 1154 | $1,100 | $0.95 | 45d | 1 | 1.02mi |
| 325 Clinton St Unit 325 Columbus, OH | 3.0 | 1.0 | 1176 | $1,650 | $1.40 | 18d | 1 | 1.03mi |
| 1318-1320 E 20th Ave Unit 1318 Columbus, OH | 3.0 | 1.0 | 1120 | $1,275 | $1.14 | 9d | 1 | 1.04mi |
| 335 E Duncan St Columbus, OH | 3.0 | 1.0 | 1120 | $1,595 | $1.42 | 45d | 1 | 1.04mi |
| 780 E Brighton Rd Columbus, OH | 3.0 | 1.0 | 1086 | $1,500 | $1.38 | 9d | 1 | 1.06mi |
| 2658 Deming Ave Columbus, OH | 3.0 | 1.0 | 1120 | $1,695 | $1.51 | 45d | 1 | 1.06mi |
| 2584 Deming Ave Columbus, OH | 3.0 | 1.5 | 1350 | $2,000 | $1.48 | 17d | 1 | 1.07mi |
| 2872 Indianola Ave Columbus, OH | 3.0 | 1.0 | 1000 | $1,799 | $1.80 | 45d | 1 | 1.07mi |
| 1145 E 18th Ave Columbus, OH | 3.0 | 1.0 | 1202 | $1,225 | $1.02 | 16d | 1 | 1.07mi |
| 1011 Mohican Ave Columbus, OH | 3.0 | 1.0 | 1091 | $1,399 | $1.28 | 45d | 1 | 1.07mi |
| 1612 E 25th Ave Columbus, OH | 3.0 | 1.0 | 1200 | $1,250 | $1.04 | 25d | 1 | 1.12mi |
| 1156 E 17th Ave Columbus, OH | 3.0 | 1.0 | 1212 | $1,200 | $0.99 | 45d | 1 | 1.12mi |
| 2027 N 4th St Columbus, OH | 5.0 | 2.0 | 1660 | $2,000 | $1.20 | 45d | 1 | 1.13mi |
Listing history 32 events
-
2026-06-21days on market $169,997 Active 37 DOM
-
2026-06-18days on market $169,997 Active 34 DOM
-
2026-06-17days on market $169,997 Active 33 DOM
-
2026-06-16days on market $169,997 Active 32 DOM
-
2026-06-15days on market $169,997 Active 31 DOM
-
2026-06-13days on market $169,997 Active 29 DOM
-
2026-06-13days on market $169,997 Active 28 DOM
-
2026-06-09days on market $169,997 Active 25 DOM
-
2026-06-08days on market $169,997 Active 24 DOM
-
2026-06-07days on market $169,997 Active 23 DOM
-
2026-06-05days on market $169,997 Active 20 DOM
-
2026-06-03days on market $169,997 Active 19 DOM
-
2026-06-02days on market $169,997 Active 18 DOM
-
2026-06-01days on market $169,997 Active 17 DOM
-
2026-05-31days on market $169,997 Active 16 DOM
-
2026-05-15$169,997 Active 1746-char remark
-
2026-05-01historical $850
-
2026-03-17historical $850
-
2026-03-17$850
-
2026-02-23price $850
-
2025-11-01price $800
-
2025-10-17$850
-
2019-06-18soldstatus $210,000
-
2017-03-03soldstatus $33,500
-
1998-07-14soldstatus $30,000
-
1998-07-14soldstatus $57,000
-
1998-07-14soldstatus $57,000
-
1998-07-09soldstatus $30,000 64-char remark
Show marketing remark (64 chars)
CONCRETE BLOCK CONSTRUCTION. ONE OF FIVE AVAILABLE SIDE BY SIDE.
-
1998-06-29historical 64-char remark
Show marketing remark (64 chars)
CONCRETE BLOCK CONSTRUCTION. ONE OF FIVE AVAILABLE SIDE BY SIDE.
-
1998-04-25$36,900 64-char remark
Show marketing remark (64 chars)
CONCRETE BLOCK CONSTRUCTION. ONE OF FIVE AVAILABLE SIDE BY SIDE.
-
1995-10-06soldstatus $26,410
-
1981-09-01soldstatus $28,200
ⓘ Source: listings_history table (triggers on properties + properties_extension) + one-shot
backfill from property_details.listing_events for pre-trigger history.
Tax reassessment forecast OH · Partial reset (capped growth)
- Current annual tax
- $1,792 · $149/mo
- Projected year-2 tax
- $2,222 · $185/mo
- Expected delta
- +$430/yr (+$36/mo · 24.0%)
ⓘ Screening estimate from a state-policy table — verify with the county assessor before closing.
Climate risk First Street
- Flood 1/10 Low FEMA zone X (unshaded) · 0% chance over 30 yrs
- Wildfire 1/10 Low
- Heat 3/10 Moderate 7 d/yr ≥100°F today · 17 d/yr by 30 yrs out
- Wind 2/10 Low 100% chance of damaging wind over 30 yrs
- Air quality 3/10 Moderate 2 unhealthy d/yr today · 4 by 30 yrs out
Nearby sold comps map
Loading sold comps map…
Walkable amenities ~0.75 mi
Loading nearby amenities…
Taxation est. · year 1
- Rental income
- $24,840
- − Mortgage interest
- −$9,522
- − Property taxes
- −$1,792
- − Insurance
- −$850
- − Repairs & maintenance
- −$1,987
- − Management
- −$1,987
- − Depreciation
- −$4,945
- Taxable income
- $3,756
- Est. tax owed @ 24.0%
- −$901
- After-tax cash flow
- $5,383/yr
For passive investors: Depreciation is non-cash, so a rental often shows a tax loss while cash-flowing — sheltering income. Rental losses are passive: they offset passive income freely, and up to $25,000/yr can offset ordinary (W-2) income if you actively participate and your MAGI is under $100k (phasing out to $0 by $150k); unused losses carry forward. On sale, claimed depreciation is recaptured at up to 25%, and gains may owe capital-gains tax (a 1031 exchange can defer both). Figures are a year-1 estimate at your 24.0% rate — not tax advice; consult a CPA.
Schools (NCES district)
- District
- Columbus City School District
- NCES district ID
- 3904380
- Math proficiency
- 15% ▼ -17.00%
- Reading proficiency
- 26% ▼ -12.00%
- Median HH income
- $38,483
- Composite
- 17.19/100
- National rank
- #9105
- State rank
- #626 of 656 in OH
Livability — Columbus
- Score
- 81/100
- State rank
- #97
- US rank
- #1491
Category grades
Schools grade is shown separately in the Schools card above.
Census & demographics
- Census place
- Columbus, OH
- County
- Franklin County · 1,351,780 people
- City population
- 612,189
- Metro
- Columbus, OH
- Population (ZIP)
- 22,313
- Household income
- $42,579
- Rent vs Own
- Severe rent burden
- 1282.0
Population outlook (Franklin County) Hauer SSP2
- Today (2025)
- 1,456,139 people
- By 2030
- 1,556,890 · +6.9%
- By 2040
- 1,757,349 · +20.7%
- By 2050
- 1,950,539 · +34.0%
- By 2075
- 2,376,171 · +63.2%
- By 2100
- 2,636,796 · +81.1%
Race, ethnicity, and origin ACS 2023
- Neighborhood character
- Diverse neighborhood (Simpson 0.60)
- Race & ethnicity
- Black 58% White 21% Hispanic / Latino 13% Two or more races 12% Asian 2%
- Hispanic origin (detail)
- Mexican 8% Dominican 1%
- Common ancestry
- Italian 1%
- Foreign-born
- 10% · Canada, India
- Languages at home
- 84% English-only · Spanish 11% Other Indo-European 2% Arabic 1%
Political lean MEDSL · Franklin
- 2024 margin
- Strong D (+28.4) · D 63.7% · R 35.3% · Other 1.0%
- 2008→2024 swing
- +7.7pp toward D · 2008: 20.7pp · 2024: 28.4pp
- All cycles
- 2024: D+28.4 2020: D+31.4 2016: D+25.9 2012: D+21.7 2008: D+20.7
Not yet ingested
- Civics
- —
Market trends
- HPI YoY
- ▼ -94.10%
- Current HPI
- 250.3885
- Rent YoY
- ▲ 3.41%
- Metro
- Columbus, OH
- State GDP YoY
- ▲ 1.98%
- F500 in state
- 48
Industry mix (Fortune 500 HQ in OH)
| Industry | F500 HQs | Revenue |
|---|---|---|
| Insurance | 3 | $145B |
|
||
| Industrial Machinery | 3 | $49B |
|
||
| Financial Services | 3 | $24B |
|
||
| Consumer Goods | 2 | $93B |
|
||
| Aerospace / Defense | 2 | $47B |
|
||
| Utilities | 2 | $33B |
|
||
Price history
+502.8% since first listed17 events — show timeline
- 2026-05-15 Listed $169,997 CBRMLS
- 2026-05-01 Rental Removed $850 RENTALBEAST
- 2026-03-17 Rental Removed $850 TENANTTURNER2
- 2026-03-17 Listed for Rent $850 TENANTTURNER2
- 2026-02-23 Price Changed $850 RENTALBEAST
- 2025-11-01 Price Changed $800 RENTALBEAST
- 2025-10-17 Listed for Rent $850 RENTALBEAST
- 2019-06-18 Sold (Public Records) $210,000 Public Records
- 2017-03-03 Sold (Public Records) $33,500 Public Records
- 1998-07-14 Sold (Public Records) $57,000 Public Records
- 1998-07-14 Sold (Public Records) $57,000 Public Records
- 1998-07-14 Sold (Public Records) $30,000 Public Records
- 1998-07-09 Sold (MLS) $30,000 CBRMLS
- 1998-06-29 Listing Removed — CBRMLS
- 1998-04-25 Listed $36,900 CBRMLS
- 1995-10-06 Sold (Public Records) $26,410 Public Records
- 1981-09-01 Sold (Public Records) $28,200 Public Records
Property tax history
+6.0%/yrLatest (2024): $1,792 · -0.6% YoY. Source: county tax records.
Cash-flow waterfall
monthlySold comps — $/sqft
last 12 mo · ≤1 miLoading sold comps…