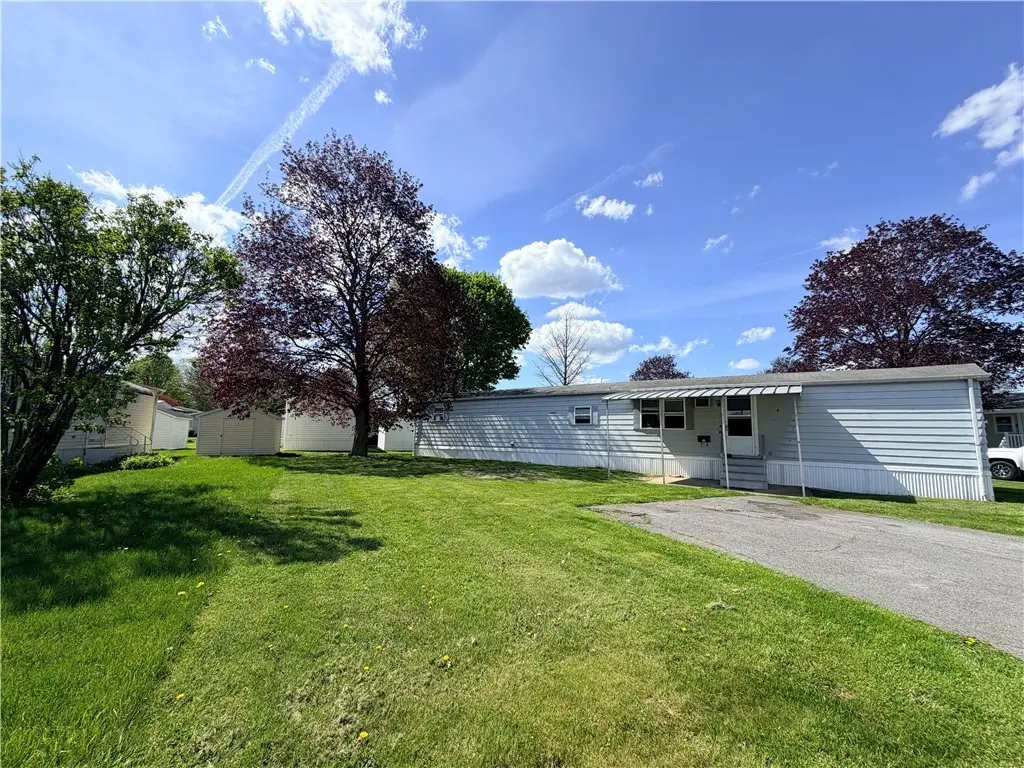
4 Evergreen St · Bath, NY
Flood risk 1/10 · Minimal
- FEMA flood zone
- X
- Chance of flooding over 30 yrs
- 0.0%
- Est. flood insurance / yr
- $473 – $860
Fire risk 2/10 · Minimal
- Est. fire insurance / yr
- $691 – $1,283
Heat risk 3/10 · Minor
- Hot days now (above 93°F)
- 7 days/yr
- Hot days in 30 yrs
- 17 days/yr
Wind risk 1/10 · Minimal
- Chance of severe wind over 30 yrs
- —
Air-quality risk 2/10 · Minimal
- Unhealthy air days now
- 0 days/yr
- Unhealthy air days in 30 yrs
- 1 days/yr
Risk factors via First Street. Map © Google.
Why this score? — see what drove the C+ grade
The composite is a weighted blend of 9 inputs, each scored 0–100. Each bar is that input's sub-score; the figure is the points it added to the 100-point composite (weight × sub-score).
- Cash flow +30.0/30.0
- 1% rule +10.0/10.0
- DSCR +10.0/10.0
- Condition / age +3.8/5.0
- Schools +3.4/10.0
- Livability +3.4/5.0
- Rent growth +2.5/5.0
- ARV discount +0.0/15.0
- Appreciation +0.0/10.0
$29,999
🖨 Deal sheet 📄 Offer letter ✓ Due diligence
Listing remarks
Welcome to easy, affordable living in a peaceful community surrounded by green space and scenic hill views. This 2 bedroom, 2 bath manufactured home offers comfort, convenience and value. Step inside to updated flooring and fresh paint, newer mechanicals including furnace and hot water heater giving you added peace of mind. Enjoy your morning coffee on the covered porch. Outside a 10x10 shed provides space for storage for tools, seasonal items or hobbies.
Key facts
- Green space
- Covered porch
- Fresh paint
Tags
Property features AI
Finance
- Financial info: Land lease: $538
Exterior
- Parking: No garage
- Utilities: Electricity available; Public water available; Sewer connected
- Home design: Single-story; Single-wide mobile home (Holiday Cottage model); Resale
- Construction: Aluminum siding; Asphalt, membrane, and rubber roofing
- Exterior features: Blacktop driveway; Deck; Patio; Rectangular lot; Road frontage on a main thoroughfare
Interior
- Kitchen: Dishwasher; Electric cooktop; Free-standing range; Oven; Refrigerator
- Bedrooms: 2 main-level bedrooms
- Flooring: Laminate; Tile; Varies
- Bathrooms: 2 full bathrooms (both on main level)
- Heating & cooling: Gas heating; Baseboard heating; Hot water heating; Window unit(s) for cooling
- Interior features: Ceiling fan(s); Separate/formal dining room; Bedroom on main level
- Laundry & utility: Gas water heater
Neighborhood map
What this means for you Summary
Snapshot
- This is a 2-bed/2.0-bath manufactured listed at $30k. Condition is rated good.
Deal economics
- At list price, monthly cash flow is $563 ($7k/yr) — positive.
- The deal already cash-flows at list — no discount required.
- Meets the 1% rule at list price ($975 rent vs $30k).
- Recommended offer: $29k (3.0% below list) — sets the bar for market timing.
- Cap rate 28.8% vs local median 3.6% in Bath — top-decile yield for the area; either an underpriced asset or a hidden risk that comps aren't pricing in. Stress-test before assuming the spread holds.
Location & tenants
- Location reads 68/100 on livability (#533 in NY) — a middle-class / working-renter tenant base. Strengths: cost of living A+, housing A+, health & safety A+; Watch: employment D, crime D-, amenities F.
- Bath Central School District (town): math 38% / reading 44% proficiency, ranked #522 of 590 in NY (top 88%) — families likely to look elsewhere, expect single-tenant / working-renter base with shorter leases.
- Market conditions: 67 active listings in the ZIP; 1 comparable units currently listed for rent nearby; 196 units permitted in Steuben County in 2024 (0 in 5+ unit buildings).
Forward outlook
- Local home prices are declining (-3.0%/yr); year-one equity from $207 of loan paydown is wiped out by about $900 of value loss. Plan a longer hold.
- Steuben County population projected at -20% by 2050 — secular population decline; favor cash flow + early exit over multi-decade hold.
- At projected returns (-3.0% appreciation + 3.0% rent growth), your $8k cash investment doubles in ~2 years — after that, you're playing with house money.
Negotiation context
- It's been on market 44 days — a 3% lower offer ($29k) is reasonable based on typical stale-listing flexibility.
Questions for the listing agent
- It's been on market 44 days. Have you received any prior offers? Is the seller open to a 3% concession, seller financing, or rate buy-down credit?
- Built in 1974 — when were the roof, HVAC, electrical panel, plumbing, and water heater last replaced?
- Is there a deadline driving the sale (1031 exchange, divorce, estate, relocation)? That informs how much negotiation room exists.
- Crime grade is D in this area — have there been break-ins, vandalism, or insurance claims at this property in the last 3 years? What carrier currently insures it and at what premium?
- What's the average days-on-market for RENTAL listings here right now (not sales)? A rising rental-DOM trend means longer vacancies and softer asking-rent achievability than the comps imply.
- What's the recent tenant-quality profile in this submarket — average credit score on applications, eviction rate, late-payment / NSF rate, and stable-employment percentage? A property-management company in the area should have these aggregated.
- How much new for-sale + rental construction is in the pipeline within 1–3 miles? Heavy new supply typically softens prices + rents 12–24 months out; constrained supply supports both.
Investment metrics
- 1% rule
- 3.25% ✓
- Cap rate
- 28.81%
- Cash-on-cash
- 80.42%
- DSCR
- 4.58
- GRM
- 2.6
CMA / ARV
- ARV (median comp)
- $20,933
- List price
- $29,999
- Delta
- 43.31%
- Verdict
- OVERPRICED
- Comps
- 2 within 2.0 mi
Show comp detail 2 sales within ~0.75 mi
| Address | Dist | Beds/Ba | Sqft | Sold | Price | $/sf | Match |
|---|---|---|---|---|---|---|---|
| 7103 E Washington Street Ext #53 | 0.60mi | 3/1.0 (+1) | 1,051 (+0%) | 8mo | $17,000 | $16 | 56 |
| 13 Dogwood | 0.04mi | 2/1.0 | 900 (-14%) | 23mo | $28,500 | $32 | 51 |
Match score weights: distance 35% · size 25% · config 20% · recency 20%. Top-matched comps best support the ARV.
Projected returns pro-forma
-3.0% appreciation · 3.0% rent growth · sell at horizon
- IRR
- 80.6%
- Equity multiple
- 4.69×
- Total profit
- $31,007
- Equity at exit
- $4,473
- IRR
- 84.0%
- Equity multiple
- 9.72×
- Total profit
- $73,227
- Equity at exit
- $2,594
Cash invested: $8,400 (down + closing). Projections, not guarantees.
Landlord ↔ Tenant lean methodology
- Overall (STATE)
- 15 Strongly Tenant-Friendly
- State New York
- 15 Strongly Tenant-Friendly · D+10
- County
- — inherits STATE
- City
- — inherits STATE
ZIP-level market 14810
- Home prices YoY
- -18.8%
- Active inventory
- 67
- Price-to-rent
- 2.6×
Monthly cashflow live
- Estimated rent
- $975 medium interval (Pro) →
- Mortgage (P&I)
- −$157
- Tax est. 1.5%
- −$37 /mo · $450/yr
- Insurance
- −$12
- HOA
- −$0
- Vacancy / Maint / Mgmt
- −$205
- Net cashflow
- $563
Break-even live
UW: 25.0% down · 7.5% · 30yr · 1.5% tax · 5.0% vac · 8.0% maint · 8.0% mgmt
Financing live
Cash to close
- Down payment
- $7,500
- Closing costs
- $900
- Reserves months
- —
- Total cash needed
- —
Loan-product check · same deal, 3 products live
Conventional
25% down · 7.5% · 30yr
- Down + closing
- —
- Monthly P&I
- —
- Monthly cashflow
- —
- DSCR
- —
- Eligible?
- —
Personal DTI + credit; lowest rate.
DSCR
20% down · 8.5% · 30yr
- Down + closing
- —
- Monthly P&I
- —
- Monthly cashflow
- —
- DSCR
- —
- Eligible?
- —
No personal income docs; deal must DSCR.
Hard money
10% down · 12.0% · 12mo
- Down + closing
- —
- Monthly P&I
- —
- Monthly cashflow
- —
- DSCR
- —
- Eligible?
- —
Short-term bridge; refi at stabilization.
Rent comps 1 comps
| Address | Beds | Baths | Sqft | Rent | $/sqft | DOM | Units | Dist |
|---|---|---|---|---|---|---|---|---|
| 32 W William St #201 Bath, NY | 2.0 | 1.0 | 1100 | $975 | $0.89 | 43d | 1 | 1.21mi |
Listing history 16 events
-
2026-06-18days on market $29,999 Active 44 DOM
-
2026-06-17days on market $29,999 Active 43 DOM
-
2026-06-16days on market $29,999 Active 42 DOM
-
2026-06-16price $29,999 Active 41 DOM
-
2026-06-15days on market $42,000 Active 41 DOM
-
2026-06-13days on market $42,000 Active 39 DOM
-
2026-06-12days on market $42,000 Active 38 DOM
-
2026-06-09days on market $42,000 Active 35 DOM
-
2026-06-08days on market $42,000 Active 34 DOM
-
2026-06-07days on market $42,000 Active 33 DOM
-
2026-06-07days on market $42,000 Active 32 DOM
-
2026-06-04days on market $42,000 Active 29 DOM
-
2026-06-02days on market $42,000 Active 28 DOM
-
2026-06-01days on market $42,000 Active 27 DOM
-
2026-05-31days on market $42,000 Active 26 DOM
-
2026-05-05$42,000 Active 459-char remark
ⓘ Source: listings_history table (triggers on properties + properties_extension) + one-shot
backfill from property_details.listing_events for pre-trigger history.
Climate risk First Street
- Flood 1/10 Low FEMA zone X · 0% chance over 30 yrs
- Wildfire 2/10 Low
- Heat 3/10 Moderate 7 d/yr ≥93°F today · 17 d/yr by 30 yrs out
- Wind 1/10 Low
- Air quality 2/10 Low 0 unhealthy d/yr today · 1 by 30 yrs out
Nearby sold comps map
Loading sold comps map…
Walkable amenities ~0.75 mi
Loading nearby amenities…
Taxation est. · year 1
- Rental income
- $11,700
- − Mortgage interest
- −$1,680
- − Property taxes
- −$450
- − Insurance
- −$150
- − Repairs & maintenance
- −$936
- − Management
- −$936
- − Depreciation
- −$873
- Taxable income
- $6,675
- Est. tax owed @ 24.0%
- −$1,602
- After-tax cash flow
- $5,153/yr
For passive investors: Depreciation is non-cash, so a rental often shows a tax loss while cash-flowing — sheltering income. Rental losses are passive: they offset passive income freely, and up to $25,000/yr can offset ordinary (W-2) income if you actively participate and your MAGI is under $100k (phasing out to $0 by $150k); unused losses carry forward. On sale, claimed depreciation is recaptured at up to 25%, and gains may owe capital-gains tax (a 1031 exchange can defer both). Figures are a year-1 estimate at your 24.0% rate — not tax advice; consult a CPA.
Condition & rehab AI · 1 photo
This 2-bedroom, 2-bath manufactured home is in good condition with minimal repairs needed. It offers a good return on investment with updates that can significantly increase its value.
Value-add opportunities
- Both Painting exterior siding — Enhances curb appeal and can increase both resale and rental value
- Both Landscaping improvements — Enhances curb appeal and can increase both resale and rental value
Renovation cost estimate screening
Value-add ROI direction
- Both Painting exterior siding — Enhances curb appeal and can increase both resale and rental value ↑
- Both Landscaping improvements — Enhances curb appeal and can increase both resale and rental value ↑
ⓘ Cost ranges are severity-bucket heuristics (US national rule-of-thumb). Get contractor quotes + a written scope before underwriting a rehab budget.
Schools (NCES district)
- District
- Bath Central School District
- NCES district ID
- 3604050
- Math proficiency
- 38% ▼ -8.00%
- Reading proficiency
- 44% ▲ 8.00%
- Median HH income
- $38,973
- Composite
- 34.25/100
- National rank
- #5254
- State rank
- #522 of 590 in NY
Livability — Bath
- Score
- 68/100
- State rank
- #533
- US rank
- #9644
Category grades
Schools grade is shown separately in the Schools card above.
Census & demographics
- Census place
- Bath, NY
- Population (ZIP)
- 11,412
Population outlook (Steuben County) Hauer SSP2
- Today (2025)
- 93,062 people
- By 2030
- 89,793 · -3.5%
- By 2040
- 82,353 · -11.5%
- By 2050
- 74,286 · -20.2%
- By 2075
- 55,589 · -40.3%
- By 2100
- 37,587 · -59.6%
Race, ethnicity, and origin ACS 2023
- Neighborhood character
- Predominantly White (94%)
- Race & ethnicity
- White 94% Black 3% Two or more races 2% Hispanic / Latino 1%
- Common ancestry
- Romanian 5% Lithuanian 3% Slovak 2%
- Foreign-born
- 1%
- Languages at home
- 98% English-only · German/W. Germanic 2%
Political lean MEDSL · Steuben
- 2024 margin
- Solid R (+31.8) · D 34.1% · R 65.9%
- 2008→2024 swing
- -15.0pp toward R · 2008: -16.8pp · 2024: -31.8pp
- All cycles
- 2024: R+31.8 2020: R+29.6 2016: R+36.2 2012: R+16.4 2008: R+16.8
Not yet ingested
- Civics
- —
Market trends
- HPI YoY
- ▼ -44.58%
- Current HPI
- 193.0727
- Rent YoY
- —
- Metro
- —
- State GDP YoY
- ▲ 2.60%
- F500 in state
- 92
Industry mix (Fortune 500 HQ in NY)
| Industry | F500 HQs | Revenue |
|---|---|---|
| Financial Services | 10 | $950B |
|
||
| Consumer Goods | 9 | $162B |
|
||
| Insurance | 4 | $225B |
|
||
| Telecommunications | 2 | $144B |
|
||
| Pharmaceuticals | 2 | $112B |
|
||
| Media / Entertainment | 2 | $69B |
|
||
Price history
-28.6% since first listed2 events — show timeline
- 2026-06-15 Price Changed $29,999 UNYREIS
- 2026-05-05 Listed $42,000 UNYREIS
Cash-flow waterfall
monthlySold comps — $/sqft
last 12 mo · ≤1 miLoading sold comps…