1801 Bedford Ln #27 · Sun City Center, FL
Flood risk 1/10 · Minimal
- FEMA flood zone
- X (unshaded)
- Chance of flooding over 30 yrs
- 0.0%
- Est. flood insurance / yr
- $507 – $1,088
Fire risk 4/10 · Minor
- Est. fire insurance / yr
- $947 – $1,759
Heat risk 10/10 · Severe
- Hot days now (above 109°F)
- 7 days/yr
- Hot days in 30 yrs
- 28 days/yr
Wind risk 9/10 · Severe
- Chance of severe wind over 30 yrs
- 99.0%
Air-quality risk 3/10 · Minor
- Unhealthy air days now
- 3 days/yr
- Unhealthy air days in 30 yrs
- 3 days/yr
Risk factors via First Street. Map © Google.
Why this score? — see what drove the D grade
The composite is a weighted blend of 9 inputs, each scored 0–100. Each bar is that input's sub-score; the figure is the points it added to the 100-point composite (weight × sub-score).
- Cash flow +7.5/30.0
- ARV discount +7.5/15.0
- 1% rule +7.4/10.0
- Schools +4.2/10.0
- Livability +3.9/5.0
- Appreciation +3.4/10.0
- Rent growth +3.2/5.0
- Condition / age +2.5/5.0
- DSCR +1.6/10.0
$125,000
🖨 Deal sheet 📄 Offer letter ✓ Due diligence
Listing remarks MLS
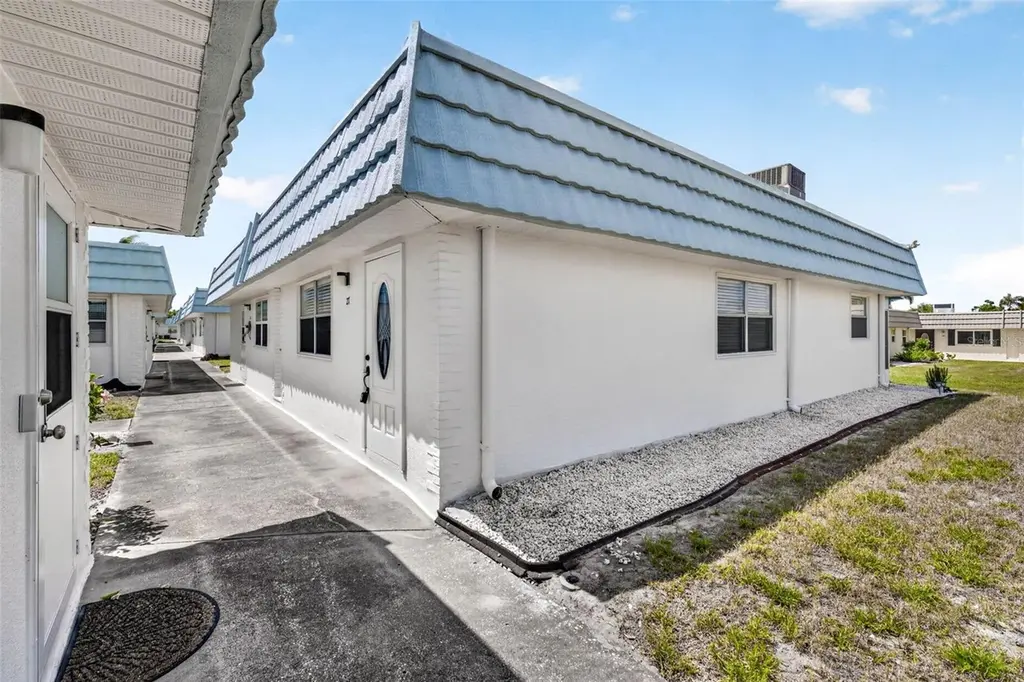
One or more photo(s) has been virtually staged. Now available for sale in the highly desirable Kings Point 55+ active adult community, this beautifully maintained 1-bedroom, 1.5-bath condo offers comfortable living, resort-style amenities, and a low-maintenance lifestyle. Perfect for active adults seeking convenience, community, and long-term value in one of the area’s most popular 55+ communities. Step inside to a freshly painted, open-concept living and dining area that flows seamlessly into the kitchen, creating a bright and spacious layout ideal for both everyday living and entertaining. The additional half bathroom for guests adds extra convenience and functionality. The spacious primary bedroom features generous closet space and a private en suite bathroom with a shower/tub combination. Sliding glass doors lead directly from the bedroom to a private screened-in lanai—the perfect place to enjoy your morning coffee, fresh air, and peaceful surroundings. The lanai also includes a washer and dryer, adding everyday convenience right at home. Owning in Kings Point means enjoying a maintenance-free lifestyle with exterior upkeep handled for you, making this property an excellent option for seasonal residents, downsizers, or those seeking easy Florida living. Residents have access to an impressive array of resort-style amenities, including: Multiple swimming pools Fitness centers and wellness facilities Tennis courts and recreational activities Social clubs, events, and community gatherings Beautifully maintained grounds and walking paths This vibrant, active adult community offers countless opportunities to stay social, engaged, and active while enjoying the comfort of a peaceful neighborhood. If you're searching for an affordable 55+ condo for sale with exceptional amenities and a strong sense of community, this Kings Point home is a must-see. Schedule your private showing today and experience the relaxed, resort-style lifestyle that makes Kings Point so desirable!
Key facts
- Tennis courts
- Fitness centers
- Open-concept living
Tags
Neighborhood map
What this means for you Summary
Snapshot
- This is a 1-bed/2.0-bath condo listed at $125k.
Deal economics
- At list price, monthly cash flow is $-158 ($-2k/yr) — negative.
- To cash-flow at today's rent, offer at most $97k (22.4% below list).
- Meets the 1% rule at list price ($2k rent vs $125k).
- Recommended offer: $97k (22.4% below list) — sets the bar for cash-flow.
Location & tenants
- Location reads 78/100 on livability (#178 in FL, #2,736 nationally) — a middle-class / working-renter tenant base. Strengths: housing A+, health & safety A+, crime B+; Watch: schools D+, amenities F.
- Hillsborough (suburban): math 47% / reading 50% proficiency, ranked #41 of 73 in FL (top 56%) — families likely to look elsewhere, expect single-tenant / working-renter base with shorter leases.
- Market conditions: Rents rising (+2.6%/yr); 602 active listings in the ZIP; 27 comparable units currently listed for rent nearby; rentals at typical pace (median 24d on market — plan ~3-4 weeks tenant-placement turnaround); 9,053 units permitted in Hillsborough County in 2024 (4,555 in 5+ unit buildings).
Forward outlook
- Local home prices are declining (-3.0%/yr); year-one equity from $864 of loan paydown is wiped out by about $4k of value loss. Plan a longer hold.
- Hillsborough County population projected at +37% by 2050 — long-run rental-demand tailwind backs the buy-and-hold thesis.
Negotiation context
- It's been on market 83 days — a 6% lower offer ($118k) is reasonable based on typical stale-listing flexibility.
- 7 sale attempts since 9y ago with the ask held roughly flat each time — persistent listings suggest the price (not the market) is what's stuck; bring a comps-based counter.
Risks & watch-outs
- Watch-outs: HOA is 39% of rent.
- Climate carrying-cost: severe wind risk, 99% chance of damaging wind over 30y; extreme-heat days projected 7→28/yr by 2055 (HVAC capex compounding) — expect insurance premiums to compound above CPI over the hold.
Questions for the listing agent
- What do current leases actually rent for vs. the listed asking? Can we see a recent rent roll and the last 12 months of T-12 income?
- It's been on market 83 days. Have you received any prior offers? Is the seller open to a 22% concession, seller financing, or rate buy-down credit?
- Built in 1973 — when were the roof, HVAC, electrical panel, plumbing, and water heater last replaced?
- What does the HOA fee cover, when was the last increase, and are there any pending special assessments or reserve-fund shortfalls?
- Any open or pending special assessments — roof, HVAC, plumbing, elevator, façade? What's the per-unit balance and payoff schedule, and is the seller paying it off at close or rolling it to the buyer?
- Why hasn't it sold? Are there any deal-killer items the seller is aware of (foundation, flood, title, zoning, code violations)?
- Is there a deadline driving the sale (1031 exchange, divorce, estate, relocation)? That informs how much negotiation room exists.
- Schools are D-rated, which usually means shorter tenancies and higher turnover. Who's the typical renter profile here, and what's been the actual vacancy rate?
- The area grade is low — what's the realistic commute time and amenity access for the typical tenant pool here? Any planned neighborhood developments (good or bad) we should know about?
- What's the average days-on-market for RENTAL listings here right now (not sales)? A rising rental-DOM trend means longer vacancies and softer asking-rent achievability than the comps imply.
- What's the recent tenant-quality profile in this submarket — average credit score on applications, eviction rate, late-payment / NSF rate, and stable-employment percentage? A property-management company in the area should have these aggregated.
- How much new apartment / multifamily construction is in the pipeline within 1–3 miles? Heavy new supply (>2% of stock underway) typically softens rents 12–24 months out; light construction supports rent growth.
Investment metrics
- 1% rule
- 1.24% ✓
- Cap rate
- 4.77%
- Cash-on-cash
- -5.42%
- DSCR
- 0.76
- GRM
- 6.7
CMA / ARV
No comps found within radius.
Projected returns pro-forma
-3.0% appreciation · 2.65% rent growth · sell at horizon
- IRR
- -25.8%
- Equity multiple
- 0.13×
- Total profit
- $-30,530
- Equity at exit
- $18,638
- IRR
- -23.1%
- Equity multiple
- -0.15×
- Total profit
- $-40,380
- Equity at exit
- $10,808
Cash invested: $35,000 (down + closing). Projections, not guarantees.
Landlord ↔ Tenant lean methodology
- Overall (STATE)
- 87 Strongly Landlord-Friendly
- State Florida
- 87 Strongly Landlord-Friendly · R+3
- County
- — inherits STATE
- City
- — inherits STATE
ZIP-level market 33573
- Home prices YoY
- -1.2%
- Rents YoY
- 2.6%
- Active inventory
- 602
- Price-to-rent
- 6.7×
Monthly cashflow live
- Estimated rent
- $1,553 high interval (Pro) →
- Mortgage (P&I)
- −$656
- Tax from tax record
- −$79 /mo · $942/yr
- Insurance
- −$52
- HOA
- −$599
- Vacancy / Maint / Mgmt
- −$326
- Net cashflow
- $-158
Break-even live
UW: 25.0% down · 7.5% · 30yr · 1.5% tax · 5.0% vac · 8.0% maint · 8.0% mgmt
Financing live
Cash to close
- Down payment
- $31,250
- Closing costs
- $3,750
- Reserves months
- —
- Total cash needed
- —
Loan-product check · same deal, 3 products live
Conventional
25% down · 7.5% · 30yr
- Down + closing
- —
- Monthly P&I
- —
- Monthly cashflow
- —
- DSCR
- —
- Eligible?
- —
Personal DTI + credit; lowest rate.
DSCR
20% down · 8.5% · 30yr
- Down + closing
- —
- Monthly P&I
- —
- Monthly cashflow
- —
- DSCR
- —
- Eligible?
- —
No personal income docs; deal must DSCR.
Hard money
10% down · 12.0% · 12mo
- Down + closing
- —
- Monthly P&I
- —
- Monthly cashflow
- —
- DSCR
- —
- Eligible?
- —
Short-term bridge; refi at stabilization.
Rent comps 27 comps
| Address | Beds | Baths | Sqft | Rent | $/sqft | DOM | Units | Dist |
|---|---|---|---|---|---|---|---|---|
| 1802 Bedford Ln Sun City Center, FL | 1.0–2.0 | 2.0 | 952 | $1,500 | $1.58 | 10d | 2 | 0.01mi |
| 1802 Bedford Ter #182 Sun City Center, FL | 1.0 | 1.5 | 800 | $1,400 | $1.75 | 17d | 1 | 0.04mi |
| 1802 Bedford Ter #182 Sun City Center, FL | 1.0 | 1.5 | 960 | $1,375 | $1.43 | 21d | 1 | 0.04mi |
| 201 Bedford St #95 Sun City Center, FL | 1.0 | 1.5 | 800 | $1,450 | $1.81 | 14d | 1 | 0.08mi |
| 202 Bedford Trl #99 Sun City Center, FL | 1.0 | 1.0 | 800 | $1,500 | $1.88 | 5d | 1 | 0.12mi |
| 201 Bedford Trl Unit F128 Sun City Center, FL | 2.0 | 2.0 | 960 | $1,275 | $1.33 | 24d | 1 | 0.15mi |
| 306 Fowling Ct Sun City Center, FL | 2.0 | 2.0 | 960 | $1,700 | $1.77 | 24d | 1 | 0.15mi |
| 201 Kings Blvd #19 Sun City Center, FL | 1.0 | 1.5 | 800 | $1,495 | $1.87 | 24d | 1 | 0.17mi |
| 1814 Foxhunt Dr Unit A Sun City Center, FL | 1.0 | 1.5 | 800 | $1,475 | $1.84 | 24d | 1 | 0.18mi |
| 403 Finchley Ct Unit B Sun City Center, FL | 2.0 | 2.0 | 960 | $2,000 | $2.08 | 24d | 1 | 0.21mi |
| 1901 Andover Way #38 Sun City Center, FL | 1.0 | 1.5 | 800 | $1,495 | $1.87 | 24d | 1 | 0.21mi |
| 409 Feltham Trl Unit B Sun City Center, FL | 2.0 | 2.0 | 984 | $1,650 | $1.68 | 24d | 1 | 0.25mi |
| 301 Kings Blvd #138 Sun City Center, FL | 1.0 | 1.5 | 1020 | $1,800 | $1.76 | 21d | 1 | 0.37mi |
| 101 Cambridge Trl Sun City Center, FL | 1.0–2.0 | 1.5–2.0 | 880 | $1,450 | $1.65 | 11d | 1 | 0.44mi |
| 207 Islip Way Sun City Center, FL | 2.0 | 1.5 | 992 | $1,500 | $1.51 | 17d | 1 | 0.48mi |
| 323 Knottwood Ct Sun City Center, FL | 1.0 | 1.0 | 908 | $1,290 | $1.42 | 24d | 1 | 0.54mi |
| 323 Knottwood Ct #1 Sun City Center, FL | 1.0 | 1.0 | 908 | $1,090 | $1.20 | 5d | 1 | 0.54mi |
| 2202 Clubhouse Dr #169 Sun City Center, FL | 2.0 | 2.0 | 984 | $1,450 | $1.47 | 5d | 1 | 0.57mi |
| 2202 Clubhouse Dr #187 Sun City Center, FL | 1.0 | 1.5 | 800 | $1,550 | $1.94 | 24d | 1 | 0.57mi |
| 302 Canton Ct #62 Sun City Center, FL | 1.0 | 1.5 | 800 | $1,575 | $1.97 | 17d | 1 | 0.58mi |
| 1301 Warwick Ct Unit 1301 Sun City Center, FL | 1.0 | 1.0 | 1102 | $1,575 | $1.43 | 24d | 1 | 0.62mi |
| 1902 Dandridge St #12 Sun City Center, FL | 1.0 | 1.5 | 800 | $1,495 | $1.87 | 14d | 1 | 0.71mi |
| 2345 Glenmore Cir Unit 294 Sun City Center, FL | 2.0 | 2.0 | 984 | $1,500 | $1.52 | 24d | 1 | 0.83mi |
| 704 Tremont Greens Ln Unit 107 Sun City Center, FL | 2.0 | 2.0 | 974 | $1,700 | $1.75 | 24d | 1 | 0.83mi |
| 704 Torrey Pines Ave Sun City Center, FL | 2.0 | 1.0 | 981 | $1,700 | $1.73 | 14d | 1 | 1.25mi |
| 704 Torrey Pines Ave Sun City Center, FL | 2.0 | 1.0 | 981 | $1,675 | $1.71 | 24d | 1 | 1.25mi |
| 2124 Hailstone Cir Sun City Center, FL | 2.0 | 2.0 | 1000 | $1,800 | $1.80 | 24d | 1 | 1.44mi |
HOA detail condo
- Monthly dues
- $599 · $7,188/yr
- Likely covers
- landscapingpoolgym
- Assessments
- None detected in remarks — confirm with the listing agent.
Listing history 37 events
-
2026-06-18days on market $125,000 Active 83 DOM
-
2026-06-17days on market $125,000 Active 82 DOM
-
2026-06-16days on market $125,000 Active 81 DOM
-
2026-06-15days on market $125,000 Active 80 DOM
-
2026-06-13days on market $125,000 Active 78 DOM
-
2026-06-13days on market $125,000 Active 77 DOM
-
2026-06-09days on market $125,000 Active 74 DOM
-
2026-06-08days on market $125,000 Active 73 DOM
-
2026-06-07days on market $125,000 Active 72 DOM
-
2026-06-04days on market $125,000 Active 69 DOM
-
2026-06-03days on market $125,000 Active 68 DOM
-
2026-06-02days on market $125,000 Active 67 DOM
-
2026-06-01days on market $125,000 Active 66 DOM
-
2026-05-31days on market $125,000 Active 65 DOM
-
2026-04-16price $1,400
-
2026-03-27$125,000 Active 2017-char remark
Show marketing remark (2017 chars)
One or more photo(s) has been virtually staged. Now available for sale in the highly desirable Kings Point 55+ active adult community, this beautifully maintained 1-bedroom, 1.5-bath condo offers comfortable living, resort-style amenities, and a low-maintenance lifestyle. Perfect for active adults seeking convenience, community, and long-term value in one of the area’s most popular 55+ communities. Step inside to a freshly painted, open-concept living and dining area that flows seamlessly into the kitchen, creating a bright and spacious layout ideal for both everyday living and entertaining. The additional half bathroom for guests adds extra convenience and functionality. The spacious primary bedroom features generous closet space and a private en suite bathroom with a shower/tub combination. Sliding glass doors lead directly from the bedroom to a private screened-in lanai—the perfect place to enjoy your morning coffee, fresh air, and peaceful surroundings. The lanai also includes a washer and dryer, adding everyday convenience right at home. Owning in Kings Point means enjoying a maintenance-free lifestyle with exterior upkeep handled for you, making this property an excellent option for seasonal residents, downsizers, or those seeking easy Florida living. Residents have access to an impressive array of resort-style amenities, including: Multiple swimming pools Fitness centers and wellness facilities Tennis courts and recreational activities Social clubs, events, and community gatherings Beautifully maintained grounds and walking paths This vibrant, active adult community offers countless opportunities to stay social, engaged, and active while enjoying the comfort of a peaceful neighborhood. If you're searching for an affordable 55+ condo for sale with exceptional amenities and a strong sense of community, this Kings Point home is a must-see. Schedule your private showing today and experience the relaxed, resort-style lifestyle that makes Kings Point so desirable!
-
2026-03-10$1,500
-
2025-03-26price $125,000
-
2024-12-17price $130,000
-
2024-11-23price $140,000
-
2024-10-18$150,000 Active
-
2022-10-10soldstatus $124,000
-
2022-10-07soldstatus $124,000 Closed
-
2022-07-22status Pending
-
2022-07-19$120,000 Active
-
2020-09-07historical
-
2020-08-22price $65,000
-
2020-03-07status Active
-
2020-02-27status Pending
-
2020-02-04$70,000 Active
-
2018-03-05soldstatus $47,500
-
2018-03-01soldstatus $47,450 Sold
-
2018-01-15status Pending
-
2017-12-27$50,000 Active
-
2011-01-11soldstatus $18,000
-
1996-12-03soldstatus $27,000
-
1995-09-29soldstatus $17,500
ⓘ Source: listings_history table (triggers on properties + properties_extension) + one-shot
backfill from property_details.listing_events for pre-trigger history.
Tax reassessment forecast FL · Resets to sale price
- Current annual tax
- $942 · $79/mo
- Projected year-2 tax
- $1,038 · $86/mo
- Expected delta
- +$95/yr (+$8/mo · 10.1%)
ⓘ Screening estimate from a state-policy table — verify with the county assessor before closing.
Climate risk First Street
- Flood 1/10 Low FEMA zone X (unshaded) · 0% chance over 30 yrs
- Wildfire 4/10 Moderate
- Heat 10/10 Extreme 7 d/yr ≥109°F today · 28 d/yr by 30 yrs out
- Wind 9/10 Extreme 99% chance of damaging wind over 30 yrs
- Air quality 3/10 Moderate 3 unhealthy d/yr today · 3 by 30 yrs out
Nearby sold comps map
Loading sold comps map…
Walkable amenities ~0.75 mi
Loading nearby amenities…
Taxation est. · year 1
- Rental income
- $18,637
- − Mortgage interest
- −$7,002
- − Property taxes
- −$942
- − Insurance
- −$625
- − Repairs & maintenance
- −$1,491
- − Management
- −$1,491
- − HOA
- −$7,188
- − Depreciation
- −$3,636
- Taxable loss
- −$3,738
- Est. tax savings @ 24.0%
- +$897
- After-tax cash flow
- $-1,001/yr
For passive investors: Depreciation is non-cash, so a rental often shows a tax loss while cash-flowing — sheltering income. Rental losses are passive: they offset passive income freely, and up to $25,000/yr can offset ordinary (W-2) income if you actively participate and your MAGI is under $100k (phasing out to $0 by $150k); unused losses carry forward. On sale, claimed depreciation is recaptured at up to 25%, and gains may owe capital-gains tax (a 1031 exchange can defer both). Figures are a year-1 estimate at your 24.0% rate — not tax advice; consult a CPA.
Schools (NCES district)
- District
- Hillsborough
- NCES district ID
- 1200870
- Math proficiency
- 47% ▼ -8.00%
- Reading proficiency
- 50% ▼ -4.00%
- Median HH income
- $50,622
- Composite
- 41.6/100
- National rank
- #3435
- State rank
- #41 of 73 in FL
Livability — Sun City Center
- Score
- 78/100
- State rank
- #178
- US rank
- #2736
Category grades
Schools grade is shown separately in the Schools card above.
Census & demographics
- Census place
- Sun City Center, FL
- County
- Hillsborough County · 1,540,968 people
- City population
- 35,362
- Metro
- Tampa-St. Petersburg-Clearwater, FL
- Population (ZIP)
- 35,362
- Household income
- $72,834
- Rent vs Own
- Severe rent burden
- 1382.0
Population outlook (Hillsborough County) Hauer SSP2
- Today (2025)
- 1,607,022 people
- By 2030
- 1,733,968 · +7.9%
- By 2040
- 1,979,565 · +23.2%
- By 2050
- 2,203,427 · +37.1%
- By 2075
- 2,667,893 · +66.0%
- By 2100
- 2,891,558 · +79.9%
Race, ethnicity, and origin ACS 2023
- Neighborhood character
- Predominantly White (73%)
- Race & ethnicity
- White 73% Hispanic / Latino 13% Two or more races 11% Black 10% Asian 1%
- Hispanic origin (detail)
- Mexican 1% Puerto Rican 6% Cuban 2%
- Common ancestry
- Romanian 3% Lithuanian 3% Slovak 2%
- Foreign-born
- 8% · Canada, Vietnam
- Languages at home
- 86% English-only · Spanish 10% French/Haitian/Cajun 1% German/W. Germanic 1%
Political lean MEDSL · Hillsborough
- 2024 margin
- Toss-up / Even · D 47.8% · R 50.9% · Other 1.3%
- 2008→2024 swing
- -10.2pp toward R · 2008: 7.1pp · 2024: -3.1pp
- All cycles
- 2024: R+3.1 2020: D+6.9 2016: D+6.8 2012: D+6.7 2008: D+7.1
Not yet ingested
- Civics
- —
Market trends
- HPI YoY
- ▼ -3.27%
- Current HPI
- 272.9767
- Rent YoY
- ▲ 2.65%
- Metro
- Tampa-St. Petersburg-Clearwater, FL
- State GDP YoY
- ▲ 3.28%
- F500 in state
- 36
Industry mix (Fortune 500 HQ in FL)
| Industry | F500 HQs | Revenue |
|---|---|---|
| Industrial Technology | 2 | $29B |
|
||
| Insurance | 2 | $17B |
|
||
| Retail | 1 | $60B |
|
||
| Technology Distribution | 1 | $58B |
|
||
| Homebuilding | 1 | $35B |
|
||
| Technology Manufacturing | 1 | $35B |
|
||
Price history
-92.0% since first listed23 events — show timeline
- 2026-04-16 Price Changed $1,400 STELLARMLS
- 2026-03-27 Listed $125,000 Stellar MLS as Distributed by MLS Grid
- 2026-03-10 Listed for Rent $1,500 STELLARMLS
- 2025-03-26 Price Changed $125,000 Stellar MLS as Distributed by MLS Grid
- 2024-12-17 Price Changed $130,000 Stellar MLS as Distributed by MLS Grid
- 2024-11-23 Price Changed $140,000 Stellar MLS as Distributed by MLS Grid
- 2024-10-18 Listed $150,000 Stellar MLS as Distributed by MLS Grid
- 2022-10-10 Sold (Public Records) $124,000 Public Records
- 2022-10-07 Sold (MLS) $124,000 Stellar MLS as Distributed by MLS Grid
- 2022-07-22 Pending — Stellar MLS as Distributed by MLS Grid
- 2022-07-19 Listed $120,000 Stellar MLS as Distributed by MLS Grid
- 2020-09-07 Listing Removed — Stellar MLS as Distributed by MLS Grid
- 2020-08-22 Price Changed $65,000 Stellar MLS as Distributed by MLS Grid
- 2020-03-07 Relisted — Stellar MLS as Distributed by MLS Grid
- 2020-02-27 Pending — Stellar MLS as Distributed by MLS Grid
- 2020-02-04 Listed $70,000 Stellar MLS as Distributed by MLS Grid
- 2018-03-05 Sold (Public Records) $47,500 Public Records
- 2018-03-01 Sold (MLS) $47,450 Stellar MLS as Distributed by MLS Grid
- 2018-01-15 Pending — Stellar MLS as Distributed by MLS Grid
- 2017-12-27 Listed $50,000 Stellar MLS as Distributed by MLS Grid
- 2011-01-11 Sold (Public Records) $18,000 Public Records
- 1996-12-03 Sold (Public Records) $27,000 Public Records
- 1995-09-29 Sold (Public Records) $17,500 Public Records
Property tax history
+25.9%/yrLatest (2025): $942 · +5.6% YoY. Source: county tax records.
Cash-flow waterfall
monthlySold comps — $/sqft
last 12 mo · ≤1 miLoading sold comps…