 🏷️ Likely Rental
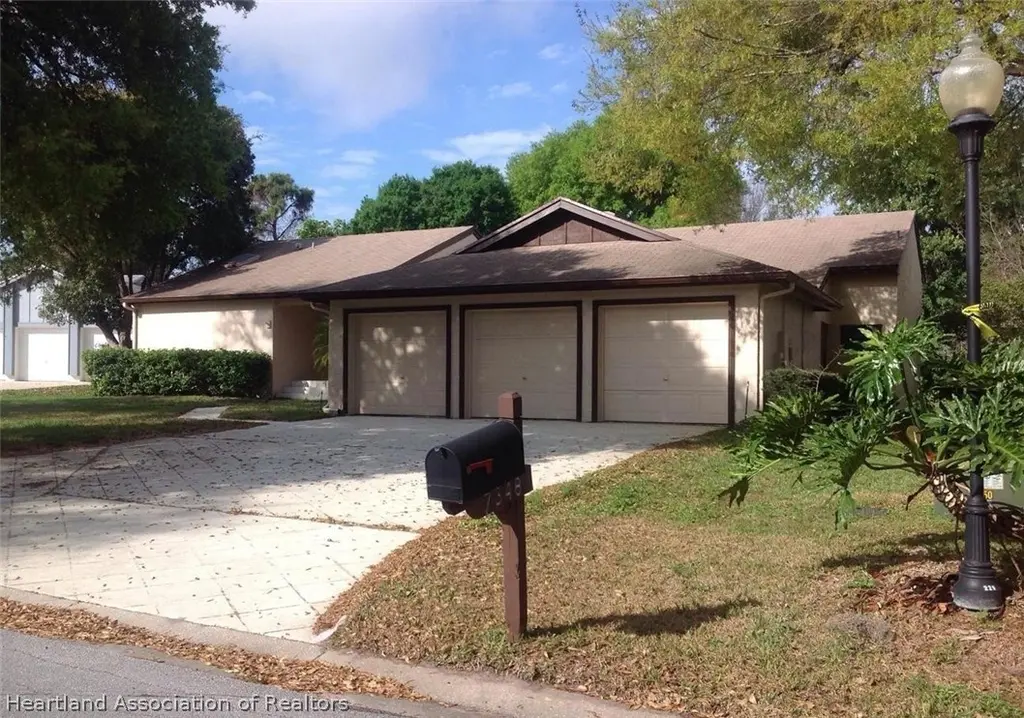
7348 Sparkling Lake Rd · Orlando, FL
Flood risk 1/10 · Minimal
- FEMA flood zone
- X (unshaded)
- Chance of flooding over 30 yrs
- 0.0%
- Est. flood insurance / yr
- $507 – $1,088
Fire risk 1/10 · Minimal
- Est. fire insurance / yr
- $947 – $1,759
Heat risk 9/10 · Severe
- Hot days now (above 108°F)
- 7 days/yr
- Hot days in 30 yrs
- 23 days/yr
Wind risk 9/10 · Severe
- Chance of severe wind over 30 yrs
- 99.0%
Air-quality risk 1/10 · Minimal
- Unhealthy air days now
- 0 days/yr
- Unhealthy air days in 30 yrs
- 0 days/yr
Risk factors via First Street. Map © Google.
Why this score? — see what drove the D+ grade
The composite is a weighted blend of 9 inputs, each scored 0–100. Each bar is that input's sub-score; the figure is the points it added to the 100-point composite (weight × sub-score).
- Cash flow +15.0/30.0
- ARV discount +7.5/15.0
- 1% rule +5.0/10.0
- DSCR +5.0/10.0
- Livability +4.3/5.0
- Schools +4.1/10.0
- Rent growth +2.9/5.0
- Condition / age +2.5/5.0
- Appreciation +0.0/10.0
$5,000
🖨 Deal sheet 📄 Offer letter ✓ Due diligence
Listing remarks MLS
Centrally located in sought after Dr. Phillips, this lovely four bedroom family home has seen extensive upgrades. Beautiful Travertine flooring flows through most of the property which nicely compliments the brand new Granite work tops in the "Bakers Dream" Kitchen. The kitchen comes with brand new appliances including double convection oven and microwave, and has plenty of space for table and chairs in addition to the breakfast bar, a real entertainers space. A great upgraded master bedroom has an updated bathroom suite with Granite surfaces and large walk in closet. The living room and dining area re good sizes and there is a bonus room that could be a number of uses, although does require finishing. Three further bedrooms and two bathrooms are on hand for family or guests. Outside there is a private pool and for parking and storage there is a triple garage!! The community offers numerous amenities including tennis, basketball, swimming pool, gym, and community golf course (at a cost) and the A rated Dr Phillips Elementary School is just a short distance away. Don't miss this great family home, book your showing now.
Key facts
- 0.31 acre lot
- 3 garage spots
- Pool
Property features AI
Exterior
- Parking: Detached garage with 3 parking spaces (3 garage spaces total)
- Utilities: Other water source; Other sewer
- Home design: Single-family residence; One level; Residential property; Planned Development (P-D) zoning
- Construction: Construction materials: see remarks; Other roof
- Exterior features: Front porch; In-ground pool
Interior
- Bedrooms: 1 room total
- Flooring: Other flooring
- Bathrooms: 3 full bathrooms
- Heating & cooling: No heating; No cooling
- Interior features: Other flooring
Neighborhood map
What this means for you Summary
Snapshot
- This is a 4-bed/3.0-bath single-family listed at $5k.
Deal economics
- At list price, monthly cash flow is $3k ($34k/yr) — positive.
- The deal already cash-flows at list — no discount required.
- Meets the 1% rule at list price ($4k rent vs $5k).
- Cap rate 676.3% vs local median 3.0% in Orlando — top-decile yield for the area; either an underpriced asset or a hidden risk that comps aren't pricing in. Stress-test before assuming the spread holds.
Location & tenants
- Location reads 86/100 on livability (#12 in FL, #360 nationally) — a professional / high-income tenant draw. Strengths: amenities A+, commute A+, housing A+.
- Orange (suburban): math 46% / reading 51% proficiency, ranked #43 of 73 in FL (top 59%) — families likely to look elsewhere, expect single-tenant / working-renter base with shorter leases.
- Market conditions: Rents rising (+1.7%/yr); 318 active listings in the ZIP; 19 comparable units currently listed for rent nearby; rentals at typical pace (median 22d on market — plan ~3-4 weeks tenant-placement turnaround); solid renter incomes; 8,053 units permitted in Orange County in 2024 (3,133 in 5+ unit buildings).
- This rent runs 44% of the median local income ($98k/yr) — at the standard rent-burdened threshold; future hikes will face affordability resistance.
Forward outlook
- Local home prices are declining (-3.0%/yr); year-one equity from $35 of loan paydown is wiped out by about $150 of value loss. Plan a longer hold.
- Orange County population projected at +52% by 2050 — long-run rental-demand tailwind backs the buy-and-hold thesis.
- At projected returns (-3.0% appreciation + 1.7% rent growth), your $1k cash investment doubles in ~1 year — after that, you're playing with house money.
Negotiation context
- Only 8 days on market — expect competitive offers; lowballing is unlikely to land.
- 5 sale attempts since 21y ago with the ask held roughly flat each time — persistent listings suggest the price (not the market) is what's stuck; bring a comps-based counter.
Risks & watch-outs
- Climate carrying-cost: severe wind risk, 99% chance of damaging wind over 30y; extreme-heat days projected 7→23/yr by 2055 (HVAC capex compounding) — expect insurance premiums to compound above CPI over the hold.
Questions for the listing agent
- Is there a deadline driving the sale (1031 exchange, divorce, estate, relocation)? That informs how much negotiation room exists.
- Schools are B-rated — typically a magnet for longer-tenancy family renters. What's the average tenant stay here, and is there a school-zone premium baked into asking?
- The area grade is low — what's the realistic commute time and amenity access for the typical tenant pool here? Any planned neighborhood developments (good or bad) we should know about?
- What's the average days-on-market for RENTAL listings here right now (not sales)? A rising rental-DOM trend means longer vacancies and softer asking-rent achievability than the comps imply.
- What's the recent tenant-quality profile in this submarket — average credit score on applications, eviction rate, late-payment / NSF rate, and stable-employment percentage? A property-management company in the area should have these aggregated.
- How much new for-sale + rental construction is in the pipeline within 1–3 miles? Heavy new supply typically softens prices + rents 12–24 months out; constrained supply supports both.
Investment metrics
- 1% rule
- 71.55% ✓
- Cap rate
- 676.31%
- Cash-on-cash
- 2392.91%
- DSCR
- 107.47
- GRM
- 0.1
CMA / ARV
- ARV (on-the-fly)
- $781,167
- Comps found
- 6
Show comp detail 6 sales within ~0.75 mi
| Address | Dist | Beds/Ba | Sqft | Sold | Price | $/sf | Match |
|---|---|---|---|---|---|---|---|
| 7409 Megan Elissa Ln | 0.06mi | 4/3.0 | 2,362 (-13%) | 1mo | $641,000 | $271 | 75 |
| 7628 Apple Tree Cir | 0.28mi | 4/2.5 | 2,505 (-7%) | 5mo | $725,000 | $289 | 69 |
| 7733 Apple Tree Cir | 0.46mi | 5/3.0 (+1) | 2,649 (-2%) | 2mo | $875,000 | $330 | 69 |
| 7713 Hidden Ivy Ct | 0.43mi | 4/3.0 | 2,818 (+4%) | 15mo | $815,000 | $289 | 61 |
| 6032 Crystal View Dr | 0.43mi | 5/3.0 (+1) | 2,532 (-6%) | 8mo | $675,000 | $267 | 58 |
| 8053 Sandberry Blvd | 0.67mi | 4/2.5 | 2,481 (-8%) | 7mo | $557,500 | $225 | 47 |
Match score weights: distance 35% · size 25% · config 20% · recency 20%. Top-matched comps best support the ARV.
Projected returns pro-forma
-3.0% appreciation · 1.72% rent growth · sell at horizon
- IRR
- —
- Equity multiple
- 124.21×
- Total profit
- $172,500
- Equity at exit
- $746
- IRR
- —
- Equity multiple
- 258.99×
- Total profit
- $361,189
- Equity at exit
- $432
Cash invested: $1,400 (down + closing). Projections, not guarantees.
Landlord ↔ Tenant lean methodology
- Overall (STATE)
- 87 Strongly Landlord-Friendly
- State Florida
- 87 Strongly Landlord-Friendly · R+3
- County
- — inherits STATE
- City
- — inherits STATE
ZIP-level market 32819
- Rents YoY
- 1.7%
- Active inventory
- 318
- Price-to-rent
- 0.1×
Monthly cashflow live
- Estimated rent
- $3,578 high interval (Pro) →
- Mortgage (P&I)
- −$26
- Tax est. 1.5%
- −$6 /mo · $75/yr
- Insurance
- −$2
- HOA
- −$0
- Vacancy / Maint / Mgmt
- −$751
- Net cashflow
- $2,792
Break-even live
UW: 25.0% down · 7.5% · 30yr · 1.5% tax · 5.0% vac · 8.0% maint · 8.0% mgmt
Financing live
Cash to close
- Down payment
- $1,250
- Closing costs
- $150
- Reserves months
- —
- Total cash needed
- —
Loan-product check · same deal, 3 products live
Conventional
25% down · 7.5% · 30yr
- Down + closing
- —
- Monthly P&I
- —
- Monthly cashflow
- —
- DSCR
- —
- Eligible?
- —
Personal DTI + credit; lowest rate.
DSCR
20% down · 8.5% · 30yr
- Down + closing
- —
- Monthly P&I
- —
- Monthly cashflow
- —
- DSCR
- —
- Eligible?
- —
No personal income docs; deal must DSCR.
Hard money
10% down · 12.0% · 12mo
- Down + closing
- —
- Monthly P&I
- —
- Monthly cashflow
- —
- DSCR
- —
- Eligible?
- —
Short-term bridge; refi at stabilization.
Rent comps 19 comps
| Address | Beds | Baths | Sqft | Rent | $/sqft | DOM | Units | Dist |
|---|---|---|---|---|---|---|---|---|
| 6135 Crystal View Dr Orlando, FL | 4.0 | 3.0 | 2449 | $4,350 | $1.78 | 15d | 1 | 0.36mi |
| 7200 Grace Rd Orlando, FL | 4.0 | 3.5 | 2000 | $2,980 | $1.49 | 18d | 1 | 0.56mi |
| 6747 Edgeworth Dr Orlando, FL | 3.0 | 2.5 | 2200 | $4,500 | $2.05 | 8d | 1 | 0.56mi |
| 6434 Rockingtree Ln Orlando, FL | 3.0 | 2.0 | 1788 | $2,600 | $1.45 | 4d | 1 | 0.58mi |
| 5514 Turkey Lake Rd Orlando, FL | 4.0 | 2.0 | 1783 | $2,995 | $1.68 | 24d | 1 | 0.79mi |
| 6984 Brescia Way Orlando, FL | 4.0 | 2.5 | 2822 | $4,000 | $1.42 | 24d | 1 | 0.87mi |
| 8026 Rural Retreat Ct Orlando, FL | 4.0 | 3.0 | 2378 | $4,500 | $1.89 | 22d | 1 | 0.88mi |
| 6935 Brescia Way Orlando, FL | 5.0 | 3.0 | 2922 | $4,000 | $1.37 | 24d | 1 | 0.91mi |
| 6931 Lucca St Orlando, FL | 4.0 | 2.5 | 2665 | $3,400 | $1.28 | 24d | 1 | 0.92mi |
| 5614 Craindale Dr Orlando, FL | 4.0 | 3.0 | 2739 | $3,799 | $1.39 | 22d | 1 | 0.93mi |
| 6833 Dolce St Orlando, FL | 4.0 | 3.5 | 2824 | $3,800 | $1.35 | 24d | 1 | 1.01mi |
| 6792 Tamarind Cir Orlando, FL | 5.0 | 3.0 | 2256 | $2,900 | $1.29 | 22d | 1 | 1.04mi |
| 7181 Regina Way Orlando, FL | 3.0 | 2.5 | 2230 | $3,175 | $1.42 | 24d | 1 | 1.06mi |
| 7118 Regina Way Orlando, FL | 3.0 | 2.5 | 2104 | $2,990 | $1.42 | 24d | 1 | 1.07mi |
| 6874 Sorrento St Orlando, FL | 3.0 | 2.5 | 2468 | $2,875 | $1.16 | 24d | 1 | 1.10mi |
| 7532 Toscana Blvd #534 Orlando, FL | 3.0 | 2.0 | 2085 | $2,950 | $1.41 | 10d | 1 | 1.22mi |
| 7588 Toscana Blvd #443 Orlando, FL | 3.0 | 2.0 | 2003 | $2,850 | $1.42 | 24d | 1 | 1.25mi |
| 8629 Great Cove Dr Orlando, FL | 5.0 | 4.0 | 3469 | $5,500 | $1.59 | 18d | 1 | 1.32mi |
| 4855 Spring Run Ave Orlando, FL | 4.0 | 2.5 | 2481 | $3,450 | $1.39 | 8d | 1 | 1.37mi |
Listing history 7 events
-
2026-06-09days on market $5,000 Active 8 DOM
-
2026-06-08days on market $5,000 Active 7 DOM
-
2026-06-07days on market $5,000 Active 6 DOM
-
2026-06-04days on market $5,000 Active 3 DOM
-
2026-06-03days on market $5,000 Active 2 DOM
-
2026-06-02remarks 294-char remark
-
2026-06-02$5,000 Active 1 DOM
ⓘ Source: listings_history table (triggers on properties + properties_extension) + one-shot
backfill from property_details.listing_events for pre-trigger history.
Climate risk First Street
- Flood 1/10 Low FEMA zone X (unshaded) · 0% chance over 30 yrs
- Wildfire 1/10 Low
- Heat 9/10 Extreme 7 d/yr ≥108°F today · 23 d/yr by 30 yrs out
- Wind 9/10 Extreme 99% chance of damaging wind over 30 yrs
- Air quality 1/10 Low 0 unhealthy d/yr today · 0 by 30 yrs out
Nearby sold comps map
Loading sold comps map…
Walkable amenities ~0.75 mi
Loading nearby amenities…
Taxation est. · year 1
- Rental income
- $42,931
- − Mortgage interest
- −$280
- − Property taxes
- −$75
- − Insurance
- −$25
- − Repairs & maintenance
- −$3,434
- − Management
- −$3,434
- − Depreciation
- −$145
- Taxable income
- $35,536
- Est. tax owed @ 24.0%
- −$8,529
- After-tax cash flow
- $24,972/yr
For passive investors: Depreciation is non-cash, so a rental often shows a tax loss while cash-flowing — sheltering income. Rental losses are passive: they offset passive income freely, and up to $25,000/yr can offset ordinary (W-2) income if you actively participate and your MAGI is under $100k (phasing out to $0 by $150k); unused losses carry forward. On sale, claimed depreciation is recaptured at up to 25%, and gains may owe capital-gains tax (a 1031 exchange can defer both). Figures are a year-1 estimate at your 24.0% rate — not tax advice; consult a CPA.
Schools (NCES district)
- District
- Orange
- NCES district ID
- 1201440
- Math proficiency
- 46% ▼ -9.00%
- Reading proficiency
- 51% ▼ -2.00%
- Median HH income
- $49,350
- Composite
- 41.47/100
- National rank
- #3461
- State rank
- #43 of 73 in FL
Livability — Orlando
- Score
- 86/100
- State rank
- #12
- US rank
- #360
Category grades
Schools grade is shown separately in the Schools card above.
Census & demographics
- County
- Orange County · 1,471,359 people
- City population
- 964,969
- Metro
- Orlando-Kissimmee-Sanford, FL
- Population (ZIP)
- 30,213
- Household income
- $98,109
- Rent vs Own
- Severe rent burden
- 930.0
Population outlook (Orange County) Hauer SSP2
- Today (2025)
- 1,618,226 people
- By 2030
- 1,787,404 · +10.5%
- By 2040
- 2,125,621 · +31.4%
- By 2050
- 2,454,016 · +51.6%
- By 2075
- 3,173,711 · +96.1%
- By 2100
- 3,607,781 · +122.9%
Race, ethnicity, and origin ACS 2023
- Neighborhood character
- Diverse neighborhood (Simpson 0.68)
- Race & ethnicity
- White 51% Hispanic / Latino 20% Two or more races 17% Black 12% Asian 8%
- Hispanic origin (detail)
- Mexican 2% Puerto Rican 6% Cuban 4% Dominican 2%
- Common ancestry
- Estonian 4% Romanian 3% Lithuanian 2%
- Foreign-born
- 27% · Canada, China, Jamaica
- Languages at home
- 65% English-only · Spanish 17% Other Indo-European 9% French/Haitian/Cajun 2%
Political lean MEDSL · Orange
- 2024 margin
- D (+13.6) · D 56.1% · R 42.5% · Other 1.3%
- 2008→2024 swing
- -5.0pp toward R · 2008: 18.6pp · 2024: 13.6pp
- All cycles
- 2024: D+13.6 2020: D+23.1 2016: D+24.6 2012: D+18.2 2008: D+18.6
Not yet ingested
- Civics
- —
Market trends
- HPI YoY
- ▼ -265.00%
- Current HPI
- 285.9384
- Rent YoY
- ▲ 1.72%
- Metro
- Orlando-Kissimmee-Sanford, FL
- State GDP YoY
- ▲ 3.28%
- F500 in state
- 36
Industry mix (Fortune 500 HQ in FL)
| Industry | F500 HQs | Revenue |
|---|---|---|
| Industrial Technology | 2 | $29B |
|
||
| Insurance | 2 | $17B |
|
||
| Retail | 1 | $60B |
|
||
| Technology Distribution | 1 | $58B |
|
||
| Homebuilding | 1 | $35B |
|
||
| Technology Manufacturing | 1 | $35B |
|
||
Price history
-96.2% since first listed19 events — show timeline
- 2026-06-01 Listed $5,000 HAOR as distributed by MLS GRID
- 2019-02-25 Sold (Public Records) $390,000 Public Records
- 2019-02-22 Sold (MLS) $390,000 Stellar MLS as Distributed by MLS Grid
- 2019-02-14 Pending — Stellar MLS as Distributed by MLS Grid
- 2019-01-07 Price Changed $409,900 Stellar MLS as Distributed by MLS Grid
- 2018-12-11 Price Changed $419,900 Stellar MLS as Distributed by MLS Grid
- 2018-10-22 Price Changed $425,000 Stellar MLS as Distributed by MLS Grid
- 2018-08-31 Price Changed $429,900 Stellar MLS as Distributed by MLS Grid
- 2018-08-17 Relisted — Stellar MLS as Distributed by MLS Grid
- 2018-08-12 Pending — Stellar MLS as Distributed by MLS Grid
- 2018-08-04 Price Changed $439,000 Stellar MLS as Distributed by MLS Grid
- 2018-07-28 Price Changed $449,000 Stellar MLS as Distributed by MLS Grid
- 2018-07-20 Listed $459,000 Stellar MLS as Distributed by MLS Grid
- 2013-11-26 Sold (MLS) $238,875 Stellar MLS as Distributed by MLS Grid
- 2013-09-16 Listed $260,590 Stellar MLS as Distributed by MLS Grid
- 2005-06-16 Sold (Public Records) $368,000 Public Records
- 2005-02-28 Sold (MLS) $368,000 Stellar MLS as Distributed by MLS Grid
- 2005-01-06 Listed $383,900 Stellar MLS as Distributed by MLS Grid
- 1987-12-01 Sold (Public Records) $133,000 Public Records
Property tax history
+3.2%/yrLatest (2025): $6,045 · +4.6% YoY. Source: county tax records.
Cash-flow waterfall
monthlySold comps — $/sqft
last 12 mo · ≤1 miLoading sold comps…