 Triplex
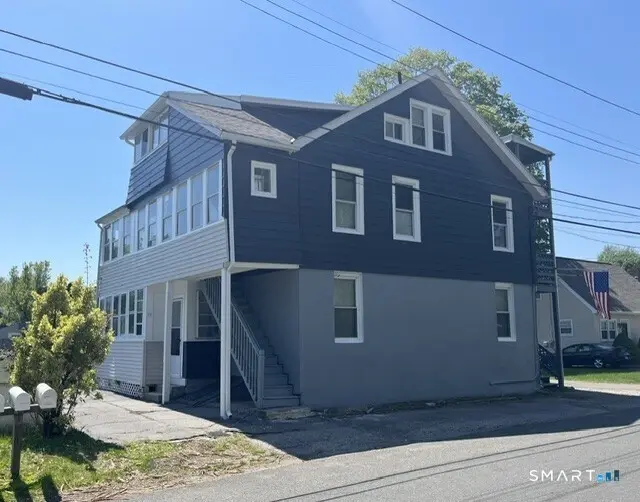
21 Gordon Ave · Shelton, CT
Flood risk 1/10 · Minimal
- FEMA flood zone
- X (unshaded)
- Chance of flooding over 30 yrs
- 0.0%
- Est. flood insurance / yr
- $473 – $860
Fire risk 1/10 · Minimal
- Est. fire insurance / yr
- $829 – $1,539
Heat risk 6/10 · Moderate
- Hot days now (above 98°F)
- 7 days/yr
- Hot days in 30 yrs
- 17 days/yr
Wind risk 6/10 · Moderate
- Chance of severe wind over 30 yrs
- 41.0%
Air-quality risk 4/10 · Minor
- Unhealthy air days now
- 4 days/yr
- Unhealthy air days in 30 yrs
- 6 days/yr
Risk factors via First Street. Map © Google.
Why this score? — see what drove the C grade
The composite is a weighted blend of 9 inputs, each scored 0–100. Each bar is that input's sub-score; the figure is the points it added to the 100-point composite (weight × sub-score).
- Cash flow +28.6/30.0
- DSCR +10.0/10.0
- 1% rule +6.9/10.0
- Schools +4.9/10.0
- Livability +3.9/5.0
- Rent growth +3.1/5.0
- Condition / age +2.5/5.0
- ARV discount +0.0/15.0
- Appreciation +0.0/10.0
$700,000
🖨 Deal sheet 📄 Offer letter ✓ Due diligence
Multi-family units
County records classify this as Multi-Family (2-4 Unit). Listing-text estimate: 3 units. confirmed
Listing remarks MLS
Builders And Investors Take Note! Income Producing 3 Famil Y In Desirable Location Off Route 110 (River Rd). Large Level Yard W/Detached 2 Car Garage. House Needs Work. Ready For Quick Sale.
Key facts
- Newer roof
- 0.23 acre lot
- 2 garage spots
Tags
Property features AI
Finance
- Other: Three total residential units
Exterior
- Parking: Detached garage; Driveway parking; Total of 4 parking spaces; 2-car garage capacity
- Utilities: Public water connected; Septic sewer; Propane fuel with above-ground tank; Electric hot water
- Home design: Multi-family property (3-family); Frame construction; Grey exterior
- Construction: Asphalt shingle roof; Aluminum and stucco siding; Block and concrete foundation
- Exterior features: Porch; Level lot; Paved driveway
Interior
- Bedrooms: 5 bedrooms
- Bathrooms: 3 full bathrooms
- Heating & cooling: Baseboard heating (propane fuel); 30-gallon electric hot water tank
- Interior features: 14 total rooms; Partial, unfinished basement with concrete floor and hatchway access; Attic with hatch access
- Laundry & utility: Basement laundry hook-ups; Second unit with in-unit laundry hook-up
Neighborhood map
What this means for you Summary
Snapshot
- This is a 3 × 5-bed/3.0-bath units multifamily listed at $700k.
Deal economics
- At list price, monthly cash flow is $2k ($28k/yr) — positive. Per door: $767/mo.
- The deal already cash-flows at list — no discount required.
- Meets the 1% rule at list price ($8k rent vs $700k).
- Recommended offer: $679k (3.0% below list) — sets the bar for market timing.
- Cap rate 10.2% vs local median 3.1% in Shelton — top-decile yield for the area; either an underpriced asset or a hidden risk that comps aren't pricing in. Stress-test before assuming the spread holds.
Location & tenants
- Location reads 78/100 on livability (#36 in CT, #2,479 nationally) — a middle-class / working-renter tenant base. Strengths: crime A+, employment A+, housing A+; Watch: amenities F, commute F, cost of living F.
- Shelton School District (suburban): math 46% / reading 62% proficiency, ranked #64 of 153 in CT (top 42%) — acceptable for families but not a draw, mixed tenant base, ~2y average lease; only 15% free/reduced lunch — higher-income household profile.
- Zoned schools: Sunnyside School (math 47% / reading 57%, grade C-, #213 of 553 statewide, top 41%, 236 students, 49% FRL); Shelton High School (math 46% / reading 69%, grade C, #51 of 194 statewide, top 26%, 1,270 students, 30% FRL) — zoned schools average 39% FRL vs 15% district-wide (24 pts higher); higher-poverty schools than district average — tighter screening recommended.
- Market conditions: Rents rising (+2.5%/yr); 143 active listings in the ZIP; 1 comparable units currently listed for rent nearby; solid renter incomes; 502 units permitted in Naugatuck Valley Planning Region in 2024 (171 in 5+ unit buildings).
- At $8,331/mo this rent would consume 92% of the median local household income ($108k/yr) (locally 874% of renters already pay >50% of income on rent) — very limited rent-growth headroom before tenants either downsize or default.
Forward outlook
- Local home prices are declining (-3.0%/yr); year-one equity from $5k of loan paydown is wiped out by about $21k of value loss. Plan a longer hold.
- At projected returns (-3.0% appreciation + 2.5% rent growth), your $196k cash investment doubles in ~9 years — after that, you're playing with house money.
Negotiation context
- It's been on market 42 days — a 3% lower offer ($679k) is reasonable based on typical stale-listing flexibility.
- 3 sale attempts since 30y ago with the ask held roughly flat each time — persistent listings suggest the price (not the market) is what's stuck; bring a comps-based counter.
- Current owner paid $138k; list at $700k implies a 409% gain — meaningful room to come down on a strong offer.
Risks & watch-outs
- Watch-outs: built in 1917 — expect roof / HVAC / electrical / plumbing capex.
- Climate carrying-cost: major wind risk, 41% chance of damaging wind over 30y; extreme-heat days projected 7→17/yr by 2055 (HVAC capex compounding) — expect insurance premiums to compound above CPI over the hold.
Questions for the listing agent
- It's been on market 42 days. Have you received any prior offers? Is the seller open to a 3% concession, seller financing, or rate buy-down credit?
- Can we see the unit-by-unit rent roll, current vacancy, and any below-market leases? What's the average tenancy length?
- What capital expenditures (roof, boiler, parking lot, exteriors) have been made in the last 5 years, and what's planned in the next 2?
- Built in 1917 — when were the roof, HVAC, electrical panel, plumbing, and water heater last replaced?
- Is there a deadline driving the sale (1031 exchange, divorce, estate, relocation)? That informs how much negotiation room exists.
- Schools are A-rated — typically a magnet for longer-tenancy family renters. What's the average tenant stay here, and is there a school-zone premium baked into asking?
- What's the average days-on-market for RENTAL listings here right now (not sales)? A rising rental-DOM trend means longer vacancies and softer asking-rent achievability than the comps imply.
- What's the recent tenant-quality profile in this submarket — average credit score on applications, eviction rate, late-payment / NSF rate, and stable-employment percentage? A property-management company in the area should have these aggregated.
- How much new apartment / multifamily construction is in the pipeline within 1–3 miles? Heavy new supply (>2% of stock underway) typically softens rents 12–24 months out; light construction supports rent growth.
Investment metrics
- 1% rule
- 1.19% ✓
- Cap rate
- 10.24%
- Cash-on-cash
- 14.10%
- DSCR
- 1.63
- GRM
- 7.0
CMA / ARV
- ARV (median comp)
- $501,071
- List price
- $700,000
- Delta
- 39.70%
- Verdict
- OVERPRICED
- Comps
- 3 within 1.0 mi
Show comp detail 1 sale within ~0.75 mi
| Address | Dist | Beds/Ba | Sqft | Sold | Price | $/sf | Match |
|---|---|---|---|---|---|---|---|
| 72 Victory St | 0.50mi | 7/3.0 (+1) | 2,404 (+6%) | 13mo | $425,000 | $177 | 49 |
Match score weights: distance 35% · size 25% · config 20% · recency 20%. Top-matched comps best support the ARV.
Projected returns pro-forma
-3.0% appreciation · 2.45% rent growth · sell at horizon
- IRR
- 3.8%
- Equity multiple
- 1.14×
- Total profit
- $28,395
- Equity at exit
- $104,372
- IRR
- 12.8%
- Equity multiple
- 1.99×
- Total profit
- $194,042
- Equity at exit
- $60,523
Cash invested: $196,000 (down + closing). Projections, not guarantees.
Landlord ↔ Tenant lean methodology
- Overall (STATE)
- 27 Tenant-Leaning
- State Connecticut
- 27 Tenant-Leaning · D+7
- County
- — inherits STATE
- City
- — inherits STATE
ZIP-level market 06484
- Rents YoY
- 2.5%
- Active inventory
- 143
- Price-to-rent
- 21.0×
Monthly cashflow live
- Estimated rent
- $8,331 medium interval (Pro) →
- Mortgage (P&I)
- −$3,671
- Tax from tax record
- −$317 /mo · $3,801/yr
- Insurance
- −$292
- HOA
- −$0
- Vacancy / Maint / Mgmt
- −$1,750
- Net cashflow
- $2,302
Break-even live
3-unit breakdown (identical units grouped — click to expand)
| Units | Beds | Baths | Est. rent |
|---|---|---|---|
| 3× units | 5 | 3 | $8,331 |
| #1 | 5 | 3 | $2,777 |
| #2 | 5 | 3 | $2,777 |
| #3 | 5 | 3 | $2,777 |
| Total (3 units) | $8,331 | ||
UW: 25.0% down · 7.5% · 30yr · 1.5% tax · 5.0% vac · 8.0% maint · 8.0% mgmt
Financing live
Cash to close
- Down payment
- $175,000
- Closing costs
- $21,000
- Reserves months
- —
- Total cash needed
- —
Loan-product check · same deal, 3 products live
Conventional
25% down · 7.5% · 30yr
- Down + closing
- —
- Monthly P&I
- —
- Monthly cashflow
- —
- DSCR
- —
- Eligible?
- —
Personal DTI + credit; lowest rate.
DSCR
20% down · 8.5% · 30yr
- Down + closing
- —
- Monthly P&I
- —
- Monthly cashflow
- —
- DSCR
- —
- Eligible?
- —
No personal income docs; deal must DSCR.
Hard money
10% down · 12.0% · 12mo
- Down + closing
- —
- Monthly P&I
- —
- Monthly cashflow
- —
- DSCR
- —
- Eligible?
- —
Short-term bridge; refi at stabilization.
Rent comps 1 comps
| Address | Beds | Baths | Sqft | Rent | $/sqft | DOM | Units | Dist |
|---|---|---|---|---|---|---|---|---|
| 832 Quarter Mile Rd Orange, CT | 5.0 | 3.5 | 2148 | $5,000 | $2.33 | 10d | 1 | 0.59mi |
Listing history 19 events
-
2026-06-18days on market $700,000 Active 42 DOM
-
2026-06-17days on market $700,000 Active 41 DOM
-
2026-06-16days on market $700,000 Active 40 DOM
-
2026-06-15days on market $700,000 Active 39 DOM
-
2026-06-13days on market $700,000 Active 37 DOM
-
2026-06-10days on market $700,000 Active 34 DOM
-
2026-06-09days on market $700,000 Active 33 DOM
-
2026-06-08days on market $700,000 Active 32 DOM
-
2026-06-07days on market $700,000 Active 31 DOM
-
2026-06-03days on market $700,000 Active 27 DOM
-
2026-06-03days on market $700,000 Active 26 DOM
-
2026-06-01days on market $700,000 Active 25 DOM
-
2026-05-31days on market $700,000 Active 24 DOM
-
2026-05-07$700,000 Active 532-char remark
-
2010-11-19soldstatus $137,500 190-char remark
Show marketing remark (190 chars)
Builders And Investors Take Note! Income Producing 3 Famil Y In Desirable Location Off Route 110 (River Rd). Large Level Yard W/Detached 2 Car Garage. House Needs Work. Ready For Quick Sale.
-
2010-10-06$169,900 190-char remark
Show marketing remark (190 chars)
Builders And Investors Take Note! Income Producing 3 Famil Y In Desirable Location Off Route 110 (River Rd). Large Level Yard W/Detached 2 Car Garage. House Needs Work. Ready For Quick Sale.
-
1998-05-18soldstatus $350,000
-
1996-07-24soldstatus $108,000
-
1996-02-25$124,900
ⓘ Source: listings_history table (triggers on properties + properties_extension) + one-shot
backfill from property_details.listing_events for pre-trigger history.
Tax reassessment forecast CT · Partial reset (capped growth)
- Current annual tax
- $3,801 · $317/mo
- Projected year-2 tax
- $9,390 · $783/mo
- Expected delta
- +$5,590/yr (+$466/mo · 147.1%)
ⓘ Screening estimate from a state-policy table — verify with the county assessor before closing.
Climate risk First Street
- Flood 1/10 Low FEMA zone X (unshaded) · 0% chance over 30 yrs
- Wildfire 1/10 Low
- Heat 6/10 Major 7 d/yr ≥98°F today · 17 d/yr by 30 yrs out
- Wind 6/10 Major 41% chance of damaging wind over 30 yrs
- Air quality 4/10 Moderate 4 unhealthy d/yr today · 6 by 30 yrs out
Nearby sold comps map
Loading sold comps map…
Walkable amenities ~0.75 mi
Loading nearby amenities…
Taxation est. · year 1
- Rental income
- $99,972
- − Mortgage interest
- −$39,211
- − Property taxes
- −$3,801
- − Insurance
- −$3,500
- − Repairs & maintenance
- −$7,998
- − Management
- −$7,998
- − Depreciation
- −$20,364
- Taxable income
- $17,101
- Est. tax owed @ 24.0%
- −$4,104
- After-tax cash flow
- $23,522/yr
For passive investors: Depreciation is non-cash, so a rental often shows a tax loss while cash-flowing — sheltering income. Rental losses are passive: they offset passive income freely, and up to $25,000/yr can offset ordinary (W-2) income if you actively participate and your MAGI is under $100k (phasing out to $0 by $150k); unused losses carry forward. On sale, claimed depreciation is recaptured at up to 25%, and gains may owe capital-gains tax (a 1031 exchange can defer both). Figures are a year-1 estimate at your 24.0% rate — not tax advice; consult a CPA.
Schools (NCES district)
- District
- Shelton School District
- NCES district ID
- 0904050
- Math proficiency
- 46% ▼ -14.00%
- Reading proficiency
- 62% ▼ -9.00%
- Median HH income
- $84,866
- Composite
- 49.37/100
- National rank
- #2016
- State rank
- #64 of 153 in CT
Livability — Shelton
- Score
- 78/100
- State rank
- #36
- US rank
- #2479
Category grades
Schools grade is shown separately in the Schools card above.
Census & demographics
- Census place
- Shelton, CT
- County
- Fairfield County · 765,532 people
- City population
- 41,889
- Metro
- Bridgeport-Stamford-Norwalk, CT
- Population (ZIP)
- 41,889
- Household income
- $108,185
- Rent vs Own
- Severe rent burden
- 874.0
Population outlook (Naugatuck Valley County) Hauer SSP2
- By 2040
- 496,846
Race, ethnicity, and origin ACS 2023
- Neighborhood character
- Predominantly White (69%)
- Race & ethnicity
- White 69% Hispanic / Latino 12% Asian 9% Two or more races 8% Black 6%
- Hispanic origin (detail)
- Puerto Rican 6%
- Common ancestry
- Romanian 8% Russian 3% Scotch-Irish 2%
- Foreign-born
- 17% · Canada, China
- Languages at home
- 78% English-only · Other Indo-European 8% Spanish 6% French/Haitian/Cajun 2%
Political lean MEDSL · Naugatuck Valley
- 2024 margin
- Lean R (+7.4) · D 45.6% · R 53.0% · Other 1.4%
- All cycles
- 2024: R+7.4
Not yet ingested
- Civics
- —
Market trends
- HPI YoY
- ▼ -376.90%
- Current HPI
- 247.639
- Rent YoY
- ▲ 2.45%
- Metro
- Bridgeport-Stamford-Norwalk, CT
- State GDP YoY
- ▲ 1.06%
- F500 in state
- 38
Industry mix (Fortune 500 HQ in CT)
| Industry | F500 HQs | Revenue |
|---|---|---|
| Industrial Machinery | 4 | $38B |
|
||
| Insurance | 3 | $71B |
|
||
| Financial Services | 2 | $25B |
|
||
| Transportation / Logistics | 2 | $18B |
|
||
| Healthcare | 1 | $247B |
|
||
| Telecommunications | 1 | $55B |
|
||
Price history
+460.4% since first listed6 events — show timeline
- 2026-05-07 Listed $700,000 Smart MLS
- 2010-11-19 Sold (MLS) $137,500 Smart MLS
- 2010-10-06 Listed $169,900 Smart MLS
- 1998-05-18 Sold (Public Records) $350,000 Public Records
- 1996-07-24 Sold (MLS) $108,000 Smart MLS
- 1996-02-25 Listed $124,900 Smart MLS
Property tax history
-0.7%/yrLatest (2023): $3,801 · +0.0% YoY. Source: county tax records.
Cash-flow waterfall
monthlySold comps — $/sqft
last 12 mo · ≤1 miLoading sold comps…