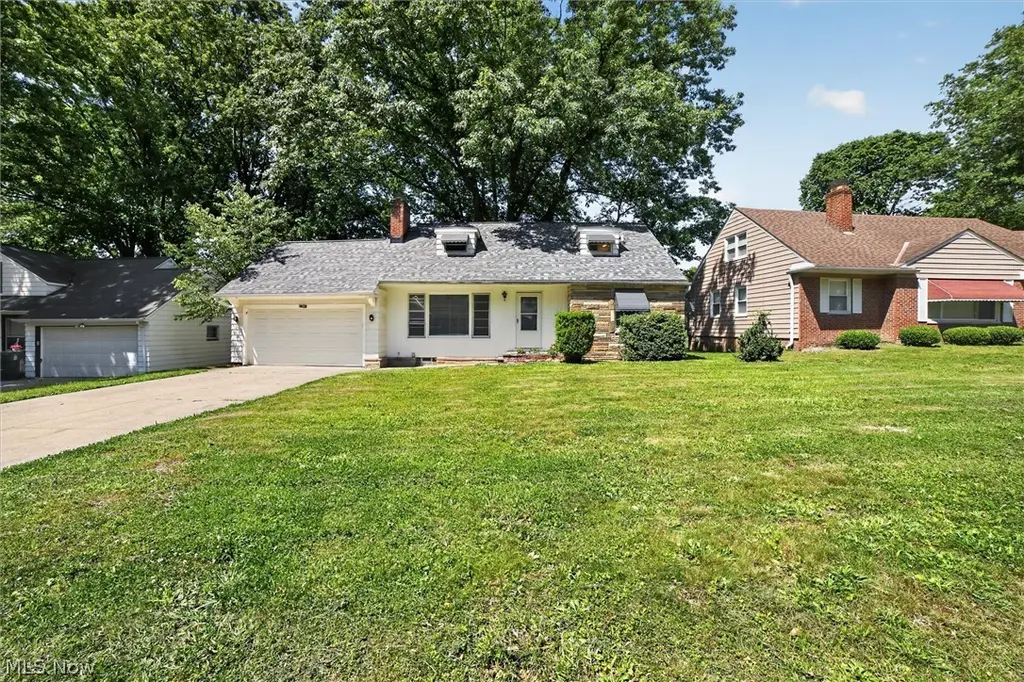
3705 Brinkmore Rd · Cleveland Heights, OH
Flood risk 1/10 · Minimal
- FEMA flood zone
- X (unshaded)
- Chance of flooding over 30 yrs
- 0.0%
- Est. flood insurance / yr
- $473 – $860
Fire risk 1/10 · Minimal
- Est. fire insurance / yr
- $713 – $1,323
Heat risk 2/10 · Minimal
- Hot days now (above 95°F)
- 6 days/yr
- Hot days in 30 yrs
- 15 days/yr
Wind risk 1/10 · Minimal
- Chance of severe wind over 30 yrs
- —
Air-quality risk 3/10 · Minor
- Unhealthy air days now
- 2 days/yr
- Unhealthy air days in 30 yrs
- 5 days/yr
Risk factors via First Street. Map © Google.
Why this score? — see what drove the D- grade
The composite is a weighted blend of 9 inputs, each scored 0–100. Each bar is that input's sub-score; the figure is the points it added to the 100-point composite (weight × sub-score).
- Cash flow +8.9/30.0
- ARV discount +7.3/15.0
- Livability +4.5/5.0
- Rent growth +4.2/5.0
- 1% rule +3.5/10.0
- Schools +2.8/10.0
- DSCR +2.5/10.0
- Condition / age +2.5/5.0
- Appreciation +0.0/10.0
$225,000
🖨 Deal sheet (PDF) 📄 Offer letter ✓ Due diligence
Listing remarks MLS
Co-list W/ Duane Silk 442-2533. Alum/Stone Bung Features Lrg Bdrms & Sitting Rm Off 3rd Bdrm. 1/2 Bath Up. Home Warranty. Videotape Available. Checklist On File
Key facts
- Back yard patio
- Fenced-in backyard
- 8,023 sq ft lot
Tags
Property features AI
Exterior
- Parking: Attached garage; Two garage spaces
- Utilities: Public water; Public sewer
- Home design: Two-story residence; Asphalt roof; Aluminum siding and brick exterior
- Construction: Built per public records (year source: public records)
- Exterior features: Patio; Chain link fencing
Interior
- Kitchen: Eat-in kitchen; Dishwasher; Range; Refrigerator
- Bedrooms: Three main-level bedrooms; Additional bedrooms located on first and second floors
- Flooring: Wood flooring in multiple rooms; Tile flooring in at least one bathroom
- Bathrooms: One full bathroom; Two half bathrooms; At least one main-level bathroom
- Heating & cooling: Forced air heating; Central air conditioning
- Interior features: Unfinished basement; Wood and tile flooring throughout; Fireplace (1)
- Laundry & utility: Washer hookup
Neighborhood map
What this means for you Summary
Snapshot
- This is a 3-bed/2.0-bath single-family listed at $225k.
Deal economics
- At list price, monthly cash flow is $-180 ($-2k/yr) — negative.
- To cash-flow at today's rent, offer at most $193k (14.2% below list).
- To meet the 1% rule (rent ≥ 1% of price), the offer needs to be $191k (14.9% below list).
- Recommended offer: $191k (14.9% below list) — sets the bar for 1% rule.
- Cap rate 5.3% vs local median 4.3% in Cleveland Heights — meaningfully above typical; check what's discounted (condition, days-on-market, listing class) to confirm the premium yield is real.
Location & tenants
- Location reads 89/100 on livability (#12 in OH, #124 nationally) — a professional / high-income tenant draw. Strengths: amenities A+, commute A+, cost of living A+.
- Cleveland Heights-University Heights City (suburban): math 23% / reading 41% proficiency, ranked #568 of 656 in OH (top 87%) — families likely to look elsewhere, expect single-tenant / working-renter base with shorter leases; 64% free/reduced lunch — lower-income household profile, screen leases tightly.
- Zoned schools: Cleveland Heights High School (math 12% / reading 46%, grade F, #627 of 781 statewide, top 81%, 1,664 students, 0% FRL) — zoned schools average 0% FRL vs 64% district-wide (64 pts lower); this property's tenant base skews higher-income than the district average.
- Market conditions: Rents rising fast (+6.8%/yr); 150 active listings in the ZIP; 27 comparable units currently listed for rent nearby; rentals at typical pace (median 18d on market — plan ~3-4 weeks tenant-placement turnaround); solid renter incomes; 1,441 units permitted in Cuyahoga County in 2024 (700 in 5+ unit buildings).
Forward outlook
- Local home prices are declining (-3.0%/yr); year-one equity from $2k of loan paydown is wiped out by about $7k of value loss. Plan a longer hold.
- Cuyahoga County population projected to shrink 8% by 2050 — rents likely to lag national; underwrite the cash flow, not the appreciation.
Negotiation context
- It's been on market 16 days — a 2% lower offer ($222k) is reasonable based on typical stale-listing flexibility.
- 8 sale attempts since 35y ago with the ask held roughly flat each time — persistent listings suggest the price (not the market) is what's stuck; bring a comps-based counter.
- Current owner paid $86k; list at $225k implies a 162% gain — meaningful room to come down on a strong offer.
Risks & watch-outs
- Watch-outs: built in 1952 — expect roof / HVAC / electrical / plumbing capex.
Questions for the listing agent
- What do current leases actually rent for vs. the listed asking? Can we see a recent rent roll and the last 12 months of T-12 income?
- Built in 1952 — when were the roof, HVAC, electrical panel, plumbing, and water heater last replaced?
- Is there a deadline driving the sale (1031 exchange, divorce, estate, relocation)? That informs how much negotiation room exists.
- Schools are A-rated — typically a magnet for longer-tenancy family renters. What's the average tenant stay here, and is there a school-zone premium baked into asking?
- The area grade is low — what's the realistic commute time and amenity access for the typical tenant pool here? Any planned neighborhood developments (good or bad) we should know about?
- What's the average days-on-market for RENTAL listings here right now (not sales)? A rising rental-DOM trend means longer vacancies and softer asking-rent achievability than the comps imply.
- What's the recent tenant-quality profile in this submarket — average credit score on applications, eviction rate, late-payment / NSF rate, and stable-employment percentage? A property-management company in the area should have these aggregated.
- How much new for-sale + rental construction is in the pipeline within 1–3 miles? Heavy new supply typically softens prices + rents 12–24 months out; constrained supply supports both.
Investment metrics
- 1% rule
- 0.85% ✗
- Cap rate
- 5.33%
- Cash-on-cash
- -3.43%
- DSCR
- 0.85
- GRM
- 9.8
CMA / ARV
- ARV (on-the-fly)
- $223,983
- Comps found
- 12
Show comp detail 12 sales within ~0.75 mi
| Address | Dist | Beds/Ba | Sqft | Sold | Price | $/sf | Match |
|---|---|---|---|---|---|---|---|
| 693 Quilliams Rd | 0.13mi | 3/1.5 | 1,856 (+2%) | 1mo | $220,000 | $119 | 88 |
| 565 Quilliams Rd | 0.14mi | 3/1.5 | 1,718 (-6%) | 4mo | $238,900 | $139 | 78 |
| 3757 Princeton Blvd | 0.14mi | 3/1.5 | 1,704 (-6%) | 5mo | $210,000 | $123 | 77 |
| 3927 Princeton Blvd | 0.36mi | 3/1.5 | 1,888 (+4%) | 6mo | $178,000 | $94 | 70 |
| 4019 Princeton Blvd | 0.51mi | 3/1.5 | 1,746 (-4%) | 1mo | $215,000 | $123 | 67 |
| 4002 Lancaster Rd | 0.58mi | 3/2.5 | 1,709 (-6%) | 3mo | $258,000 | $151 | 58 |
| 955 Montford Rd | 0.73mi | 3/2.5 | 1,775 (-2%) | 7mo | $235,000 | $132 | 54 |
| 1031 Pennfield Rd | 0.75mi | 4/1.5 (+1) | 1,727 (-5%) | 1mo | $212,000 | $123 | 48 |
| 979 Oxford Rd | 0.68mi | 4/2.0 (+1) | 1,640 (-10%) | 1mo | $178,000 | $109 | 46 |
| 952 Oxford Rd | 0.62mi | 4/2.0 (+1) | 1,560 (-14%) | 2mo | $180,000 | $115 | 41 |
| 862 Keystone Dr | 0.71mi | 4/1.5 (+1) | 1,549 (-15%) | 1mo | $229,900 | $148 | 34 |
| 854 Keystone Dr | 0.70mi | 4/1.5 (+1) | 1,575 (-14%) | 7mo | $184,000 | $117 | 32 |
Match score weights: distance 35% · size 25% · config 20% · recency 20%. Top-matched comps best support the ARV.
Projected returns pro-forma
-3.0% appreciation · 6.85% rent growth · sell at horizon
- IRR
- -17.4%
- Equity multiple
- 0.36×
- Total profit
- $-40,122
- Equity at exit
- $33,548
- IRR
- -3.0%
- Equity multiple
- 0.76×
- Total profit
- $-15,034
- Equity at exit
- $19,454
Cash invested: $63,000 (down + closing). Projections, not guarantees.
Landlord ↔ Tenant lean methodology
- Overall (STATE)
- 73 Landlord-Friendly
- State Ohio
- 73 Landlord-Friendly · R+6
- County
- — inherits STATE
- City
- — inherits STATE
ZIP-level market 44121
- Rents YoY
- 6.8%
- Active inventory
- 150
- Price-to-rent
- 9.8×
Monthly cashflow live
- Estimated rent
- $1,915 high interval (Pro) →
- Mortgage (P&I)
- −$1,180
- Tax from tax record
- −$419 /mo · $5,029/yr
- Insurance
- −$94
- HOA
- −$0
- Vacancy / Maint / Mgmt
- −$402
- Net cashflow
- $-180
Break-even live
Sensitivity live
| Price | -10% $-53 | -5% $-117 | +0% $-180 | +5% $-244 | +10% $-308 |
|---|---|---|---|---|---|
| Rent | -10% $-331 | -5% $-256 | +0% $-180 | +5% $-105 | +10% $-29 |
| Rate | -1.0pp $-67 | -0.5pp $-123 | base $-180 | +0.5pp $-239 | +1.0pp $-298 |
UW: 25.0% down · 7.5% · 30yr · 1.5% tax · 5.0% vac · 8.0% maint · 8.0% mgmt
Financing live
Cash to close
- Down payment
- $56,250
- Closing costs
- $6,750
- Reserves months
- —
- Total cash needed
- —
Loan-product check · same deal, 3 products live
Conventional
25% down · 7.5% · 30yr
- Down + closing
- —
- Monthly P&I
- —
- Monthly cashflow
- —
- DSCR
- —
- Eligible?
- —
Personal DTI + credit; lowest rate.
DSCR
20% down · 8.5% · 30yr
- Down + closing
- —
- Monthly P&I
- —
- Monthly cashflow
- —
- DSCR
- —
- Eligible?
- —
No personal income docs; deal must DSCR.
Hard money
10% down · 12.0% · 12mo
- Down + closing
- —
- Monthly P&I
- —
- Monthly cashflow
- —
- DSCR
- —
- Eligible?
- —
Short-term bridge; refi at stabilization.
Rent comps 27 comps
| Address | Beds | Baths | Sqft | Rent | $/sqft | DOM | Units | Dist |
|---|---|---|---|---|---|---|---|---|
| 3802 Princeton Blvd Cleveland, OH | 3.0 | 1.5 | 1656 | $2,275 | $1.37 | 3d | 1 | 0.18mi |
| 821 Nela View Rd Cleveland, OH | 4.0 | 2.5 | 2178 | $2,100 | $0.96 | 9d | 1 | 0.66mi |
| 994 Yellowstone Rd Cleveland, OH | 3.0 | 2.0 | 1475 | $1,395 | $0.95 | 3d | 1 | 0.68mi |
| 303 S Green Rd Cleveland, OH | 4.0 | 2.0 | 1381 | $1,700 | $1.23 | 3d | 1 | 0.76mi |
| 1007 Elbon Rd Cleveland, OH | 3.0 | 1.0 | 1386 | $1,400 | $1.01 | 12d | 1 | 0.78mi |
| 963 Selwyn Rd Cleveland, OH | 4.0 | 1.0 | 1300 | $2,650 | $2.04 | 3d | 1 | 0.79mi |
| 915 Nela View Rd Cleveland, OH | 4.0 | 1.0 | 1300 | $2,600 | $2.00 | 18d | 1 | 0.82mi |
| 1035 Elbon Rd Cleveland, OH | 4.0 | 1.5 | 1304 | $1,675 | $1.28 | 18d | 1 | 0.83mi |
| 3430 Winsford Rd Cleveland, OH | 4.0 | 1.5 | 1800 | $1,590 | $0.88 | 18d | 1 | 0.84mi |
| 876 Eloise Dr Unit Upper Cleveland Heights, OH | 2.0 | 1.0 | 1233 | $1,200 | $0.97 | 18d | 1 | 0.87mi |
| 983 Greyton Rd Cleveland, OH | 3.0 | 2.0 | 1457 | $1,495 | $1.03 | 18d | 1 | 0.90mi |
| 1082 Hillstone Rd Cleveland, OH | 3.0 | 2.0 | 2376 | $1,695 | $0.71 | 25d | 1 | 0.95mi |
| 1082 Hillstone Rd Unit 1 Cleveland Heights, OH | 3.0 | 1.5 | 2376 | $1,695 | $0.71 | 25d | 1 | 0.95mi |
| 1099 Woodview Rd Cleveland, OH | 4.0 | 1.0 | 1500 | $2,500 | $1.67 | 3d | 1 | 0.95mi |
| 16000 Terrace Rd Cleveland, OH | 1.0–3.0 | 1.0–2.0 | 1000 | $1,210 | $1.21 | 3d | 39 | 1.00mi |
| 3917 Bluestone Rd Cleveland, OH | 4.0 | 1.5 | 1700 | $1,650 | $0.97 | 23d | 1 | 1.05mi |
| 910 Dresden Rd Cleveland, OH | 4.0 | 2.0 | 1839 | $1,800 | $0.98 | 18d | 1 | 1.07mi |
| 3406 Henderson Rd Cleveland, OH | 4.0 | 1.5 | 1343 | $2,250 | $1.68 | 18d | 1 | 1.10mi |
| 3337 Sylvanhurst Rd Cleveland, OH | 3.0 | 1.0 | 1334 | $1,800 | $1.35 | 9d | 1 | 1.13mi |
| 3808 Kirkwood Rd Cleveland, OH | 4.0 | 1.5 | 1740 | $2,150 | $1.24 | 16d | 1 | 1.19mi |
| 25 Trenton Sq Unit T54 Cleveland, OH | 3.0 | 2.0 | 1324 | $1,500 | $1.13 | 18d | 1 | 1.21mi |
| 963 Chelston Rd Cleveland, OH | 4.0 | 2.0 | 1974 | $1,950 | $0.99 | 45d | 1 | 1.27mi |
| 2401 N Taylor Rd Cleveland, OH | 3.0 | 1.0 | 1347 | $1,325 | $0.98 | 9d | 1 | 1.31mi |
| 3810 Parkdale Rd Cleveland, OH | 3.0 | 1.5 | 1281 | $2,067 | $1.61 | 4d | 1 | 1.32mi |
| 15801 Hazel Rd Cleveland, OH | 3.0 | 1.5 | 1908 | $1,550 | $0.81 | 18d | 1 | 1.40mi |
| 4456 Donna Dr Richmond Heights, OH | 3.0 | 2.5 | 1940 | $2,295 | $1.18 | 3d | 1 | 1.45mi |
| 1286 E 152nd St Cleveland, OH | 2.0 | 1.0 | 1638 | $1,095 | $0.67 | 45d | 1 | 1.48mi |
Listing history 10 events
-
2026-06-21days on market $225,000 Active 16 DOM
-
2026-06-18days on market $225,000 Active 13 DOM
-
2026-06-17days on market $225,000 Active 12 DOM
-
2026-06-16days on market $225,000 Active 11 DOM
-
2026-06-15days on market $225,000 Active 10 DOM
-
2026-06-13days on market $225,000 Active 8 DOM
-
2026-06-09days on market $225,000 Active 4 DOM
-
2026-06-08days on market $225,000 Active 3 DOM
-
2026-06-07remarks 699-char remark
-
2026-06-07$225,000 Active 2 DOM
ⓘ Source: listings_history table (triggers on properties + properties_extension) + one-shot
backfill from property_details.listing_events for pre-trigger history.
Tax reassessment forecast OH · Partial reset (capped growth)
- Current annual tax
- $5,029 · $419/mo
- Projected year-2 tax
- $5,029 · $419/mo
- Expected delta
- $0/yr ($0/mo · 0.0%)
ⓘ Screening estimate from a state-policy table — verify with the county assessor before closing.
Climate risk First Street
- Flood 1/10 Low FEMA zone X (unshaded) · 0% chance over 30 yrs
- Wildfire 1/10 Low
- Heat 2/10 Low 6 d/yr ≥95°F today · 15 d/yr by 30 yrs out
- Wind 1/10 Low
- Air quality 3/10 Moderate 2 unhealthy d/yr today · 5 by 30 yrs out
Nearby sold comps map
Loading sold comps map…
Walkable amenities ~0.75 mi
Loading nearby amenities…
Taxation est. · year 1
- Rental income
- $22,975
- − Mortgage interest
- −$12,603
- − Property taxes
- −$5,029
- − Insurance
- −$1,125
- − Repairs & maintenance
- −$1,838
- − Management
- −$1,838
- − Depreciation
- −$6,545
- Taxable loss
- −$6,004
- Est. tax savings @ 24.0%
- +$1,441
- After-tax cash flow
- $-722/yr
For passive investors: Depreciation is non-cash, so a rental often shows a tax loss while cash-flowing — sheltering income. Rental losses are passive: they offset passive income freely, and up to $25,000/yr can offset ordinary (W-2) income if you actively participate and your MAGI is under $100k (phasing out to $0 by $150k); unused losses carry forward. On sale, claimed depreciation is recaptured at up to 25%, and gains may owe capital-gains tax (a 1031 exchange can defer both). Figures are a year-1 estimate at your 24.0% rate — not tax advice; consult a CPA.
Schools (NCES district)
- District
- Cleveland Heights-University Heights City
- NCES district ID
- 3904379
- Math proficiency
- 23% ▼ -22.00%
- Reading proficiency
- 41% ▼ -12.00%
- Median HH income
- $53,451
- Composite
- 28.12/100
- National rank
- #6822
- State rank
- #568 of 656 in OH
Livability — Cleveland Heights
- Score
- 89/100
- State rank
- #12
- US rank
- #124
Category grades
Schools grade is shown separately in the Schools card above.
Census & demographics
- Census place
- Cleveland Heights, OH
- County
- Cuyahoga County · 1,090,369 people
- City population
- 32,312
- Metro
- Cleveland-Elyria, OH
- Population (ZIP)
- 32,312
- Household income
- $76,767
- Rent vs Own
- Severe rent burden
- 672.0
Population outlook (Cuyahoga County) Hauer SSP2
- Today (2025)
- 1,244,621 people
- By 2030
- 1,230,093 · -1.2%
- By 2040
- 1,189,108 · -4.5%
- By 2050
- 1,145,706 · -7.9%
- By 2075
- 1,076,557 · -13.5%
- By 2100
- 978,987 · -21.3%
Race, ethnicity, and origin ACS 2023
- Neighborhood character
- Diverse neighborhood (Simpson 0.56)
- Race & ethnicity
- Black 55% White 36% Two or more races 4% Hispanic / Latino 3% Asian 2%
- Common ancestry
- Romanian 3% Italian 2% Scotch-Irish 2%
- Foreign-born
- 5% · Canada, China, India
- Languages at home
- 92% English-only · Spanish 2% Chinese 1% Other Indo-European 1%
Political lean MEDSL · Cuyahoga
- 2024 margin
- Solid D (+31.5) · D 65.4% · R 33.9%
- 2008→2024 swing
- -7.4pp toward R · 2008: 38.9pp · 2024: 31.5pp
- All cycles
- 2024: D+31.5 2020: D+34.1 2016: D+35.0 2012: D+38.7 2008: D+38.9
Not yet ingested
- Civics
- —
Market trends
- HPI YoY
- ▼ -180.15%
- Current HPI
- 173.7405
- Rent YoY
- ▲ 6.85%
- Metro
- Cleveland-Elyria, OH
- State GDP YoY
- ▲ 1.98%
- F500 in state
- 48
Industry mix (Fortune 500 HQ in OH)
| Industry | F500 HQs | Revenue |
|---|---|---|
| Insurance | 3 | $145B |
|
||
| Industrial Machinery | 3 | $49B |
|
||
| Financial Services | 3 | $24B |
|
||
| Consumer Goods | 2 | $93B |
|
||
| Aerospace / Defense | 2 | $47B |
|
||
| Utilities | 2 | $33B |
|
||
Price history
+212.5% since first listed19 events — show timeline
- 2026-06-05 Listed $225,000 MLSNOW
- 2023-09-18 Rental Removed $1,650 APPFOLIO
- 2023-09-15 Listed for Rent $1,650 APPFOLIO
- 2023-09-14 Rental Removed $1,650 YESMLS
- 2023-07-28 Listed for Rent $1,650 YESMLS
- 2016-06-26 Listing Removed — MLSNOW
- 2016-05-17 Contingent — MLSNOW
- 2016-04-26 Relisted — MLSNOW
- 2016-04-25 Contingent — MLSNOW
- 2016-04-04 Listed $49,900 MLSNOW
- 1993-04-21 Sold (MLS) $86,000 MLSNOW
- 1993-04-20 Listing Removed — MLSNOW
- 1993-04-17 Listing Removed — MLSNOW
- 1993-04-15 Sold (Public Records) $86,000 Public Records
- 1993-01-28 Listed $89,800 MLSNOW
- 1992-10-17 Listed $89,800 MLSNOW
- 1992-09-14 Listing Removed — MLSNOW
- 1991-11-13 Listed $89,900 MLSNOW
- 1982-03-24 Sold (Public Records) $72,000 Public Records
Property tax history
+1.0%/yrLatest (2025): $5,029 · -2.0% YoY. Source: county tax records.
Cash-flow waterfall
monthlySold comps — $/sqft
last 12 mo · ≤1 miLoading sold comps…