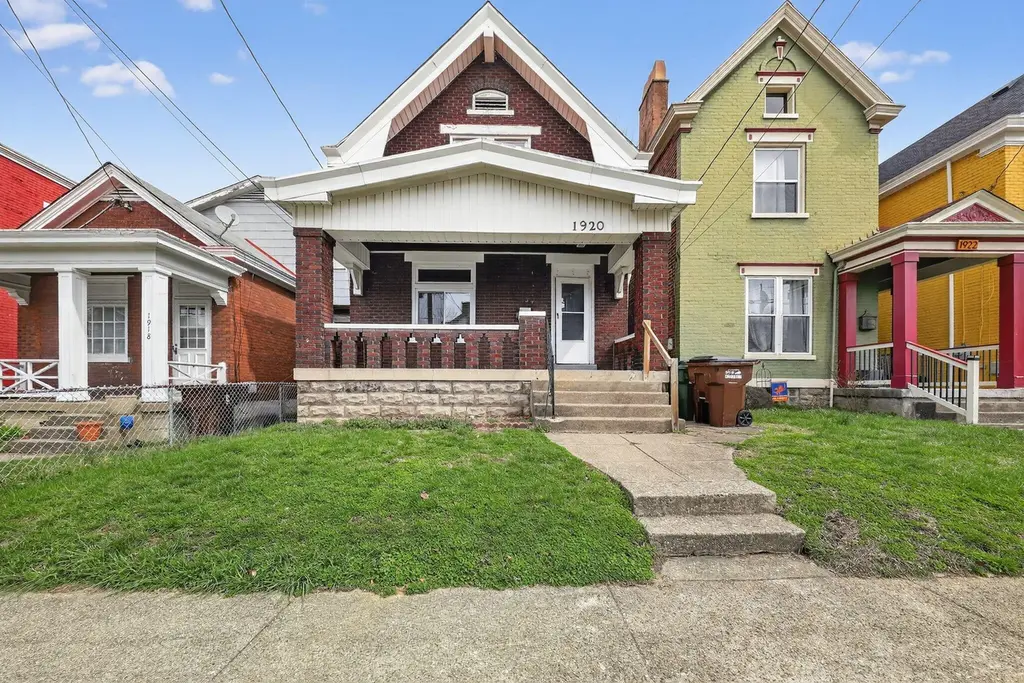
1920 Garrard St · Covington, KY
Flood risk 1/10 · Minimal
- FEMA flood zone
- X (unshaded)
- Chance of flooding over 30 yrs
- 0.0%
- Est. flood insurance / yr
- $507 – $1,088
Fire risk 1/10 · Minimal
- Est. fire insurance / yr
- $839 – $1,559
Heat risk 5/10 · Moderate
- Hot days now (above 103°F)
- 7 days/yr
- Hot days in 30 yrs
- 20 days/yr
Wind risk 2/10 · Minimal
- Chance of severe wind over 30 yrs
- 1.0%
Air-quality risk 3/10 · Minor
- Unhealthy air days now
- 2 days/yr
- Unhealthy air days in 30 yrs
- 3 days/yr
Risk factors via First Street. Map © Google.
Why this score? — see what drove the C- grade
The composite is a weighted blend of 9 inputs, each scored 0–100. Each bar is that input's sub-score; the figure is the points it added to the 100-point composite (weight × sub-score).
- ARV discount +14.9/15.0
- Cash flow +14.8/30.0
- DSCR +4.5/10.0
- Livability +4.3/5.0
- 1% rule +4.2/10.0
- Rent growth +3.8/5.0
- Condition / age +2.5/5.0
- Schools +1.5/10.0
- Appreciation +0.0/10.0
$169,900
🖨 Deal sheet (PDF) 📄 Offer letter ✓ Due diligence
Listing remarks MLS
Excellent opportunity to make this brick home your own! Enjoy the inviting covered front porch, fenced yard, & patio. Hardwood floors in the dining room & large living room featuring decorative woodwork & fireplace. Generously sized kitchen has been updated but needs appliances. 2 bedrooms boast hardwood floors & overhead fans. Modernized bath w/ tub & pedestal sink. Some windows have been replaced. Most exterior trim has been vinyl wrapped for low maintenance. Great location & priced to sell! This is a great value add situation for investors or owner occupied buyers.
Key facts
- Covered front porch
- Decorative fireplace
- Formal dining room
Tags
Property features AI
Exterior
- Parking: On-street parking
- Utilities: Public water; Public sewer; Natural gas available
- Home design: Single-family house; Two levels; Built in 1917
- Construction: Brick construction; Block foundation; Shingle roof
- Exterior features: Privacy fencing; Lot dimensions approximately 25 x 100
Interior
- Kitchen: Gas range; Dishwasher; Refrigerator
- Bedrooms: Primary bedroom (13 x 13); Second bedroom (16 x 8)
- Bathrooms: 1 full bathroom
- Heating & cooling: Forced air heating; Central air conditioning
- Interior features: Natural woodwork; Brick fireplace
- Laundry & utility: Full basement (utility/storage space)
Neighborhood map
What this means for you Summary
Snapshot
- This is a 2-bed/1.5-bath single-family listed at $170k.
Deal economics
- At list price, monthly cash flow is $47 ($566/yr) — positive.
- The deal already cash-flows at list — no discount required.
- To meet the 1% rule (rent ≥ 1% of price), the offer needs to be $157k (7.8% below list).
- Recommended offer: $157k (7.8% below list) — sets the bar for 1% rule.
- Cap rate 6.6% vs local median 5.3% in Covington — meaningfully above typical; check what's discounted (condition, days-on-market, listing class) to confirm the premium yield is real.
Location & tenants
- Location reads 86/100 on livability (#40 in KY, #376 nationally) — a professional / high-income tenant draw. Strengths: amenities A+, commute A+, cost of living A+; Watch: employment D+.
- Covington Independent (suburban): math 10% / reading 27% proficiency, ranked #162 of 165 in KY (top 98%) — low school quality limits family demand, transient renter base, plan for 1-2y turnover; 78% free/reduced lunch — lower-income household profile, screen leases tightly.
- Zoned schools: Sixth District Elementary School (math 8% / reading 17%, grade F, #630 of 676 statewide, top 95%, 446 students, 84% FRL); Holmes Middle School (math 8% / reading 26%, grade F, #211 of 217 statewide, top 97%, 656 students, 84% FRL); Holmes High School (math 12% / reading 17%, grade F, #227 of 254 statewide, top 89%, 878 students, 80% FRL) — zoned schools at 83% FRL track the district average.
- Market conditions: Rents rising fast (+5.1%/yr); 60 active listings in the ZIP; 29 comparable units currently listed for rent nearby; rentals leasing fast (median 10d on market — plan ~1-2 weeks tenant-placement turnaround); 699 units permitted in Kenton County in 2024 (287 in 5+ unit buildings).
- This rent runs 31% of the median local income ($61k/yr) — at the standard rent-burdened threshold; future hikes will face affordability resistance.
Forward outlook
- Local home prices are declining (-3.0%/yr); year-one equity from $1k of loan paydown is wiped out by about $5k of value loss. Plan a longer hold.
- Kenton County population projected at +5% by 2050 — modest demand growth; plan on rents tracking national, not racing it.
Negotiation context
- It's been on market 79 days — a 6% lower offer ($160k) is reasonable based on typical stale-listing flexibility.
- 8 sale attempts since 23y ago with the ask held roughly flat each time — persistent listings suggest the price (not the market) is what's stuck; bring a comps-based counter.
Risks & watch-outs
- Watch-outs: built in 1917 — expect roof / HVAC / electrical / plumbing capex.
- Climate carrying-cost: extreme-heat days projected 7→20/yr by 2055 (HVAC capex compounding) — expect insurance premiums to compound above CPI over the hold.
Questions for the listing agent
- It's been on market 79 days. Have you received any prior offers? Is the seller open to a 8% concession, seller financing, or rate buy-down credit?
- Built in 1917 — when were the roof, HVAC, electrical panel, plumbing, and water heater last replaced?
- Why hasn't it sold? Are there any deal-killer items the seller is aware of (foundation, flood, title, zoning, code violations)?
- Is there a deadline driving the sale (1031 exchange, divorce, estate, relocation)? That informs how much negotiation room exists.
- What's the average days-on-market for RENTAL listings here right now (not sales)? A rising rental-DOM trend means longer vacancies and softer asking-rent achievability than the comps imply.
- What's the recent tenant-quality profile in this submarket — average credit score on applications, eviction rate, late-payment / NSF rate, and stable-employment percentage? A property-management company in the area should have these aggregated.
- How much new for-sale + rental construction is in the pipeline within 1–3 miles? Heavy new supply typically softens prices + rents 12–24 months out; constrained supply supports both.
Investment metrics
- 1% rule
- 0.92% ✗
- Cap rate
- 6.63%
- Cash-on-cash
- 1.19%
- DSCR
- 1.05
- GRM
- 9.0
CMA / ARV
- ARV (on-the-fly)
- $203,236
- Comps found
- 12
Show comp detail 12 sales within ~0.75 mi
| Address | Dist | Beds/Ba | Sqft | Sold | Price | $/sf | Match |
|---|---|---|---|---|---|---|---|
| 1942 Eastern Ave | 0.15mi | 3/1.5 (+1) | 1,418 (+4%) | 0mo | $200,000 | $141 | 81 |
| 2018 Pearl St | 0.22mi | 2/2.0 | 1,312 (-4%) | 4mo | $70,000 | $53 | 78 |
| 329 E 16th St | 0.28mi | 2/2.0 | 1,454 (+7%) | 2mo | $90,000 | $62 | 72 |
| 316 W 21st St | 0.52mi | 2/1.0 | 1,376 (+1%) | 1mo | $205,000 | $149 | 71 |
| 202 W 18th St | 0.49mi | 3/1.5 (+1) | 1,436 (+5%) | 4mo | $219,000 | $153 | 60 |
| 218 Pleasant St | 0.61mi | 2/2.0 | 1,476 (+8%) | 1mo | $80,000 | $54 | 55 |
| 2307 Herman St | 0.57mi | 3/1.0 (+1) | 1,264 (-7%) | 0mo | $145,000 | $115 | 54 |
| 218 W 21st St | 0.48mi | 3/2.0 (+1) | 1,240 (-9%) | 3mo | $246,500 | $199 | 53 |
| 1735 Woodburn Ave | 0.61mi | 3/1.5 (+1) | 1,255 (-8%) | 1mo | $259,900 | $207 | 52 |
| 9 Madison Ct | 0.68mi | 3/2.0 (+1) | 1,297 (-5%) | 2mo | $230,000 | $177 | 51 |
| 113 Trevor St | 0.69mi | 3/2.0 (+1) | 1,425 (+4%) | 3mo | $205,000 | $144 | 51 |
| 1733 Jefferson Ave | 0.75mi | 3/1.5 (+1) | 1,203 (-12%) | 1mo | $242,000 | $201 | 40 |
Match score weights: distance 35% · size 25% · config 20% · recency 20%. Top-matched comps best support the ARV.
Projected returns pro-forma
-3.0% appreciation · 5.13% rent growth · sell at horizon
- IRR
- -12.0%
- Equity multiple
- 0.56×
- Total profit
- $-21,066
- Equity at exit
- $25,333
- IRR
- 0.1%
- Equity multiple
- 1.01×
- Total profit
- $348
- Equity at exit
- $14,690
Cash invested: $47,572 (down + closing). Projections, not guarantees.
Landlord ↔ Tenant lean methodology
- Overall (STATE)
- 83 Strongly Landlord-Friendly
- State Kentucky
- 83 Strongly Landlord-Friendly · R+16
- County
- — inherits STATE
- City
- — inherits STATE
ZIP-level market 41014
- Rents YoY
- 5.1%
- Active inventory
- 60
- Price-to-rent
- 9.0×
Monthly cashflow live
- Estimated rent
- $1,566 high interval (Pro) →
- Mortgage (P&I)
- −$891
- Tax from tax record
- −$228 /mo · $2,736/yr
- Insurance
- −$71
- HOA
- −$0
- Vacancy / Maint / Mgmt
- −$329
- Net cashflow
- $47
Break-even live
Sensitivity live
| Price | -10% $143 | -5% $95 | +0% $47 | +5% $-1 | +10% $-49 |
|---|---|---|---|---|---|
| Rent | -10% $-77 | -5% $-15 | +0% $47 | +5% $109 | +10% $171 |
| Rate | -1.0pp $133 | -0.5pp $90 | base $47 | +0.5pp $3 | +1.0pp $-42 |
UW: 25.0% down · 7.5% · 30yr · 1.5% tax · 5.0% vac · 8.0% maint · 8.0% mgmt
Financing live
Cash to close
- Down payment
- $42,475
- Closing costs
- $5,097
- Reserves months
- —
- Total cash needed
- —
Loan-product check · same deal, 3 products live
Conventional
25% down · 7.5% · 30yr
- Down + closing
- —
- Monthly P&I
- —
- Monthly cashflow
- —
- DSCR
- —
- Eligible?
- —
Personal DTI + credit; lowest rate.
DSCR
20% down · 8.5% · 30yr
- Down + closing
- —
- Monthly P&I
- —
- Monthly cashflow
- —
- DSCR
- —
- Eligible?
- —
No personal income docs; deal must DSCR.
Hard money
10% down · 12.0% · 12mo
- Down + closing
- —
- Monthly P&I
- —
- Monthly cashflow
- —
- DSCR
- —
- Eligible?
- —
Short-term bridge; refi at stabilization.
Rent comps 29 comps
| Address | Beds | Baths | Sqft | Rent | $/sqft | DOM | Units | Dist |
|---|---|---|---|---|---|---|---|---|
| 2030 Mackoy St Covington, KY | 3.0 | 1.5 | 1598 | $1,729 | $1.08 | 0d | 1 | 0.11mi |
| 1914 Eastern Ave Apt 3 Covington, KY | 1.0 | 1.0 | 900 | $995 | $1.11 | 16d | 1 | 0.14mi |
| 1927 Scott St Apt 1 Covington, KY | 3.0 | 2.0 | 1865 | $2,100 | $1.13 | 22d | 1 | 0.20mi |
| 512 Wallace Ave Unit 512/18 Covington, KY | 2.0 | 2.0 | 900 | $1,299 | $1.44 | 9d | 1 | 0.23mi |
| 310 E 16th St Covington, KY | 3.0 | 1.0 | 1300 | $1,295 | $1.00 | 0d | 1 | 0.30mi |
| 1551 Holman Ave Covington, KY | 3.0 | 1.0 | 1379 | $1,425 | $1.03 | 0d | 1 | 0.66mi |
| 344 E 13th St Unit 1 Covington, KY | 2.0 | 1.0 | 1000 | $1,275 | $1.27 | 25d | 1 | 0.67mi |
| 2307 Center St Covington, KY | 3.0 | 1.5 | 1216 | $1,950 | $1.60 | 9d | 1 | 0.72mi |
| 1209 Holman St Unit 2 Covington, KY | 1.0 | 1.0 | 980 | $1,225 | $1.25 | 0d | 1 | 0.90mi |
| 1025 Scott St Unit 2 Covington, KY | 2.0 | 2.0 | 1100 | $1,800 | $1.64 | 5d | 1 | 0.91mi |
| 1205 Lee St Unit 3 Covington, KY | 3.0 | 2.5 | 1850 | $3,000 | $1.62 | 25d | 1 | 0.97mi |
| 1700 Aspen Pines Dr Wilder, KY | 1.0–3.0 | 1.0–2.5 | 1420 | $1,895 | $1.33 | 0d | 14 | 0.98mi |
| 634 Greenup St Covington, KY | 1.0 | 1.5 | 1050 | $1,595 | $1.52 | 9d | 1 | 1.16mi |
| 1114 Columbia St Unit 2 Newport, KY | 1.0 | 1.0 | 925 | $1,550 | $1.68 | 46d | 1 | 1.22mi |
| 521 Garrard St Apt 3 Covington, KY | 1.0 | 1.0 | 875 | $1,996 | $2.28 | 16d | 1 | 1.24mi |
| 119 W 33rd St Unit 1 Latonia, KY | 1.0 | 1.0 | 900 | $1,075 | $1.19 | 25d | 1 | 1.26mi |
| 809 Isabella St Newport, KY | 2.0 | 2.0 | 1519 | $2,200 | $1.45 | 46d | 1 | 1.28mi |
| 508 Greenup St Unit 508-02 Covington, KY | 2.0 | 1.0 | 1220 | $1,800 | $1.48 | 4d | 1 | 1.29mi |
| 203 W 8th St Newport, KY | 2.0 | 1.5 | 1456 | $2,300 | $1.58 | 0d | 1 | 1.35mi |
| 911 Putnam St #2 Newport, KY | 2.0 | 1.0 | 1000 | $1,600 | $1.60 | 23d | 1 | 1.39mi |
| 1431 Dixie Hwy Park Hills, KY | 1.0–2.0 | 1.0–2.0 | 920 | $2,553 | $2.77 | 0d | 10 | 1.40mi |
| 24 Woodland Hills Dr #11 Southgate, KY | 2.0 | 2.0 | 950 | $1,445 | $1.52 | 9d | 1 | 1.42mi |
| 437 W 6th St Covington, KY | 2.0 | 1.0–2.0 | 741 | $2,799 | $3.77 | 0d | 11 | 1.46mi |
| 400 Lakeview Dr #5 Wilder, KY | 2.0 | 2.0 | 1100 | $1,495 | $1.36 | 5d | 1 | 1.46mi |
| 835 York St Unit 2 Newport, KY | 1.0 | 1.0 | 1000 | $1,295 | $1.29 | 19d | 1 | 1.47mi |
| 103 E 3rd St Covington, KY | 2.0 | 2.0–2.5 | 1148 | $3,035 | $2.64 | 0d | 2 | 1.47mi |
| 2220 Cityscape Dr Covington, KY | 1.0–2.0 | 1.0–2.0 | 932 | $2,030 | $2.18 | 0d | 8 | 1.48mi |
| 515 Main St Covington, KY | 1.0–2.0 | 1.0–2.0 | 907 | $2,215 | $2.44 | 0d | 11 | 1.49mi |
| 1222 E Henry Clay Ave Fort Wright, KY | 3.0 | 1.5 | 1200 | $1,548 | $1.29 | 25d | 1 | 1.50mi |
Listing history 33 events
-
2026-06-21days on market $169,900 Active 79 DOM
-
2026-06-18days on market $169,900 Active 76 DOM
-
2026-06-17days on market $169,900 Active 75 DOM
-
2026-06-16days on market $169,900 Active 74 DOM
-
2026-06-15days on market $169,900 Active 73 DOM
-
2026-06-09days on market $169,900 Active 67 DOM
-
2026-06-08days on market $169,900 Active 66 DOM
-
2026-06-07days on market $169,900 Active 65 DOM
-
2026-06-03days on market $169,900 Active 61 DOM
-
2026-06-02days on market $169,900 Active 60 DOM
-
2026-06-01days on market $169,900 Active 59 DOM
-
2026-05-31days on market $169,900 Active 58 DOM
-
2026-05-15price $169,900
-
2026-04-04$174,900 Active
-
2024-09-05soldstatus $240,000
-
2021-08-13soldstatus $98,000
-
2021-08-05soldstatus $98,000 Closed 598-char remark
Show marketing remark (598 chars)
Excellent opportunity to make this brick home your own! Enjoy the inviting covered front porch, fenced yard, & patio. Hardwood floors in the dining room & large living room featuring decorative woodwork & fireplace. Generously sized kitchen has been updated but needs appliances. 2 bedrooms boast hardwood floors & overhead fans. Modernized bath w/ tub & pedestal sink. Some windows have been replaced. Most exterior trim has been vinyl wrapped for low maintenance. Great location & priced to sell! This is a great value add situation for investors or owner occupied buyers.
-
2021-07-22status Pending 598-char remark
Show marketing remark (598 chars)
Excellent opportunity to make this brick home your own! Enjoy the inviting covered front porch, fenced yard, & patio. Hardwood floors in the dining room & large living room featuring decorative woodwork & fireplace. Generously sized kitchen has been updated but needs appliances. 2 bedrooms boast hardwood floors & overhead fans. Modernized bath w/ tub & pedestal sink. Some windows have been replaced. Most exterior trim has been vinyl wrapped for low maintenance. Great location & priced to sell! This is a great value add situation for investors or owner occupied buyers.
-
2021-07-20$99,900 Active 598-char remark
Show marketing remark (598 chars)
Excellent opportunity to make this brick home your own! Enjoy the inviting covered front porch, fenced yard, & patio. Hardwood floors in the dining room & large living room featuring decorative woodwork & fireplace. Generously sized kitchen has been updated but needs appliances. 2 bedrooms boast hardwood floors & overhead fans. Modernized bath w/ tub & pedestal sink. Some windows have been replaced. Most exterior trim has been vinyl wrapped for low maintenance. Great location & priced to sell! This is a great value add situation for investors or owner occupied buyers.
-
2011-11-05historical
-
2011-09-27soldstatus $90,000
-
2011-03-06$82,900
-
2011-02-01historical
-
2010-02-18$89,900
-
2009-11-18historical
-
2009-08-28$88,800
-
2009-08-15historical
-
2008-09-15$89,900
-
2008-09-03historical
-
2008-04-07$117,900
-
2003-05-28soldstatus $67,500
-
2003-05-23soldstatus $67,500
-
2003-04-08$68,500
ⓘ Source: listings_history table (triggers on properties + properties_extension) + one-shot
backfill from property_details.listing_events for pre-trigger history.
Tax reassessment forecast KY · Resets to sale price
- Current annual tax
- $2,736 · $228/mo
- Projected year-2 tax
- $2,736 · $228/mo
- Expected delta
- $0/yr ($0/mo · 0.0%)
ⓘ Screening estimate from a state-policy table — verify with the county assessor before closing.
Climate risk First Street
- Flood 1/10 Low FEMA zone X (unshaded) · 0% chance over 30 yrs
- Wildfire 1/10 Low
- Heat 5/10 Major 7 d/yr ≥103°F today · 20 d/yr by 30 yrs out
- Wind 2/10 Low 100% chance of damaging wind over 30 yrs
- Air quality 3/10 Moderate 2 unhealthy d/yr today · 3 by 30 yrs out
Nearby sold comps map
Loading sold comps map…
Walkable amenities ~0.75 mi
Loading nearby amenities…
Taxation est. · year 1
- Rental income
- $18,789
- − Mortgage interest
- −$9,517
- − Property taxes
- −$2,736
- − Insurance
- −$850
- − Repairs & maintenance
- −$1,503
- − Management
- −$1,503
- − Depreciation
- −$4,943
- Taxable loss
- −$2,262
- Est. tax savings @ 24.0%
- +$543
- After-tax cash flow
- $1,109/yr
For passive investors: Depreciation is non-cash, so a rental often shows a tax loss while cash-flowing — sheltering income. Rental losses are passive: they offset passive income freely, and up to $25,000/yr can offset ordinary (W-2) income if you actively participate and your MAGI is under $100k (phasing out to $0 by $150k); unused losses carry forward. On sale, claimed depreciation is recaptured at up to 25%, and gains may owe capital-gains tax (a 1031 exchange can defer both). Figures are a year-1 estimate at your 24.0% rate — not tax advice; consult a CPA.
Schools (NCES district)
- District
- Covington Independent
- NCES district ID
- 2101350
- Math proficiency
- 10% ▼ -20.00%
- Reading proficiency
- 27% ▼ -14.00%
- Median HH income
- $33,681
- Composite
- 15.04/100
- National rank
- #9353
- State rank
- #162 of 165 in KY
Livability — Covington
- Score
- 86/100
- State rank
- #40
- US rank
- #376
Category grades
Schools grade is shown separately in the Schools card above.
Census & demographics
- Census place
- Covington, KY
- County
- Kenton County · 142,881 people
- City population
- 34,373
- Metro
- Cincinnati, OH-KY-IN
- Population (ZIP)
- 7,392
- Household income
- $61,382
- Rent vs Own
- Severe rent burden
- 511.0
Population outlook (Kenton County) Hauer SSP2
- Today (2025)
- 174,205 people
- By 2030
- 177,897 · +2.1%
- By 2040
- 182,671 · +4.9%
- By 2050
- 183,543 · +5.4%
- By 2075
- 178,977 · +2.7%
- By 2100
- 159,920 · -8.2%
Race, ethnicity, and origin ACS 2023
- Neighborhood character
- Predominantly White (71%)
- Race & ethnicity
- White 71% Two or more races 11% Hispanic / Latino 10% Black 8% Asian 2%
- Hispanic origin (detail)
- Mexican 1%
- Common ancestry
- Romanian 2% Lithuanian 1% Italian 1%
- Foreign-born
- 6% · Canada, China
- Languages at home
- 91% English-only · Spanish 8%
Political lean MEDSL · Kenton
- 2024 margin
- Strong R (+21.7) · D 38.2% · R 59.9% · Other 1.9%
- 2008→2024 swing
- -0.9pp no change · 2008: -20.9pp · 2024: -21.7pp
- All cycles
- 2024: R+21.7 2020: R+19.3 2016: R+26.1 2012: R+24.3 2008: R+20.9
Not yet ingested
- Civics
- —
Market trends
- HPI YoY
- ▼ -172.77%
- Current HPI
- 233.8216
- Rent YoY
- ▲ 5.13%
- Metro
- Cincinnati, OH-KY-IN
- State GDP YoY
- ▲ 1.81%
- F500 in state
- 4
Industry mix (Fortune 500 HQ in KY)
| Industry | F500 HQs | Revenue |
|---|---|---|
| Healthcare | 1 | $118B |
|
||
| Food / Beverage | 1 | $7B |
|
||
Price history
+148.0% since first listed21 events — show timeline
- 2026-05-15 Price Changed $169,900 NKMLS
- 2026-04-04 Listed $174,900 NKMLS
- 2024-09-05 Sold (Public Records) $240,000 Public Records
- 2021-08-13 Sold (Public Records) $98,000 Public Records
- 2021-08-05 Sold (MLS) $98,000 NKMLS
- 2021-07-22 Pending — NKMLS
- 2021-07-20 Listed $99,900 NKMLS
- 2011-11-05 Listing Removed — NKMLS
- 2011-09-27 Sold (Public Records) $90,000 Public Records
- 2011-03-06 Listed $82,900 NKMLS
- 2011-02-01 Listing Removed — NKMLS
- 2010-02-18 Listed $89,900 NKMLS
- 2009-11-18 Listing Removed — NKMLS
- 2009-08-28 Listed $88,800 NKMLS
- 2009-08-15 Listing Removed — NKMLS
- 2008-09-15 Listed $89,900 NKMLS
- 2008-09-03 Listing Removed — NKMLS
- 2008-04-07 Listed $117,900 NKMLS
- 2003-05-28 Sold (Public Records) $67,500 Public Records
- 2003-05-23 Sold (MLS) $67,500 NKMLS
- 2003-04-08 Listed $68,500 NKMLS
Property tax history
+5.8%/yrLatest (2025): $2,736 · +105.3% YoY. Source: county tax records.
Cash-flow waterfall
monthlySold comps — $/sqft
last 12 mo · ≤1 miLoading sold comps…