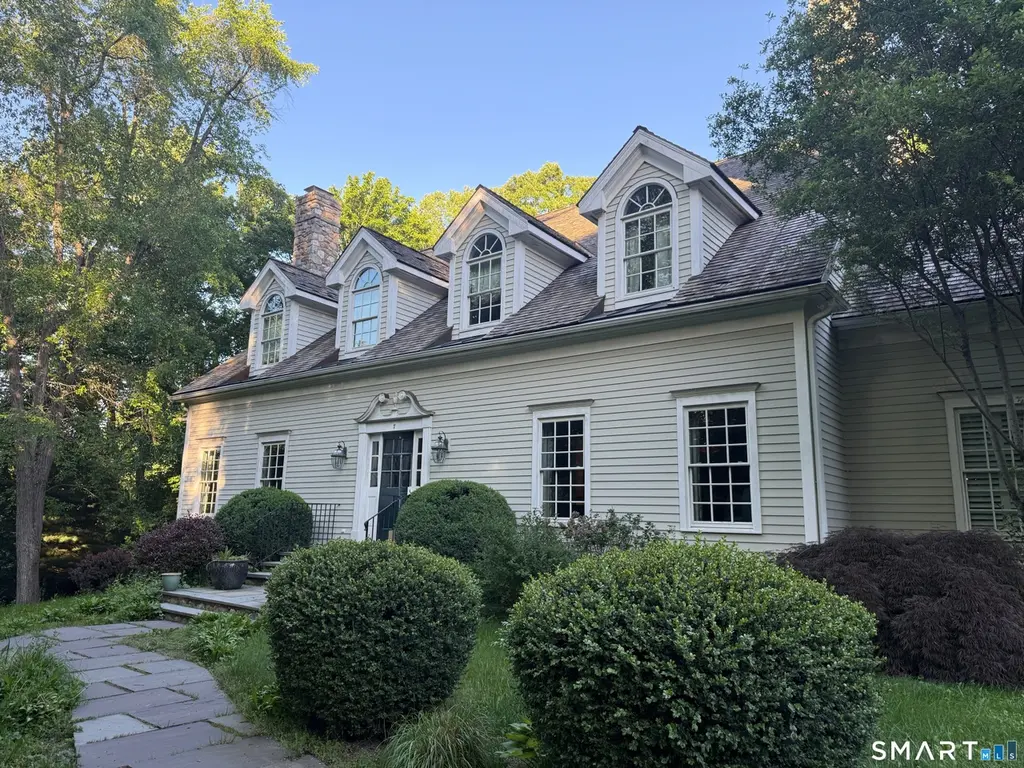
7 Old Hyde Rd · Weston, CT
Flood risk 1/10 · Minimal
- FEMA flood zone
- X (unshaded)
- Chance of flooding over 30 yrs
- 0.0%
- Est. flood insurance / yr
- $473 – $860
Fire risk 1/10 · Minimal
- Est. fire insurance / yr
- $829 – $1,539
Heat risk 5/10 · Moderate
- Hot days now (above 99°F)
- 7 days/yr
- Hot days in 30 yrs
- 15 days/yr
Wind risk 6/10 · Moderate
- Chance of severe wind over 30 yrs
- 27.0%
Air-quality risk 4/10 · Minor
- Unhealthy air days now
- 3 days/yr
- Unhealthy air days in 30 yrs
- 5 days/yr
Risk factors via First Street. Map © Google.
Why this score? — see what drove the D+ grade
The composite is a weighted blend of 9 inputs, each scored 0–100. Each bar is that input's sub-score; the figure is the points it added to the 100-point composite (weight × sub-score).
- Cash flow +19.5/30.0
- Schools +7.5/10.0
- DSCR +6.2/10.0
- 1% rule +5.0/10.0
- Rent growth +2.5/5.0
- Livability +2.5/5.0
- Condition / age +2.5/5.0
- ARV discount +0.0/15.0
- Appreciation +0.0/10.0
$2,875,000
🖨 Deal sheet (PDF) 📄 Offer letter ✓ Due diligence
Listing remarks
Privately set off a secluded drive on a beautifully landscaped acre in a premier Weston location, this exceptional custom home is the epitome of understated luxury and timeless elegance. The home is distinguished by its extraordinary craftsmanship, exquisite architectural detail, and generously proportioned rooms throughout. The rich custom millwork, refined moldings, soaring ceilings and harmonious spaces create an atmosphere of sophistication and warmth. Designed for both elegant entertaining and comfortable daily living, the residence offers 5/6 bedrooms, 6 full baths, two private offices, a stunning formal dining room with fireplace, elegant living room with fireplace, and an expansive
Key facts
- 1 acre lot
- 3 garage spots
- Built 2003
Property features AI
Exterior
- Parking: Attached garage; 3-car garage
- Utilities: Private well water; Septic sewer; Electric hot water; Oil fuel for heating
- Home design: Single-family home; Cream exterior siding; Clapboard and wood siding; Wood shingle roof
- Construction: Frame construction; Concrete foundation
- Exterior features: Beach rights; Level and sloping lot
Interior
- Kitchen: Electric cooktop; Wall oven; Range hood; Refrigerator; Dishwasher
- Bedrooms: 5 bedrooms
- Bathrooms: 6 full bathrooms; 2 half bathrooms
- Heating & cooling: Hot water heating (oil-fired); Central air conditioning; Fuel tank located in basement
- Interior features: 18 total rooms; Full, heated, partially finished basement with walk-out and livable space; Walk-up attic; 5 fireplaces; Central air
- Laundry & utility: Laundry room on upper level; 40-gallon electric hot water tank
Neighborhood map
What this means for you Summary
Snapshot
- This is a 5-bed/7.0-bath single-family listed at $2.88M.
Deal economics
- At list price, monthly cash flow is $3k ($39k/yr) — positive.
- The deal already cash-flows at list — no discount required.
- Meets the 1% rule at list price ($29k rent vs $2.88M).
- Cap rate 7.7% vs local median 3.1% in Weston — top-decile yield for the area; either an underpriced asset or a hidden risk that comps aren't pricing in. Stress-test before assuming the spread holds.
Location & tenants
- Location reads: area grade D — affects rentability + tenant quality, not the cash-flow math above.
- Weston School District (suburban): math 68% / reading 77% proficiency, ranked #4 of 153 in CT (top 3%) — strong family-tenant draw, lease renewals of 3-5y typical; only 1% free/reduced lunch — higher-income household profile.
- Zoned schools: Hurlbutt Elementary School (473 students, 1% FRL); Weston High School (math 82% / reading 87%, grade A, #1 of 194 statewide, top 1%, 722 students, 1% FRL) — zoned schools at 1% FRL track the district average.
- Zoned-school proficiency averages 84% at this address vs 72% district-wide (+12 pts) — the actual schools serving this property are materially stronger than the Weston School District average implies; a family-tenant draw the district grade alone would hide.
- Market conditions: 73 active listings in the ZIP; 2 comparable units currently listed for rent nearby; 1,151 units permitted in Western Connecticut Planning Region in 2024 (714 in 5+ unit buildings).
Forward outlook
- Local home prices are declining (-3.0%/yr); year-one equity from $20k of loan paydown is wiped out by about $86k of value loss. Plan a longer hold.
Negotiation context
- Only 1 days on market — expect competitive offers; lowballing is unlikely to land.
- Current owner paid $2.36M; 22% above their basis — modest negotiation headroom, anchor on the comps not their cost.
Risks & watch-outs
- Climate carrying-cost: major wind risk, 27% chance of damaging wind over 30y; extreme-heat days projected 7→15/yr by 2055 (HVAC capex compounding) — expect insurance premiums to compound above CPI over the hold.
Questions for the listing agent
- Is there a deadline driving the sale (1031 exchange, divorce, estate, relocation)? That informs how much negotiation room exists.
- The area grade is low — what's the realistic commute time and amenity access for the typical tenant pool here? Any planned neighborhood developments (good or bad) we should know about?
- What's the average days-on-market for RENTAL listings here right now (not sales)? A rising rental-DOM trend means longer vacancies and softer asking-rent achievability than the comps imply.
- What's the recent tenant-quality profile in this submarket — average credit score on applications, eviction rate, late-payment / NSF rate, and stable-employment percentage? A property-management company in the area should have these aggregated.
- How much new for-sale + rental construction is in the pipeline within 1–3 miles? Heavy new supply typically softens prices + rents 12–24 months out; constrained supply supports both.
Investment metrics
- 1% rule
- 1.00% ✓
- Cap rate
- 7.65%
- Cash-on-cash
- 4.85%
- DSCR
- 1.22
- GRM
- 8.3
CMA / ARV
- ARV (on-the-fly)
- $2,247,674
- Comps found
- 1
Show comp detail 1 sale within ~0.75 mi
| Address | Dist | Beds/Ba | Sqft | Sold | Price | $/sf | Match |
|---|---|---|---|---|---|---|---|
| 81 Norfield Rd | 0.42mi | 6/5.0 (+1) | 6,275 (-11%) | 6mo | $2,000,000 | $319 | 44 |
Match score weights: distance 35% · size 25% · config 20% · recency 20%. Top-matched comps best support the ARV.
Projected returns pro-forma
-3.0% appreciation · 3.0% rent growth · sell at horizon
- IRR
- -8.7%
- Equity multiple
- 0.68×
- Total profit
- $-258,228
- Equity at exit
- $428,672
- IRR
- 0.8%
- Equity multiple
- 1.05×
- Total profit
- $43,151
- Equity at exit
- $248,577
Cash invested: $805,000 (down + closing). Projections, not guarantees.
Landlord ↔ Tenant lean methodology
- Overall (STATE)
- 27 Tenant-Leaning
- State Connecticut
- 27 Tenant-Leaning · D+7
- County
- — inherits STATE
- City
- — inherits STATE
ZIP-level market 06883
- Active inventory
- 73
- Price-to-rent
- 8.3×
Monthly cashflow live
- Estimated rent
- $28,846 medium interval (Pro) →
- Mortgage (P&I)
- −$15,077
- Tax from tax record
- −$3,257 /mo · $39,083/yr
- Insurance
- −$1,198
- HOA
- −$0
- Vacancy / Maint / Mgmt
- −$6,058
- Net cashflow
- $3,257
Break-even live
Sensitivity live
| Price | -10% $4,884 | -5% $4,070 | +0% $3,257 | +5% $2,443 | +10% $1,629 |
|---|---|---|---|---|---|
| Rent | -10% $978 | -5% $2,117 | +0% $3,257 | +5% $4,396 | +10% $5,535 |
| Rate | -1.0pp $4,704 | -0.5pp $3,988 | base $3,257 | +0.5pp $2,512 | +1.0pp $1,754 |
UW: 25.0% down · 7.5% · 30yr · 1.5% tax · 5.0% vac · 8.0% maint · 8.0% mgmt
Financing live
Cash to close
- Down payment
- $718,750
- Closing costs
- $86,250
- Reserves months
- —
- Total cash needed
- —
Loan-product check · same deal, 3 products live
Conventional
25% down · 7.5% · 30yr
- Down + closing
- —
- Monthly P&I
- —
- Monthly cashflow
- —
- DSCR
- —
- Eligible?
- —
Personal DTI + credit; lowest rate.
DSCR
20% down · 8.5% · 30yr
- Down + closing
- —
- Monthly P&I
- —
- Monthly cashflow
- —
- DSCR
- —
- Eligible?
- —
No personal income docs; deal must DSCR.
Hard money
10% down · 12.0% · 12mo
- Down + closing
- —
- Monthly P&I
- —
- Monthly cashflow
- —
- DSCR
- —
- Eligible?
- —
Short-term bridge; refi at stabilization.
Rent comps 2 comps
| Address | Beds | Baths | Sqft | Rent | $/sqft | DOM | Units | Dist |
|---|---|---|---|---|---|---|---|---|
| 37 Beaverbrook Rd Weston, CT | 5.0 | 4.5 | 6734 | $35,000 | $5.20 | 44d | 1 | 0.78mi |
| 29 Rogues Rdg Weston, CT | 6.0 | 6.5 | 7649 | $17,000 | $2.22 | 3d | 1 | 1.44mi |
Listing history 14 events
-
2026-06-10statusdays on market $2,875,000 Active 1 DOM
-
2026-06-09days on market $2,875,000 Coming Soon 12 DOM
-
2026-06-08days on market $2,875,000 Coming Soon 11 DOM
-
2026-06-07days on market $2,875,000 Coming Soon 10 DOM
-
2026-06-03days on market $2,875,000 Coming Soon 6 DOM
-
2026-06-03days on market $2,875,000 Coming Soon 5 DOM
-
2026-06-01days on market $2,875,000 Coming Soon 4 DOM
-
2026-05-31days on market $2,875,000 Coming Soon 3 DOM
-
2026-05-29historical $2,875,000
-
2007-06-25soldstatus $2,360,000
-
2007-06-25soldstatus $2,360,000
-
2007-06-22soldstatus $2,360,000
-
2007-03-12$2,597,000
-
2000-11-13soldstatus $459,000
ⓘ Source: listings_history table (triggers on properties + properties_extension) + one-shot
backfill from property_details.listing_events for pre-trigger history.
Tax reassessment forecast CT · Partial reset (capped growth)
- Current annual tax
- $39,083 · $3,257/mo
- Projected year-2 tax
- $50,304 · $4,192/mo
- Expected delta
- +$11,221/yr (+$935/mo · 28.7%)
ⓘ Screening estimate from a state-policy table — verify with the county assessor before closing.
Climate risk First Street
- Flood 1/10 Low FEMA zone X (unshaded) · 0% chance over 30 yrs
- Wildfire 1/10 Low
- Heat 5/10 Major 7 d/yr ≥99°F today · 15 d/yr by 30 yrs out
- Wind 6/10 Major 27% chance of damaging wind over 30 yrs
- Air quality 4/10 Moderate 3 unhealthy d/yr today · 5 by 30 yrs out
Nearby sold comps map
Loading sold comps map…
Walkable amenities ~0.75 mi
Loading nearby amenities…
Taxation est. · year 1
- Rental income
- $346,151
- − Mortgage interest
- −$161,045
- − Property taxes
- −$39,083
- − Insurance
- −$14,375
- − Repairs & maintenance
- −$27,692
- − Management
- −$27,692
- − Depreciation
- −$83,636
- Taxable loss
- −$7,372
- Est. tax savings @ 24.0%
- +$1,769
- After-tax cash flow
- $40,849/yr
For passive investors: Depreciation is non-cash, so a rental often shows a tax loss while cash-flowing — sheltering income. Rental losses are passive: they offset passive income freely, and up to $25,000/yr can offset ordinary (W-2) income if you actively participate and your MAGI is under $100k (phasing out to $0 by $150k); unused losses carry forward. On sale, claimed depreciation is recaptured at up to 25%, and gains may owe capital-gains tax (a 1031 exchange can defer both). Figures are a year-1 estimate at your 24.0% rate — not tax advice; consult a CPA.
Schools (NCES district)
- District
- Weston School District
- NCES district ID
- 0905010
- Math proficiency
- 68% ▼ -6.00%
- Reading proficiency
- 77% ▼ -1.00%
- Median HH income
- $194,414
- Composite
- 75.21/100
- National rank
- #137
- State rank
- #4 of 153 in CT
Livability — Weston
No livability data for this city. (Only ~50 U.S. cities are tracked.)
Census & demographics
- Population (ZIP)
- 10,335
Population outlook (Western Connecticut County) Hauer SSP2
- By 2040
- 685,031
Race, ethnicity, and origin ACS 2023
- Neighborhood character
- Predominantly White (78%)
- Race & ethnicity
- White 78% Two or more races 10% Hispanic / Latino 9% Asian 5% Black 3%
- Hispanic origin (detail)
- Mexican 1% Puerto Rican 2% Dominican 1% Salvadoran 2%
- Common ancestry
- Romanian 7% Scotch-Irish 5% Italian 5%
- Foreign-born
- 16% · Canada, China, Dominican Republic
- Languages at home
- 83% English-only · Spanish 5% Chinese 3% Other Indo-European 3%
Political lean MEDSL · Western Connecticut
- 2024 margin
- D (+19.1) · D 58.8% · R 39.7% · Other 1.6%
- All cycles
- 2024: D+19.1
Not yet ingested
- Civics
- —
Market trends
- HPI YoY
- ▼ -316.44%
- Current HPI
- 208.835
- Rent YoY
- —
- Metro
- —
- State GDP YoY
- ▲ 1.06%
- F500 in state
- 38
Industry mix (Fortune 500 HQ in CT)
| Industry | F500 HQs | Revenue |
|---|---|---|
| Industrial Machinery | 4 | $38B |
|
||
| Insurance | 3 | $71B |
|
||
| Financial Services | 2 | $25B |
|
||
| Transportation / Logistics | 2 | $18B |
|
||
| Healthcare | 1 | $247B |
|
||
| Telecommunications | 1 | $55B |
|
||
Price history
+526.4% since first listed6 events — show timeline
- 2026-05-29 Coming Soon $2,875,000 Smart MLS
- 2007-06-25 Sold (Public Records) $2,360,000 Public Records
- 2007-06-25 Sold (Public Records) $2,360,000 Public Records
- 2007-06-22 Sold (MLS) $2,360,000 Smart MLS
- 2007-03-12 Listed $2,597,000 Smart MLS
- 2000-11-13 Sold (Public Records) $459,000 Public Records
Property tax history
+0.8%/yrLatest (2023): $39,083 · +0.3% YoY. Source: county tax records.
Cash-flow waterfall
monthlySold comps — $/sqft
last 12 mo · ≤1 miLoading sold comps…