 Duplex
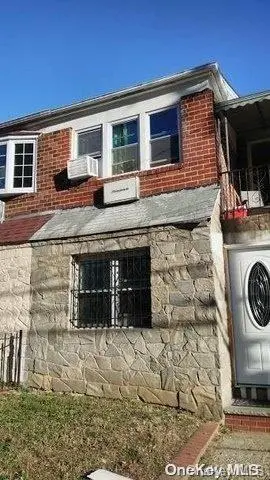
470 Beach 22nd St · New York, NY
Flood risk 1/10 · Minimal
- FEMA flood zone
- X (unshaded)
- Chance of flooding over 30 yrs
- 0.0%
- Est. flood insurance / yr
- $507 – $1,088
Fire risk 1/10 · Minimal
- Est. fire insurance / yr
- $691 – $1,283
Heat risk 6/10 · Moderate
- Hot days now (above 95°F)
- 7 days/yr
- Hot days in 30 yrs
- 16 days/yr
Wind risk 6/10 · Moderate
- Chance of severe wind over 30 yrs
- 77.0%
Air-quality risk 3/10 · Minor
- Unhealthy air days now
- 4 days/yr
- Unhealthy air days in 30 yrs
- 4 days/yr
Risk factors via First Street. Map © Google.
Why this score? — see what drove the B- grade
The composite is a weighted blend of 9 inputs, each scored 0–100. Each bar is that input's sub-score; the figure is the points it added to the 100-point composite (weight × sub-score).
- Cash flow +25.5/30.0
- ARV discount +13.0/15.0
- DSCR +8.5/10.0
- 1% rule +6.0/10.0
- Schools +5.0/10.0
- Livability +3.8/5.0
- Rent growth +2.5/5.0
- Condition / age +2.5/5.0
- Appreciation +0.0/10.0
$625,000
🖨 Deal sheet (PDF) 📄 Offer letter ✓ Due diligence
Multi-family units
County records classify this as Multi-Family (2-4 Unit). Listing-text estimate: 2 units. confirmed
Listing remarks
Welcome to this legal 2-family home. Similar setup to a mother-daughter with each unit containing a separate entrance. Both units are still in pristine condition from being renovated in 2014. The first level contains three oversized bedrooms, living room, kitchen and one full bathroom. The second level consists of a master bedroom with a half bathroom. Two decent sized bedrooms, full bathroom, living room, kitchen and a balcony. Party driveway leading to your backyard oasis with endless possibilities. Close to beach, schools, grocery stores, hospital etc. ., Additional information: Separate Hotwater Heater:Y
Key facts
- 2,105 sq ft lot
- Built 1950
- Listed 12 days
Neighborhood map
What this means for you Summary
Snapshot
- This is a 2 × 3-bed/1.8-bath units multifamily listed at $625k.
Deal economics
- At list price, monthly cash flow is $1k ($18k/yr) — positive. Per door: $732/mo.
- The deal already cash-flows at list — no discount required.
- Meets the 1% rule at list price ($7k rent vs $625k).
- Cap rate 9.1% vs local median 2.6% in New York — top-decile yield for the area; either an underpriced asset or a hidden risk that comps aren't pricing in. Stress-test before assuming the spread holds.
Location & tenants
- Location reads 75/100 on livability (#268 in NY, #4,188 nationally) — a middle-class / working-renter tenant base. Strengths: amenities A+, commute A+, health & safety A; Watch: crime F, cost of living F.
- Market conditions: 140 active listings in the ZIP; 1 comparable units currently listed for rent nearby; 5,302 units permitted in Queens County in 2024 (4,918 in 5+ unit buildings).
- At $6,853/mo this rent would consume 146% of the median local household income ($56k/yr) (locally 4702% of renters already pay >50% of income on rent) — very limited rent-growth headroom before tenants either downsize or default.
Forward outlook
- Local home prices are declining (-3.0%/yr); year-one equity from $4k of loan paydown is wiped out by about $19k of value loss. Plan a longer hold.
- Queens County population projected at +16% by 2050 — long-run rental-demand tailwind backs the buy-and-hold thesis.
Negotiation context
- Only 12 days on market — expect competitive offers; lowballing is unlikely to land.
- 3 sale attempts since 13y ago with the ask held roughly flat each time — persistent listings suggest the price (not the market) is what's stuck; bring a comps-based counter.
Risks & watch-outs
- Watch-outs: built in 1950 — expect roof / HVAC / electrical / plumbing capex.
- Climate carrying-cost: major wind risk, 77% chance of damaging wind over 30y; extreme-heat days projected 7→16/yr by 2055 (HVAC capex compounding) — expect insurance premiums to compound above CPI over the hold.
Questions for the listing agent
- Can we see the unit-by-unit rent roll, current vacancy, and any below-market leases? What's the average tenancy length?
- What capital expenditures (roof, boiler, parking lot, exteriors) have been made in the last 5 years, and what's planned in the next 2?
- Built in 1950 — when were the roof, HVAC, electrical panel, plumbing, and water heater last replaced?
- Is there a deadline driving the sale (1031 exchange, divorce, estate, relocation)? That informs how much negotiation room exists.
- Schools are B-rated — typically a magnet for longer-tenancy family renters. What's the average tenant stay here, and is there a school-zone premium baked into asking?
- Crime grade is F in this area — have there been break-ins, vandalism, or insurance claims at this property in the last 3 years? What carrier currently insures it and at what premium?
- What's the average days-on-market for RENTAL listings here right now (not sales)? A rising rental-DOM trend means longer vacancies and softer asking-rent achievability than the comps imply.
- What's the recent tenant-quality profile in this submarket — average credit score on applications, eviction rate, late-payment / NSF rate, and stable-employment percentage? A property-management company in the area should have these aggregated.
- How much new apartment / multifamily construction is in the pipeline within 1–3 miles? Heavy new supply (>2% of stock underway) typically softens rents 12–24 months out; light construction supports rent growth.
Investment metrics
- 1% rule
- 1.10% ✓
- Cap rate
- 9.11%
- Cash-on-cash
- 10.05%
- DSCR
- 1.45
- GRM
- 7.6
CMA / ARV
- ARV (on-the-fly)
- $711,708
- Comps found
- 7
Show comp detail 7 sales within ~0.75 mi
| Address | Dist | Beds/Ba | Sqft | Sold | Price | $/sf | Match |
|---|---|---|---|---|---|---|---|
| 636 Beach 22nd St | 0.16mi | 6/2.0 | 1,924 (+3%) | 7mo | $680,000 | $353 | 75 |
| 661 Grassmere Ter | 0.17mi | 6/5.0 | 2,000 (+7%) | 9mo | $1,165,000 | $583 | 67 |
| 2407 Brookhaven Ave | 0.25mi | 6/4.0 | 2,040 (+9%) | 7mo | $777,000 | $381 | 66 |
| 1120 Beach Channel Dr | 0.32mi | 6/4.0 | 2,073 (+11%) | 1mo | $665,000 | $321 | 64 |
| 598 Beach 19th St | 0.22mi | 5/2.0 (-1) | 2,106 (+13%) | 4mo | $800,000 | $380 | 54 |
| 1125 Gipson St | 0.47mi | 6/4.0 | 2,120 (+14%) | 5mo | $820,000 | $387 | 50 |
| 1445 Gipson St | 0.71mi | 7/4.0 (+1) | 2,096 (+12%) | 4mo | $837,000 | $399 | 37 |
Match score weights: distance 35% · size 25% · config 20% · recency 20%. Top-matched comps best support the ARV.
Projected returns pro-forma
-3.0% appreciation · 3.0% rent growth · sell at horizon
- IRR
- -1.2%
- Equity multiple
- 0.95×
- Total profit
- $-8,099
- Equity at exit
- $93,190
- IRR
- 8.4%
- Equity multiple
- 1.64×
- Total profit
- $112,585
- Equity at exit
- $54,039
Cash invested: $175,000 (down + closing). Projections, not guarantees.
Landlord ↔ Tenant lean methodology
- Overall (CITY)
- 0 Strongly Tenant-Friendly
- State New York
- 15 Strongly Tenant-Friendly · D+10
- County
- — inherits STATE
- City New York
- 0 Strongly Tenant-Friendly · D+34
ZIP-level market 11691
- Active inventory
- 140
- Price-to-rent
- 15.2×
Monthly cashflow live
- Estimated rent
- $6,853 medium interval (Pro) →
- Mortgage (P&I)
- −$3,278
- Tax from tax record
- −$411 /mo · $4,931/yr
- Insurance
- −$260
- HOA
- −$0
- Vacancy / Maint / Mgmt
- −$1,439
- Net cashflow
- $1,465
Break-even live
Sensitivity live
| Price | -10% $1,819 | -5% $1,642 | +0% $1,465 | +5% $1,288 | +10% $1,111 |
|---|---|---|---|---|---|
| Rent | -10% $924 | -5% $1,194 | +0% $1,465 | +5% $1,736 | +10% $2,006 |
| Rate | -1.0pp $1,780 | -0.5pp $1,624 | base $1,465 | +0.5pp $1,303 | +1.0pp $1,138 |
2-unit breakdown (identical units grouped — click to expand)
| Units | Beds | Baths | Est. rent |
|---|---|---|---|
| 2× units | 3 | 1.8 | $6,852 |
| #1 | 3 | 1.8 | $3,426 |
| #2 | 3 | 1.8 | $3,426 |
| Total (2 units) | $6,853 | ||
UW: 25.0% down · 7.5% · 30yr · 1.5% tax · 5.0% vac · 8.0% maint · 8.0% mgmt
Financing live
Cash to close
- Down payment
- $156,250
- Closing costs
- $18,750
- Reserves months
- —
- Total cash needed
- —
Loan-product check · same deal, 3 products live
Conventional
25% down · 7.5% · 30yr
- Down + closing
- —
- Monthly P&I
- —
- Monthly cashflow
- —
- DSCR
- —
- Eligible?
- —
Personal DTI + credit; lowest rate.
DSCR
20% down · 8.5% · 30yr
- Down + closing
- —
- Monthly P&I
- —
- Monthly cashflow
- —
- DSCR
- —
- Eligible?
- —
No personal income docs; deal must DSCR.
Hard money
10% down · 12.0% · 12mo
- Down + closing
- —
- Monthly P&I
- —
- Monthly cashflow
- —
- DSCR
- —
- Eligible?
- —
Short-term bridge; refi at stabilization.
Rent comps 1 comps
| Address | Beds | Baths | Sqft | Rent | $/sqft | DOM | Units | Dist |
|---|---|---|---|---|---|---|---|---|
| 94 Roger Ave Inwood, NY | 5.0 | 3.0 | 2328 | $4,800 | $2.06 | 45d | 1 | 1.07mi |
Listing history 10 events
-
2025-02-21soldstatus $590,000
-
2024-02-29status Pending
-
2024-02-17$625,000 Active
-
2014-10-27historical
-
2014-10-02soldstatus $347,000
-
2013-12-20$470,000
-
2013-12-13historical
-
2013-09-13$449,000
-
2012-09-07soldstatus $150,000
-
2008-01-31soldstatus $560,000
ⓘ Source: listings_history table (triggers on properties + properties_extension) + one-shot
backfill from property_details.listing_events for pre-trigger history.
Tax reassessment forecast NY · Partial reset (capped growth)
- Current annual tax
- $4,931 · $411/mo
- Projected year-2 tax
- $7,747 · $646/mo
- Expected delta
- +$2,816/yr (+$235/mo · 57.1%)
ⓘ Screening estimate from a state-policy table — verify with the county assessor before closing.
Climate risk First Street
- Flood 1/10 Low FEMA zone X (unshaded) · 0% chance over 30 yrs
- Wildfire 1/10 Low
- Heat 6/10 Major 7 d/yr ≥95°F today · 16 d/yr by 30 yrs out
- Wind 6/10 Major 77% chance of damaging wind over 30 yrs
- Air quality 3/10 Moderate 4 unhealthy d/yr today · 4 by 30 yrs out
Nearby sold comps map
Loading sold comps map…
Walkable amenities ~0.75 mi
Loading nearby amenities…
Taxation est. · year 1
- Rental income
- $82,236
- − Mortgage interest
- −$35,010
- − Property taxes
- −$4,931
- − Insurance
- −$3,125
- − Repairs & maintenance
- −$6,579
- − Management
- −$6,579
- − Depreciation
- −$18,182
- Taxable income
- $7,830
- Est. tax owed @ 24.0%
- −$1,879
- After-tax cash flow
- $15,700/yr
For passive investors: Depreciation is non-cash, so a rental often shows a tax loss while cash-flowing — sheltering income. Rental losses are passive: they offset passive income freely, and up to $25,000/yr can offset ordinary (W-2) income if you actively participate and your MAGI is under $100k (phasing out to $0 by $150k); unused losses carry forward. On sale, claimed depreciation is recaptured at up to 25%, and gains may owe capital-gains tax (a 1031 exchange can defer both). Figures are a year-1 estimate at your 24.0% rate — not tax advice; consult a CPA.
Schools (NCES district)
No district data.
Livability — New York
- Score
- 75/100
- State rank
- #268
- US rank
- #4188
Category grades
Schools grade is shown separately in the Schools card above.
Census & demographics
- Census place
- New York, NY
- County
- Queens County · 1,914,869 people
- City population
- 7,731,280
- Metro
- New York-Newark-Jersey City, NY-NJ-PA
- Population (ZIP)
- 69,359
- Household income
- $56,135
- Rent vs Own
- Severe rent burden
- 4702.0
Population outlook (Queens County) Hauer SSP2
- Today (2025)
- 2,546,320 people
- By 2030
- 2,643,059 · +3.8%
- By 2040
- 2,815,563 · +10.6%
- By 2050
- 2,944,423 · +15.6%
- By 2075
- 3,123,338 · +22.7%
- By 2100
- 3,098,688 · +21.7%
Race, ethnicity, and origin ACS 2023
- Neighborhood character
- Highly diverse neighborhood (Simpson 0.71)
- Race & ethnicity
- Black 40% Hispanic / Latino 26% White 24% Two or more races 12% Asian 4%
- Hispanic origin (detail)
- Puerto Rican 4% Dominican 5%
- Common ancestry
- Hispanic 3% Italian 2% Romanian 2%
- Foreign-born
- 35% · Canada, China, Jamaica
- Languages at home
- 66% English-only · Spanish 21% French/Haitian/Cajun 2% Russian/Polish/Slavic 2%
Political lean MEDSL · Queens
- 2024 margin
- Strong D (+24.6) · D 62.3% · R 37.7%
- 2008→2024 swing
- -26.2pp toward R · 2008: 50.8pp · 2024: 24.6pp
- All cycles
- 2024: D+24.6 2020: D+45.2 2016: D+53.4 2012: D+58.5 2008: D+50.8
Not yet ingested
- Civics
- —
Market trends
- HPI YoY
- ▼ -397.66%
- Current HPI
- 281.4044
- Rent YoY
- —
- Metro
- New York-Newark-Jersey City, NY-NJ-PA
- State GDP YoY
- ▲ 2.60%
- F500 in state
- 92
Industry mix (Fortune 500 HQ in NY)
| Industry | F500 HQs | Revenue |
|---|---|---|
| Financial Services | 10 | $950B |
|
||
| Consumer Goods | 9 | $162B |
|
||
| Insurance | 4 | $225B |
|
||
| Telecommunications | 2 | $144B |
|
||
| Pharmaceuticals | 2 | $112B |
|
||
| Media / Entertainment | 2 | $69B |
|
||
Price history
+5.4% since first listed10 events — show timeline
- 2025-02-21 Sold (Public Records) $590,000 Public Records
- 2024-02-29 Pending — OneKey® MLS as Distributed by MLS Grid
- 2024-02-17 Listed $625,000 OneKey® MLS as Distributed by MLS Grid
- 2014-10-27 Listing Removed — OneKey® MLS as Distributed by MLS Grid
- 2014-10-02 Sold (Public Records) $347,000 Public Records
- 2013-12-20 Listed $470,000 OneKey® MLS as Distributed by MLS Grid
- 2013-12-13 Listing Removed — OneKey® MLS as Distributed by MLS Grid
- 2013-09-13 Listed $449,000 OneKey® MLS as Distributed by MLS Grid
- 2012-09-07 Sold (Public Records) $150,000 Public Records
- 2008-01-31 Sold (Public Records) $560,000 Public Records
Property tax history
+3.7%/yrLatest (2025): $4,931 · +3.4% YoY. Source: county tax records.
Cash-flow waterfall
monthlySold comps — $/sqft
last 12 mo · ≤1 miLoading sold comps…