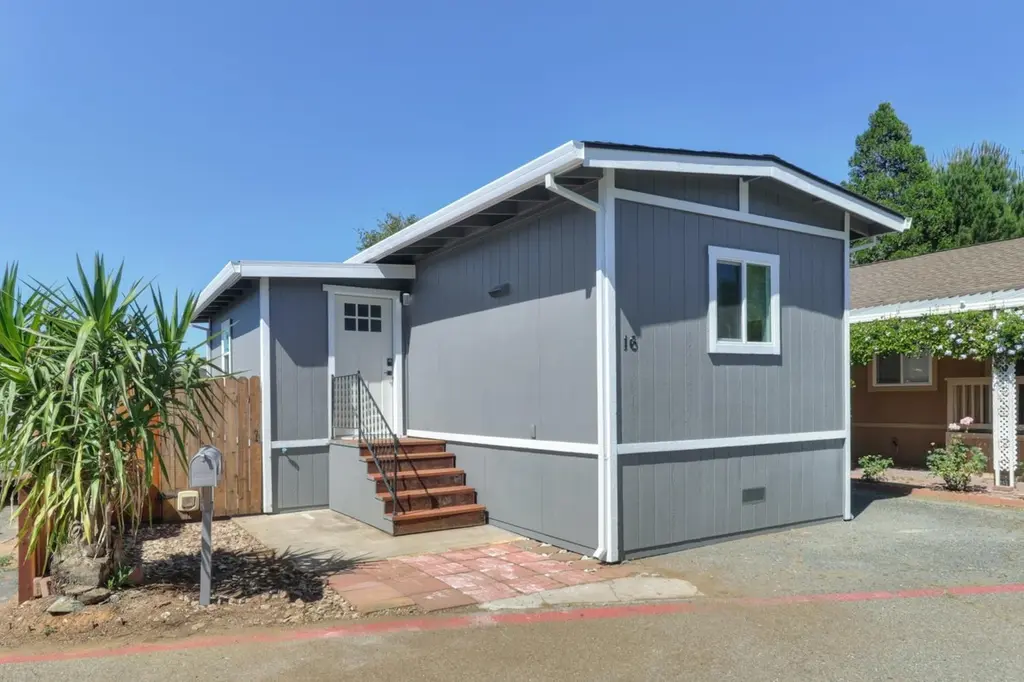
1130 White Rock Rd #16 · El Dorado Hills, CA
Flood risk 6/10 · Moderate
- FEMA flood zone
- X (unshaded)
- Chance of flooding over 30 yrs
- 0.74%
- Est. flood insurance / yr
- $507 – $1,088
Fire risk 9/10 · Severe
- Est. fire insurance / yr
- $659 – $1,223
Heat risk 7/10 · Major
- Hot days now (above 102°F)
- 7 days/yr
- Hot days in 30 yrs
- 16 days/yr
Wind risk 1/10 · Minimal
- Chance of severe wind over 30 yrs
- —
Air-quality risk 10/10 · Severe
- Unhealthy air days now
- 25 days/yr
- Unhealthy air days in 30 yrs
- 30 days/yr
Risk factors via First Street. Map © Google.
Why this score? — see what drove the B grade
The composite is a weighted blend of 9 inputs, each scored 0–100. Each bar is that input's sub-score; the figure is the points it added to the 100-point composite (weight × sub-score).
- Cash flow +30.0/30.0
- 1% rule +10.0/10.0
- DSCR +10.0/10.0
- ARV discount +7.5/15.0
- Schools +5.1/10.0
- Rent growth +3.4/5.0
- Livability +3.1/5.0
- Condition / age +2.5/5.0
- Appreciation +0.0/10.0
$165,000
🖨 Deal sheet 📄 Offer letter ✓ Due diligence
Listing remarks
This fabulous mobile home has been completely remodeled from top to bottom. Updates include a new roof, insulation, siding, sheetrock, appliances, heating and air units, electrical, and plumbing. This property is sure to impress. The home features an open-concept living room and gourmet kitchen with quartz slab countertops, stainless steel appliances, and beautiful white cabinetry. The private primary suite offers an elegant en-suite bathroom. Stylish laminate flooring is used extensively throughout the home. Outside, you'll find a large backyard with a storage shed, along with parking for two cars. This 2-bedroom, 2-bath home is truly a must-see property.
Key facts
- Insulation
- Appliances
- Sheetrock
Tags
Property features AI
Finance
- Other: Located at 1130 White Rock Rd #16, El Dorado Hills, CA 95762; Directions: Take Hwy 50 to exit on Latrobe Road, left on White Rock Road to the mobile home park address.
- Financial info:
- HOA & community: No homeowners association; Not a senior community
Exterior
- Parking:
- Security:
- Utilities: Propane; 220-volt outlet in laundry; Public sewer; Public water via water district
- Home design: Manufactured in park (single wide); Marlette make; Updated/remodeled; Built in 1968
- Construction: Composition roof; Skirting: Other
- Exterior features: Fenced backyard; Regular-shaped lot; Shed(s) on the property
Interior
- Kitchen: Free-standing gas range; Free-standing electric oven; Free-standing refrigerator; Dishwasher; Disposal; Microwave; Slab countertops; Breakfast area
- Bedrooms: 2 bedrooms (includes master bedroom)
- Flooring: Laminate flooring
- Bathrooms: 2 full bathrooms; Tubs with shower over
- Heating & cooling: Central heating; Central cooling; Ceiling fans; Wall-mounted units; Multiple HVAC units
- Interior features: Updated/remodeled interior; Dual pane full windows; Great room living area; Breakfast area and slab countertops in the kitchen; Kitchen and family room combined with additional space in the kitchen
- Laundry & utility: Stacked washer and dryer included; Laundry located inside; Gas water heater
Neighborhood map
What this means for you Summary
Snapshot
- This is a 2-bed/2.0-bath manufactured listed at $165k.
Deal economics
- At list price, monthly cash flow is $887 ($11k/yr) — positive.
- The deal already cash-flows at list — no discount required.
- Meets the 1% rule at list price ($3k rent vs $165k).
- Cap rate 12.7% vs local median 2.2% in El Dorado Hills — top-decile yield for the area; either an underpriced asset or a hidden risk that comps aren't pricing in. Stress-test before assuming the spread holds.
Location & tenants
- Location reads 61/100 on livability (#530 in CA) — a middle-class / working-renter tenant base. Strengths: employment A+, schools A, housing A; Watch: amenities F, commute F, cost of living F.
- El Dorado Union High (suburban): math 44% / reading 69% proficiency, ranked #89 of 517 in CA (top 17%) — acceptable for families but not a draw, mixed tenant base, ~2y average lease.
- Market conditions: Rents rising (+3.4%/yr); 629 active listings in the ZIP; 4 comparable units currently listed for rent nearby; rentals leasing fast (median 2d on market — plan ~1-2 weeks tenant-placement turnaround); high-income renter base; 437 units permitted in El Dorado County in 2024 (0 in 5+ unit buildings).
Forward outlook
- Local home prices are declining (-3.0%/yr); year-one equity from $1k of loan paydown is wiped out by about $5k of value loss. Plan a longer hold.
- El Dorado County population projected to shrink 3% by 2050 — rents likely to lag national; underwrite the cash flow, not the appreciation.
- At projected returns (-3.0% appreciation + 3.4% rent growth), your $46k cash investment doubles in ~6 years — after that, you're playing with house money.
Negotiation context
- Only 7 days on market — expect competitive offers; lowballing is unlikely to land.
Risks & watch-outs
- Climate carrying-cost: major flood risk; severe wildfire risk; extreme-heat days projected 7→16/yr by 2055 (HVAC capex compounding) — expect insurance premiums to compound above CPI over the hold.
Questions for the listing agent
- Built in 1968 — when were the roof, HVAC, electrical panel, plumbing, and water heater last replaced?
- Is there a deadline driving the sale (1031 exchange, divorce, estate, relocation)? That informs how much negotiation room exists.
- Schools are A-rated — typically a magnet for longer-tenancy family renters. What's the average tenant stay here, and is there a school-zone premium baked into asking?
- What's the average days-on-market for RENTAL listings here right now (not sales)? A rising rental-DOM trend means longer vacancies and softer asking-rent achievability than the comps imply.
- What's the recent tenant-quality profile in this submarket — average credit score on applications, eviction rate, late-payment / NSF rate, and stable-employment percentage? A property-management company in the area should have these aggregated.
- How much new for-sale + rental construction is in the pipeline within 1–3 miles? Heavy new supply typically softens prices + rents 12–24 months out; constrained supply supports both.
Investment metrics
- 1% rule
- 1.56% ✓
- Cap rate
- 12.74%
- Cash-on-cash
- 23.03%
- DSCR
- 2.02
- GRM
- 5.4
CMA / ARV
- ARV (on-the-fly)
- $92,400
- Comps found
- 3
Show comp detail 3 sales within ~0.75 mi
| Address | Dist | Beds/Ba | Sqft | Sold | Price | $/sf | Match |
|---|---|---|---|---|---|---|---|
| 1130 White Rock Rd #19 | 0.05mi | 3/2.0 (+1) | 848 (+3%) | 12mo | $132,000 | $156 | 78 |
| 1130 White Rock Rd #25 | 0.02mi | 2/1.5 | 720 (-13%) | 1mo | $20,000 | $28 | 75 |
| 1130 White Rock Rd #58 | 0.10mi | 2/1.0 | 804 (-2%) | 22mo | $90,000 | $112 | 69 |
Match score weights: distance 35% · size 25% · config 20% · recency 20%. Top-matched comps best support the ARV.
Projected returns pro-forma
-3.0% appreciation · 3.41% rent growth · sell at horizon
- IRR
- 16.5%
- Equity multiple
- 1.67×
- Total profit
- $30,844
- Equity at exit
- $24,602
- IRR
- 25.4%
- Equity multiple
- 3.25×
- Total profit
- $104,139
- Equity at exit
- $14,266
Cash invested: $46,200 (down + closing). Projections, not guarantees.
Landlord ↔ Tenant lean methodology
- Overall (STATE)
- 18 Strongly Tenant-Friendly
- State California
- 18 Strongly Tenant-Friendly · D+13
- County
- — inherits STATE
- City
- — inherits STATE
ZIP-level market 95762
- Rents YoY
- 3.4%
- Active inventory
- 629
- Price-to-rent
- 5.4×
Monthly cashflow live
- Estimated rent
- $2,566 medium interval (Pro) →
- Mortgage (P&I)
- −$865
- Tax est. 1.5%
- −$206 /mo · $2,475/yr
- Insurance
- −$69
- HOA
- −$0
- Vacancy / Maint / Mgmt
- −$539
- Net cashflow
- $887
Break-even live
UW: 25.0% down · 7.5% · 30yr · 1.5% tax · 5.0% vac · 8.0% maint · 8.0% mgmt
Financing live
Cash to close
- Down payment
- $41,250
- Closing costs
- $4,950
- Reserves months
- —
- Total cash needed
- —
Loan-product check · same deal, 3 products live
Conventional
25% down · 7.5% · 30yr
- Down + closing
- —
- Monthly P&I
- —
- Monthly cashflow
- —
- DSCR
- —
- Eligible?
- —
Personal DTI + credit; lowest rate.
DSCR
20% down · 8.5% · 30yr
- Down + closing
- —
- Monthly P&I
- —
- Monthly cashflow
- —
- DSCR
- —
- Eligible?
- —
No personal income docs; deal must DSCR.
Hard money
10% down · 12.0% · 12mo
- Down + closing
- —
- Monthly P&I
- —
- Monthly cashflow
- —
- DSCR
- —
- Eligible?
- —
Short-term bridge; refi at stabilization.
Rent comps 4 comps
| Address | Beds | Baths | Sqft | Rent | $/sqft | DOM | Units | Dist |
|---|---|---|---|---|---|---|---|---|
| 2100 Valley View Pkwy El Dorado Hills, CA | 1.0–3.0 | 1.0–2.0 | 948 | $2,426 | $2.56 | 1d | 13 | 0.18mi |
| 2230 Valley View Pkwy El Dorado Hills, CA | 1.0–2.0 | 1.0–2.0 | 1044 | $2,743 | $2.63 | 1d | 5 | 0.36mi |
| 2230 Valley View Pkwy #318 El Dorado Hills, CA | 1.0 | 1.0 | 871 | $1,950 | $2.24 | 1d | 1 | 0.46mi |
| 300 Moon Cir #333 Folsom, CA | 2.0 | 2.0 | 1031 | $2,145 | $2.08 | 1d | 1 | 1.48mi |
Listing history 12 events
-
2026-06-18days on market $165,000 Active 7 DOM
-
2026-06-17days on market $165,000 Active 6 DOM
-
2026-06-16days on market $165,000 Active 5 DOM
-
2026-06-15days on market $165,000 Active 4 DOM
-
2026-06-13pricedays on market $165,000 Active 2 DOM
-
2026-06-09days on market $175,000 Active 24 DOM
-
2026-06-08days on market $175,000 Active 23 DOM
-
2026-06-07days on market $175,000 Active 22 DOM
-
2026-06-03days on market $175,000 Active 18 DOM
-
2026-06-02days on market $175,000 Active 17 DOM
-
2026-06-01days on market $175,000 Active 16 DOM
-
2026-05-31days on market $175,000 Active 15 DOM
ⓘ Source: listings_history table (triggers on properties + properties_extension) + one-shot
backfill from property_details.listing_events for pre-trigger history.
Climate risk First Street
- Flood 6/10 Major FEMA zone X (unshaded) · 74% chance over 30 yrs
- Wildfire 9/10 Extreme
- Heat 7/10 Severe 7 d/yr ≥102°F today · 16 d/yr by 30 yrs out
- Wind 1/10 Low
- Air quality 10/10 Extreme 25 unhealthy d/yr today · 30 by 30 yrs out
Nearby sold comps map
Loading sold comps map…
Walkable amenities ~0.75 mi
Loading nearby amenities…
Taxation est. · year 1
- Rental income
- $30,791
- − Mortgage interest
- −$9,243
- − Property taxes
- −$2,475
- − Insurance
- −$825
- − Repairs & maintenance
- −$2,463
- − Management
- −$2,463
- − Depreciation
- −$4,800
- Taxable income
- $8,522
- Est. tax owed @ 24.0%
- −$2,045
- After-tax cash flow
- $8,596/yr
For passive investors: Depreciation is non-cash, so a rental often shows a tax loss while cash-flowing — sheltering income. Rental losses are passive: they offset passive income freely, and up to $25,000/yr can offset ordinary (W-2) income if you actively participate and your MAGI is under $100k (phasing out to $0 by $150k); unused losses carry forward. On sale, claimed depreciation is recaptured at up to 25%, and gains may owe capital-gains tax (a 1031 exchange can defer both). Figures are a year-1 estimate at your 24.0% rate — not tax advice; consult a CPA.
Schools (NCES district)
- District
- El Dorado Union High
- NCES district ID
- 0612070
- Math proficiency
- 44% ▼ -11.00%
- Reading proficiency
- 69% ▬ 0.00%
- Median HH income
- $78,936
- Composite
- 50.84/100
- National rank
- #1798
- State rank
- #89 of 517 in CA
Livability — El Dorado Hills
- Score
- 61/100
- State rank
- #530
- US rank
- #17760
Category grades
Schools grade is shown separately in the Schools card above.
Census & demographics
- Census place
- El Dorado Hills, CA
- County
- El Dorado County · 144,198 people
- City population
- 47,657
- Metro
- Sacramento-Roseville-Folsom, CA
- Population (ZIP)
- 47,657
- Household income
- $165,467
- Rent vs Own
- Severe rent burden
- 553.0
Population outlook (El Dorado County) Hauer SSP2
- Today (2025)
- 191,666 people
- By 2030
- 193,662 · +1.0%
- By 2040
- 192,583 · +0.5%
- By 2050
- 185,904 · -3.0%
- By 2075
- 169,543 · -11.5%
- By 2100
- 139,623 · -27.2%
Race, ethnicity, and origin ACS 2023
- Neighborhood character
- Predominantly White (68%)
- Race & ethnicity
- White 68% Asian 13% Two or more races 11% Hispanic / Latino 10% Black 2%
- Hispanic origin (detail)
- Mexican 5%
- Common ancestry
- Italian 3% Portuguese 3% Slovak 2%
- Foreign-born
- 13% · Canada, China, Vietnam
- Languages at home
- 83% English-only · Spanish 3% Other Indo-European 3% Other Asian/Pacific 2%
Political lean MEDSL · El Dorado
- 2024 margin
- R (+12.0) · D 42.6% · R 54.6% · Other 2.8%
- 2008→2024 swing
- -1.5pp toward R · 2008: -10.5pp · 2024: -12.0pp
- All cycles
- 2024: R+12.0 2020: R+8.8 2016: R+13.9 2012: R+18.2 2008: R+10.5
Not yet ingested
- Civics
- —
Market trends
- HPI YoY
- ▼ -437.07%
- Current HPI
- 277.683
- Rent YoY
- ▲ 3.41%
- Metro
- Sacramento-Roseville-Folsom, CA
- State GDP YoY
- ▲ 3.21%
- F500 in state
- 116
Industry mix (Fortune 500 HQ in CA)
| Industry | F500 HQs | Revenue |
|---|---|---|
| Technology | 27 | $1,492B |
|
||
| Financial Services | 3 | $174B |
|
||
| Retail | 3 | $44B |
|
||
| Insurance | 3 | $26B |
|
||
| Media / Entertainment | 2 | $115B |
|
||
| Pharmaceuticals / Biotech | 2 | $62B |
|
||
Cash-flow waterfall
monthlySold comps — $/sqft
last 12 mo · ≤1 miLoading sold comps…