 Multi-family
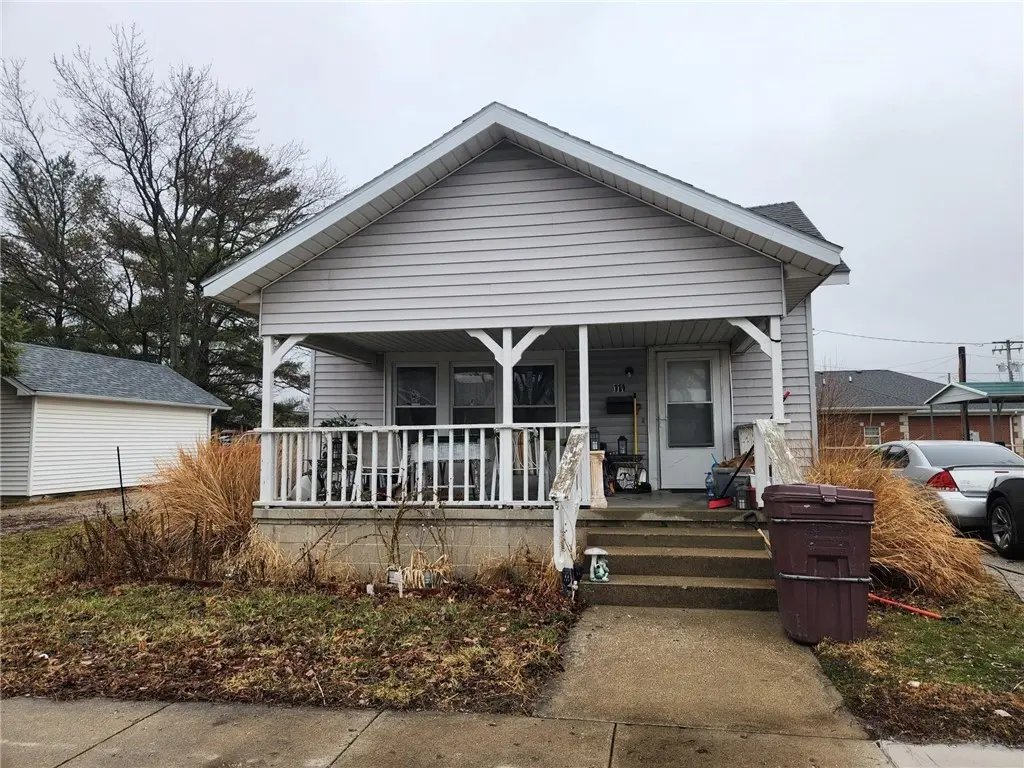
111 W 2nd St · Georgetown, IL
Flood risk 1/10 · Minimal
- FEMA flood zone
- X (unshaded)
- Chance of flooding over 30 yrs
- 0.0%
- Est. flood insurance / yr
- $473 – $860
Fire risk 1/10 · Minimal
- Est. fire insurance / yr
- $804 – $1,492
Heat risk 4/10 · Minor
- Hot days now (above 103°F)
- 7 days/yr
- Hot days in 30 yrs
- 18 days/yr
Wind risk 2/10 · Minimal
- Chance of severe wind over 30 yrs
- 1.0%
Air-quality risk 2/10 · Minimal
- Unhealthy air days now
- 1 days/yr
- Unhealthy air days in 30 yrs
- 1 days/yr
Risk factors via First Street. Map © Google.
Why this score? — see what drove the A- grade
The composite is a weighted blend of 9 inputs, each scored 0–100. Each bar is that input's sub-score; the figure is the points it added to the 100-point composite (weight × sub-score).
- Cash flow +30.0/30.0
- 1% rule +10.0/10.0
- DSCR +10.0/10.0
- Appreciation +10.0/10.0
- ARV discount +7.5/15.0
- Schools +5.0/10.0
- Livability +3.2/5.0
- Rent growth +2.5/5.0
- Condition / age +2.2/5.0
$300,000
🖨 Deal sheet (PDF) 📄 Offer letter ✓ Due diligence
Multi-family units
County records classify this as Multi-Family (5+ Unit). Listing-text estimate: 1 unit. estimate disagrees with records
5+ unit building — per-unit beds/baths from public records are typically unavailable; the breakdown below (if shown) is an estimate from the listing text.
Listing remarks
These 5 homes are being sold as a group they are rental properties - Selling as is 111 W 2nd Street - 2 bedrooms 1 bathroom 309 W 8th Street - 3 bedrooms 1 bathroom 305 W 8th Street - 2 bedrooms 1 bathroom 111 E 16th Street - 3 bedrooms 1 bathroom 213 Vermilion Street - 4 bedrooms 1 bathroom - has new metal roof needs updates Managing Broker Owned
Key facts
- 6,490 sq ft lot
- 2 garage spots
- Built 1930
Property features AI
Exterior
- Parking: Detached garage; 2 garage spaces
- Utilities: Public water; Public sewer
- Home design: Multi-family residential income property; Two levels / 2 stories
- Exterior features: Metal roof; R-1 zoning; 0.15-acre lot
Interior
- Kitchen: Range; Refrigerator
- Heating & cooling: Cooling (other)
- Interior features: Gas water heater; Range; Refrigerator; Has cooling (other)
Neighborhood map
What this means for you Summary
Snapshot
- This is a multifamily listed at $300k. Condition is rated fair.
Deal economics
- At list price, monthly cash flow is $2k ($27k/yr) — positive.
- The deal already cash-flows at list — no discount required.
- Meets the 1% rule at list price ($5k rent vs $300k).
- Recommended offer: $273k (9.0% below list) — sets the bar for market timing.
Location & tenants
- Location reads 63/100 on livability (#783 in IL) — a middle-class / working-renter tenant base. Strengths: cost of living A+, housing A+, crime A-; Watch: employment D+, amenities F, commute F.
- Zoned schools: Pine Crest Elementary School (math 8% / reading 22%, grade F, #1,259 of 2,056 statewide, top 62%, 415 students, 0% FRL); Mary Miller Junior High School (math 8% / reading 22%, grade F, #510 of 665 statewide, top 78%, 196 students, 0% FRL); Georgetown-Ridge Farm High School (math 15% / reading 5%, grade F, #528 of 693 statewide, top 82%, 259 students, 0% FRL).
- Market conditions: 6 comparable units currently listed for rent nearby; rentals at typical pace (median 23d on market — plan ~3-4 weeks tenant-placement turnaround); 8 units permitted in Vermilion County in 2024 (0 in 5+ unit buildings).
Forward outlook
- In year one you build about $32k of equity ($2k loan paydown + $30k appreciation (10.0% local appreciation)).
- Vermilion County population projected at -24% by 2050 — secular population decline; favor cash flow + early exit over multi-decade hold.
- At projected returns (10.0% appreciation + 3.0% rent growth), your $84k cash investment doubles in ~2 years — after that, you're playing with house money.
- By year 2, paydown + projected appreciation supports a ~$52k cash-out refi (75% LTV) — recoverable capital for the next deal without selling this one.
Negotiation context
- It's been on market 109 days — a 9% lower offer ($273k) is reasonable based on typical stale-listing flexibility.
Risks & watch-outs
- Watch-outs: built in 1930 — expect roof / HVAC / electrical / plumbing capex.
Questions for the listing agent
- It's been on market 109 days. Have you received any prior offers? Is the seller open to a 9% concession, seller financing, or rate buy-down credit?
- Have any recent inspections been done? Can we get a copy of the seller's disclosures and any deferred-maintenance estimates?
- Built in 1930 — when were the roof, HVAC, electrical panel, plumbing, and water heater last replaced?
- Why hasn't it sold? Are there any deal-killer items the seller is aware of (foundation, flood, title, zoning, code violations)?
- Is there a deadline driving the sale (1031 exchange, divorce, estate, relocation)? That informs how much negotiation room exists.
- Schools are F-rated, which usually means shorter tenancies and higher turnover. Who's the typical renter profile here, and what's been the actual vacancy rate?
- What's the average days-on-market for RENTAL listings here right now (not sales)? A rising rental-DOM trend means longer vacancies and softer asking-rent achievability than the comps imply.
- What's the recent tenant-quality profile in this submarket — average credit score on applications, eviction rate, late-payment / NSF rate, and stable-employment percentage? A property-management company in the area should have these aggregated.
- How much new apartment / multifamily construction is in the pipeline within 1–3 miles? Heavy new supply (>2% of stock underway) typically softens rents 12–24 months out; light construction supports rent growth.
Investment metrics
- 1% rule
- 1.82% ✓
- Cap rate
- 15.23%
- Cash-on-cash
- 31.90%
- DSCR
- 2.42
- GRM
- 4.6
CMA / ARV
- ARV (median comp)
- $82,110
- List price
- $300,000
- Delta
- 265.36%
- Verdict
- OVERPRICED
- Comps
- 2 within 1.0 mi
Projected returns pro-forma
10.0% appreciation · 3.0% rent growth · sell at horizon
- IRR
- 48.6%
- Equity multiple
- 4.64×
- Total profit
- $305,695
- Equity at exit
- $270,264
- IRR
- 42.4%
- Equity multiple
- 10.39×
- Total profit
- $788,540
- Equity at exit
- $582,834
Cash invested: $84,000 (down + closing). Projections, not guarantees.
Landlord ↔ Tenant lean methodology
- Overall (STATE)
- 43 Moderately Tenant-Leaning
- State Illinois
- 43 Moderately Tenant-Leaning · D+7
- County
- — inherits STATE
- City
- — inherits STATE
ZIP-level market 61846
- Home prices YoY
- 9.4%
- Price-to-rent
- 23.4×
Monthly cashflow live
- Estimated rent
- $5,451 high interval (Pro) →
- Mortgage (P&I)
- −$1,573
- Tax est. 1.5%
- −$375 /mo · $4,500/yr
- Insurance
- −$125
- HOA
- −$0
- Vacancy / Maint / Mgmt
- −$1,145
- Net cashflow
- $2,233
Break-even live
Sensitivity live
| Price | -10% $2,440 | -5% $2,337 | +0% $2,233 | +5% $2,129 | +10% $2,026 |
|---|---|---|---|---|---|
| Rent | -10% $1,802 | -5% $2,018 | +0% $2,233 | +5% $2,448 | +10% $2,664 |
| Rate | -1.0pp $2,384 | -0.5pp $2,309 | base $2,233 | +0.5pp $2,155 | +1.0pp $2,076 |
5-unit breakdown (identical units grouped — click to expand)
| Units | Beds | Baths | Est. rent |
|---|---|---|---|
| 2× units | 2 | 1 | $2,134 |
| #1 | 2 | 1 | $1,067 |
| #3 | 2 | 1 | $1,067 |
| 2× units | 3 | 1 | $2,134 |
| #2 | 3 | 1 | $1,067 |
| #4 | 3 | 1 | $1,067 |
| 1× unit | 4 | 1 | $1,183 |
| Total (5 units) | $5,451 | ||
UW: 25.0% down · 7.5% · 30yr · 1.5% tax · 5.0% vac · 8.0% maint · 8.0% mgmt
Financing live
Cash to close
- Down payment
- $75,000
- Closing costs
- $9,000
- Reserves months
- —
- Total cash needed
- —
Loan-product check · same deal, 3 products live
Conventional
25% down · 7.5% · 30yr
- Down + closing
- —
- Monthly P&I
- —
- Monthly cashflow
- —
- DSCR
- —
- Eligible?
- —
Personal DTI + credit; lowest rate.
DSCR
20% down · 8.5% · 30yr
- Down + closing
- —
- Monthly P&I
- —
- Monthly cashflow
- —
- DSCR
- —
- Eligible?
- —
No personal income docs; deal must DSCR.
Hard money
10% down · 12.0% · 12mo
- Down + closing
- —
- Monthly P&I
- —
- Monthly cashflow
- —
- DSCR
- —
- Eligible?
- —
Short-term bridge; refi at stabilization.
Rent comps 6 comps
| Address | Beds | Baths | Sqft | Rent | $/sqft | DOM | Units | Dist |
|---|---|---|---|---|---|---|---|---|
| 109 E West St Unit 1 Georgetown, IL | 1.0 | 2.0 | 144 | $599 | $4.16 | 23d | 1 | 0.07mi |
| 208 Logan St Georgetown, IL | 3.0 | 1.0 | 1100 | $1,200 | $1.09 | 14d | 1 | 0.15mi |
| 212 Logan St Georgetown, IL | 2.0 | 1.0 | 1000 | $895 | $0.90 | 22d | 1 | 0.16mi |
| 710 Mill St Georgetown, IL | 2.0 | 2.0 | — | $706 | — | 45d | 1 | 0.59mi |
| 710 Mill St Georgetown, IL | 2.0 | 2.0 | — | $1,500 | — | 14d | 1 | 0.59mi |
| 303 W 12th St Georgetown, IL | 3.0 | 1.0 | 1300 | $1,100 | $0.85 | 7d | 1 | 0.73mi |
Listing history 18 events
-
2026-06-21days on market $300,000 Active 109 DOM
-
2026-06-18days on market $300,000 Active 106 DOM
-
2026-06-17days on market $300,000 Active 105 DOM
-
2026-06-16days on market $300,000 Active 104 DOM
-
2026-06-15days on market $300,000 Active 103 DOM
-
2026-06-13days on market $300,000 Active 101 DOM
-
2026-06-09days on market $300,000 Active 97 DOM
-
2026-06-08days on market $300,000 Active 96 DOM
-
2026-06-07days on market $300,000 Active 95 DOM
-
2026-06-04days on market $300,000 Active 92 DOM
-
2026-06-03days on market $300,000 Active 91 DOM
-
2026-06-02days on market $300,000 Active 90 DOM
-
2026-06-01days on market $300,000 Active 89 DOM
-
2026-05-31days on market $300,000 Active 88 DOM
-
2026-05-11price $300,000
-
2026-04-23price $380,000
-
2026-04-15price $400,000
-
2026-03-04$500,000 Active
ⓘ Source: listings_history table (triggers on properties + properties_extension) + one-shot
backfill from property_details.listing_events for pre-trigger history.
Climate risk First Street
- Flood 1/10 Low FEMA zone X (unshaded) · 0% chance over 30 yrs
- Wildfire 1/10 Low
- Heat 4/10 Moderate 7 d/yr ≥103°F today · 18 d/yr by 30 yrs out
- Wind 2/10 Low 100% chance of damaging wind over 30 yrs
- Air quality 2/10 Low 1 unhealthy d/yr today · 1 by 30 yrs out
Nearby sold comps map
Loading sold comps map…
Walkable amenities ~0.75 mi
Loading nearby amenities…
Taxation est. · year 1
- Rental income
- $65,412
- − Mortgage interest
- −$16,805
- − Property taxes
- −$4,500
- − Insurance
- −$1,500
- − Repairs & maintenance
- −$5,233
- − Management
- −$5,233
- − Depreciation
- −$8,727
- Taxable income
- $23,414
- Est. tax owed @ 24.0%
- −$5,619
- After-tax cash flow
- $21,177/yr
For passive investors: Depreciation is non-cash, so a rental often shows a tax loss while cash-flowing — sheltering income. Rental losses are passive: they offset passive income freely, and up to $25,000/yr can offset ordinary (W-2) income if you actively participate and your MAGI is under $100k (phasing out to $0 by $150k); unused losses carry forward. On sale, claimed depreciation is recaptured at up to 25%, and gains may owe capital-gains tax (a 1031 exchange can defer both). Figures are a year-1 estimate at your 24.0% rate — not tax advice; consult a CPA.
Condition & rehab AI · 6 photos
This multi-family property requires significant repairs and updates to its roof, siding, flooring, and interior. A new roof and updates to the exterior and interior would significantly increase its value.
Repairs flagged
- Major roof — Significant wear and tear visible.
- Major siding — Peeling and faded paint.
- Major flooring — Worn and in need of replacement.
- Major interior walls/paint — Poor condition and likely in need of repainting.
- Major HVAC/mechanicals — No specific systems visible, but overall condition suggests need for attention.
Value-add opportunities
- Both New roof — A new roof would significantly improve the home's appearance and value.
- Both Paint and siding repair — Repainting and repairing the siding would enhance curb appeal and value.
- Both Flooring replacement — Replacing worn flooring would improve the home's condition and value.
- Both Interior painting and repairs — Repainting and repairing interior walls would improve the home's condition and value.
- Both HVAC and mechanical updates — Updating HVAC and mechanical systems would improve the home's functionality and value.
Renovation cost estimate screening
| Repair item | Severity | Est. cost |
|---|---|---|
| roof · Significant wear and tear visible. | Major | $15,000–50,000 |
| siding · Peeling and faded paint. | Major | $15,000–50,000 |
| flooring · Worn and in need of replacement. | Major | $15,000–50,000 |
| interior walls/paint · Poor condition and likely in need of repainting. | Major | $15,000–50,000 |
| HVAC/mechanicals · No specific systems visible, but overall condition suggests need for attention. | Major | $15,000–50,000 |
| Total estimated repair cost · 5 items | $75,000–250,000 |
Value-add ROI direction
- Both New roof — A new roof would significantly improve the home's appearance and value. ↑
- Both Paint and siding repair — Repainting and repairing the siding would enhance curb appeal and value. ↑
- Both Flooring replacement — Replacing worn flooring would improve the home's condition and value. ↑
- Both Interior painting and repairs — Repainting and repairing interior walls would improve the home's condition and value. ↑
- Both HVAC and mechanical updates — Updating HVAC and mechanical systems would improve the home's functionality and value. ↑
ⓘ Cost ranges are severity-bucket heuristics (US national rule-of-thumb). Get contractor quotes + a written scope before underwriting a rehab budget.
Schools (NCES district)
No district data.
Livability — Georgetown
- Score
- 63/100
- State rank
- #783
- US rank
- #15620
Category grades
Schools grade is shown separately in the Schools card above.
Census & demographics
- Census place
- Georgetown, IL
- Population (ZIP)
- 4,484
Population outlook (Vermilion County) Hauer SSP2
- Today (2025)
- 72,775 people
- By 2030
- 69,235 · -4.9%
- By 2040
- 62,360 · -14.3%
- By 2050
- 55,539 · -23.7%
- By 2075
- 40,606 · -44.2%
- By 2100
- 26,985 · -62.9%
Race, ethnicity, and origin ACS 2023
- Neighborhood character
- Predominantly White (89%)
- Race & ethnicity
- White 89% Hispanic / Latino 5% Black 5% Two or more races 4%
- Hispanic origin (detail)
- Mexican 5%
- Common ancestry
- Slovak 2% Serbian 1% Romanian 1%
- Foreign-born
- 1% · Canada
- Languages at home
- 99% English-only · Spanish 1%
Political lean MEDSL · Vermilion
- 2024 margin
- Solid R (+35.7) · D 31.4% · R 67.0% · Other 1.6%
- 2008→2024 swing
- -36.2pp toward R · 2008: 0.6pp · 2024: -35.7pp
- All cycles
- 2024: R+35.7 2020: R+32.9 2016: R+29.2 2012: R+15.7 2008: D+0.6
Not yet ingested
- Civics
- —
Market trends
- HPI YoY
- ▲ 21.78%
- Current HPI
- 254.5489
- Rent YoY
- —
- Metro
- —
- State GDP YoY
- ▲ 1.59%
- F500 in state
- 60
Industry mix (Fortune 500 HQ in IL)
| Industry | F500 HQs | Revenue |
|---|---|---|
| Insurance | 4 | $201B |
|
||
| Consumer Goods | 4 | $87B |
|
||
| Industrial Machinery | 3 | $64B |
|
||
| Healthcare | 2 | $55B |
|
||
| Retail / Pharmacy | 1 | $148B |
|
||
| Agriculture / Food | 1 | $86B |
|
||
Price history
-40.0% since first listed4 events — show timeline
- 2026-05-11 Price Changed $300,000 CIBR
- 2026-04-23 Price Changed $380,000 CIBR
- 2026-04-15 Price Changed $400,000 CIBR
- 2026-03-04 Listed $500,000 CIBR
Cash-flow waterfall
monthlySold comps — $/sqft
last 12 mo · ≤1 miLoading sold comps…