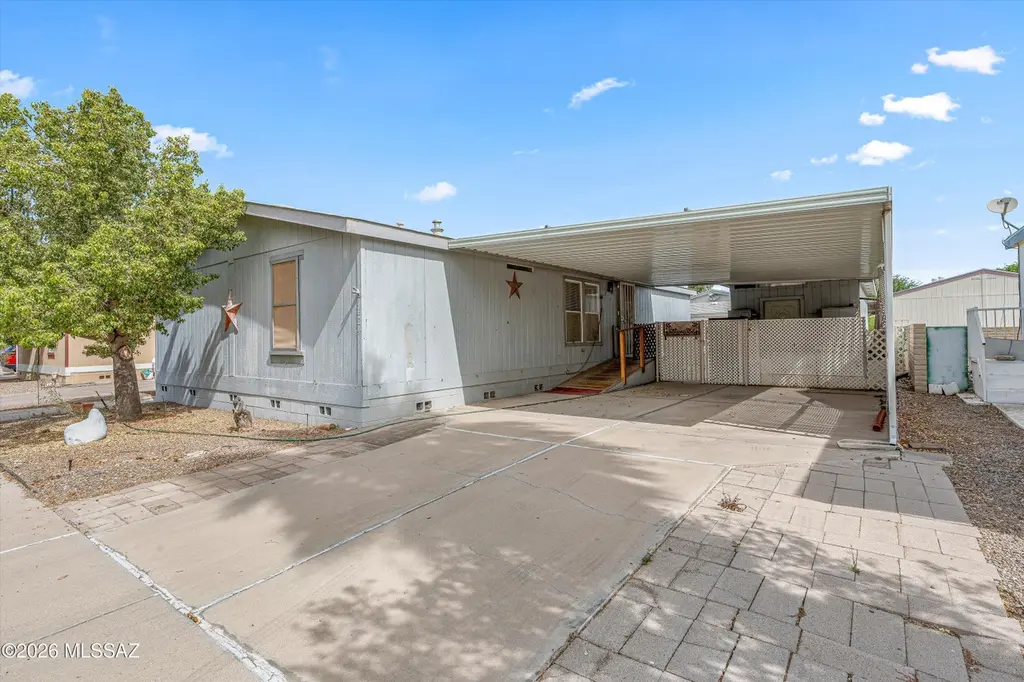
1624 W Coralbrooke Dr · Flowing Wells, AZ
Flood risk 1/10 · Minimal
- FEMA flood zone
- X (unshaded)
- Chance of flooding over 30 yrs
- 0.0%
- Est. flood insurance / yr
- $507 – $1,088
Fire risk 2/10 · Minimal
- Est. fire insurance / yr
- $610 – $1,132
Heat risk 8/10 · Major
- Hot days now (above 107°F)
- 7 days/yr
- Hot days in 30 yrs
- 19 days/yr
Wind risk 1/10 · Minimal
- Chance of severe wind over 30 yrs
- —
Air-quality risk 1/10 · Minimal
- Unhealthy air days now
- 0 days/yr
- Unhealthy air days in 30 yrs
- 0 days/yr
Risk factors via First Street. Map © Google.
Why this score? — see what drove the D- grade
The composite is a weighted blend of 9 inputs, each scored 0–100. Each bar is that input's sub-score; the figure is the points it added to the 100-point composite (weight × sub-score).
- Cash flow +15.5/30.0
- ARV discount +5.1/15.0
- DSCR +4.8/10.0
- Livability +3.7/5.0
- 1% rule +3.5/10.0
- Rent growth +2.6/5.0
- Condition / age +2.5/5.0
- Schools +2.2/10.0
- Appreciation +0.0/10.0
$200,000
🖨 Deal sheet 📄 Offer letter ✓ Due diligence
Listing remarks
Fantastic location! Just minutes from shopping, restaurants, and Northwest Medical Center. Nestled in a little gated community, this home offers a split floor plan with 3 bedrooms and 2 baths. Nice sized backyard and an attached carport and a large shed. All appliances included. Low HOA fees. Move-in ready or update to your liking! Great opportunity as homes do not become available in this community often! New roof will be completed before close of escrow!
Key facts
- Gated community
- Attached carport
- Split floor plan
Tags
Property features AI
Finance
- Other: Lot dimensions approximately 55 x 81 (4,574 sq ft); Zoned Pima County - MU
- HOA & community: Has HOA; HOA fee $40 quarterly; HOA covers common area maintenance, gated community, and street maintenance
Exterior
- Parking: Attached garage; 2 covered/carport spaces
- Security: Gated community; Smoke detectors
- Utilities: Public water (water company); Sewer connected
- Home design: Manufactured home; Single-story; Faces south
- Construction: Frame and siding construction; Shingle roof
- Exterior features: Block fencing; Paved streets; Sidewalks; Gated community; North/South exposure
Interior
- Kitchen: Dishwasher; Refrigerator; Gas range
- Flooring: Carpet; Vinyl
- Bathrooms: 2 full bathrooms
- Heating & cooling: Forced air heating (natural gas); Central air conditioning; Ceiling fans
- Interior features: Smoke detectors; Level/accessible layout
- Laundry & utility: Dedicated laundry room with washer and dryer
Neighborhood map
What this means for you Summary
Snapshot
- This is a 3-bed/2.0-bath manufactured listed at $200k.
Deal economics
- At list price, monthly cash flow is $79 ($945/yr) — positive.
- The deal already cash-flows at list — no discount required.
- To meet the 1% rule (rent ≥ 1% of price), the offer needs to be $170k (15.2% below list).
- Recommended offer: $170k (15.2% below list) — sets the bar for 1% rule.
Location & tenants
- Location reads 73/100 on livability (#21 in AZ) — a middle-class / working-renter tenant base. Strengths: commute A+, cost of living A+, health & safety A+; Watch: crime F, amenities F, employment F.
- Flowing Wells Unified District (4405) (suburban): math 23% / reading 30% proficiency, ranked #143 of 249 in AZ (top 57%) — low school quality limits family demand, transient renter base, plan for 1-2y turnover; 64% free/reduced lunch — lower-income household profile, screen leases tightly.
- Zoned schools: Homer Davis Elementary School (math 20% / reading 28%, grade F, #664 of 1,109 statewide, top 60%, 411 students, 86% FRL); Flowing Wells Junior High School (math 24% / reading 28%, grade F, #100 of 218 statewide, top 47%, 818 students, 74% FRL); Flowing Wells High School (math 22% / reading 24%, grade F, #208 of 381 statewide, top 55%, 1,694 students, 65% FRL).
- Market conditions: Rents flat; 177 active listings in the ZIP; 21 comparable units currently listed for rent nearby; rentals at typical pace (median 21d on market — plan ~3-4 weeks tenant-placement turnaround); lower-income renter base — watch delinquency; 5,268 units permitted in Pima County in 2024 (996 in 5+ unit buildings).
- At $1,696/mo this rent would consume 55% of the median local household income ($37k/yr) (locally 4240% of renters already pay >50% of income on rent) — very limited rent-growth headroom before tenants either downsize or default.
Forward outlook
- Local home prices are declining (-3.0%/yr); year-one equity from $1k of loan paydown is wiped out by about $6k of value loss. Plan a longer hold.
- Pima County population projected at +8% by 2050 — modest demand growth; plan on rents tracking national, not racing it.
Negotiation context
- It's been on market 34 days — a 3% lower offer ($194k) is reasonable based on typical stale-listing flexibility.
Risks & watch-outs
- Climate carrying-cost: extreme-heat days projected 7→19/yr by 2055 (HVAC capex compounding) — expect insurance premiums to compound above CPI over the hold.
Questions for the listing agent
- It's been on market 34 days. Have you received any prior offers? Is the seller open to a 15% concession, seller financing, or rate buy-down credit?
- What does the HOA fee cover, when was the last increase, and are there any pending special assessments or reserve-fund shortfalls?
- Is there a deadline driving the sale (1031 exchange, divorce, estate, relocation)? That informs how much negotiation room exists.
- Schools are D-rated, which usually means shorter tenancies and higher turnover. Who's the typical renter profile here, and what's been the actual vacancy rate?
- Crime grade is F in this area — have there been break-ins, vandalism, or insurance claims at this property in the last 3 years? What carrier currently insures it and at what premium?
- The area grade is low — what's the realistic commute time and amenity access for the typical tenant pool here? Any planned neighborhood developments (good or bad) we should know about?
- What's the average days-on-market for RENTAL listings here right now (not sales)? A rising rental-DOM trend means longer vacancies and softer asking-rent achievability than the comps imply.
- What's the recent tenant-quality profile in this submarket — average credit score on applications, eviction rate, late-payment / NSF rate, and stable-employment percentage? A property-management company in the area should have these aggregated.
- How much new for-sale + rental construction is in the pipeline within 1–3 miles? Heavy new supply typically softens prices + rents 12–24 months out; constrained supply supports both.
Investment metrics
- 1% rule
- 0.85% ✗
- Cap rate
- 6.77%
- Cash-on-cash
- 1.69%
- DSCR
- 1.08
- GRM
- 9.8
CMA / ARV
- ARV (median comp)
- $190,000
- List price
- $200,000
- Delta
- 5.26%
- Verdict
- FAIR
- Comps
- 13 within 1.0 mi
Show comp detail 10 sales within ~0.75 mi
| Address | Dist | Beds/Ba | Sqft | Sold | Price | $/sf | Match |
|---|---|---|---|---|---|---|---|
| 1624 W Coralbrooke Dr | 0.00mi | 3/2.0 | 1,456 (0%) | 0mo | $185,000 | $127 | 100 |
| 1647 W Seabrooke Dr | 0.04mi | 3/2.0 | 1,624 (+12%) | 0mo | $220,000 | $135 | 79 |
| 1719 W Seabrooke Dr | 0.13mi | 3/2.0 | 1,344 (-8%) | 5mo | $219,500 | $163 | 77 |
| 1962 W Narciso Pl | 0.61mi | 3/2.0 | 1,456 (0%) | 1mo | $237,000 | $163 | 70 |
| 1687 W Seabrooke Dr | 0.08mi | 3/2.0 | 1,344 (-8%) | 20mo | $215,000 | $160 | 67 |
| 4550 N Flowing Wls #170 | 0.54mi | 2/2.0 (-1) | 1,392 (-4%) | 3mo | $114,000 | $82 | 60 |
| 1594 W Seabrooke Dr | 0.06mi | 3/2.0 | 1,280 (-12%) | 24mo | $224,000 | $175 | 58 |
| 1866 W Desert Broom Ln | 0.68mi | 4/2.0 (+1) | 1,456 (0%) | 12mo | $230,000 | $158 | 53 |
| 4891 N River Vista Dr | 0.54mi | 3/2.0 | 1,344 (-8%) | 11mo | $175,000 | $130 | 53 |
| 4837 N River Valley Loop | 0.53mi | 3/2.0 | 1,344 (-8%) | 22mo | $260,000 | $193 | 44 |
Match score weights: distance 35% · size 25% · config 20% · recency 20%. Top-matched comps best support the ARV.
Projected returns pro-forma
-3.0% appreciation · 0.3% rent growth · sell at horizon
- IRR
- -16.5%
- Equity multiple
- 0.43×
- Total profit
- $-31,929
- Equity at exit
- $29,821
- IRR
- -13.5%
- Equity multiple
- 0.30×
- Total profit
- $-38,988
- Equity at exit
- $17,292
Cash invested: $56,000 (down + closing). Projections, not guarantees.
Landlord ↔ Tenant lean methodology
- Overall (STATE)
- 87 Strongly Landlord-Friendly
- State Arizona
- 87 Strongly Landlord-Friendly · R+3
- County
- — inherits STATE
- City
- — inherits STATE
ZIP-level market 85705
- Rents YoY
- 0.3%
- Active inventory
- 177
- Price-to-rent
- 9.8×
Monthly cashflow live
- Estimated rent
- $1,696 high interval (Pro) →
- Mortgage (P&I)
- −$1,049
- Tax from tax record
- −$89 /mo · $1,071/yr
- Insurance
- −$83
- HOA
- −$40
- Vacancy / Maint / Mgmt
- −$356
- Net cashflow
- $79
Break-even live
UW: 25.0% down · 7.5% · 30yr · 1.5% tax · 5.0% vac · 8.0% maint · 8.0% mgmt
Financing live
Cash to close
- Down payment
- $50,000
- Closing costs
- $6,000
- Reserves months
- —
- Total cash needed
- —
Loan-product check · same deal, 3 products live
Conventional
25% down · 7.5% · 30yr
- Down + closing
- —
- Monthly P&I
- —
- Monthly cashflow
- —
- DSCR
- —
- Eligible?
- —
Personal DTI + credit; lowest rate.
DSCR
20% down · 8.5% · 30yr
- Down + closing
- —
- Monthly P&I
- —
- Monthly cashflow
- —
- DSCR
- —
- Eligible?
- —
No personal income docs; deal must DSCR.
Hard money
10% down · 12.0% · 12mo
- Down + closing
- —
- Monthly P&I
- —
- Monthly cashflow
- —
- DSCR
- —
- Eligible?
- —
Short-term bridge; refi at stabilization.
Rent comps 21 comps
| Address | Beds | Baths | Sqft | Rent | $/sqft | DOM | Units | Dist |
|---|---|---|---|---|---|---|---|---|
| 4751 N Flowing Wells Rd Tucson, AZ | 3.0 | 3.0 | 1500 | $1,500 | $1.00 | 44d | 1 | 0.28mi |
| 5021 N Kevy Pl Tucson, AZ | 3.0 | 2.0 | 1350 | $1,650 | $1.22 | 44d | 1 | 0.43mi |
| 5077 N Fortune Teller Way Tucson, AZ | 3.0 | 2.5 | 1370 | $1,875 | $1.37 | 17d | 1 | 0.48mi |
| 4861 N River Vista Dr Tucson, AZ | 3.0 | 2.0 | 1144 | $1,500 | $1.31 | 3d | 1 | 0.53mi |
| 5100 N La Canada Dr Tucson, AZ | 2.0 | 2.0 | 938 | $1,408 | $1.50 | 44d | 1 | 0.60mi |
| 5132 Prairie Clover Trl Tucson, AZ | 3.0–4.0 | 2.0–2.5 | 1604 | $1,897 | $1.18 | 2d | 13 | 0.63mi |
| 1357 W Talisman St Tucson, AZ | 4.0 | 1.0 | 1200 | $1,100 | $0.92 | 24d | 1 | 0.66mi |
| 1100 W River Rd Unit 7 Tucson, AZ | 2.0 | 2.5 | 1026 | $2,200 | $2.14 | 20d | 1 | 0.70mi |
| 1100 W River Rd Tucson, AZ | 3.0 | 2.5 | 1187 | $2,250 | $1.90 | 2d | 1 | 0.70mi |
| 1021 W Edgewater Dr Tucson, AZ | 4.0 | 2.0 | 1431 | $1,940 | $1.36 | 44d | 1 | 0.71mi |
| 1100 W River Rd Unit 14 Tucson, AZ | 3.0 | 2.5 | 1187 | $2,450 | $2.06 | 2d | 1 | 0.71mi |
| 4111 N Flowing Wells Rd Tucson, AZ | 2.0 | 2.0–2.5 | 1131 | $1,625 | $1.44 | 24d | 3 | 0.74mi |
| 2001 W La Osa Dr Tucson, AZ | 4.0 | 2.0 | 1866 | $2,045 | $1.10 | 44d | 1 | 0.74mi |
| 1925 W River Rd Tucson, AZ | 1.0–3.0 | 1.0–2.0 | 1049 | $2,076 | $1.98 | 2d | 32 | 0.89mi |
| 5416 N Bramble Brook Ln Tucson, AZ | 3.0 | 2.0 | 1483 | $1,850 | $1.25 | 3d | 1 | 1.01mi |
| 1215 W Roger Rd Unit 1201-13 Tucson, AZ | 3.0 | 1.5 | 1000 | $1,595 | $1.59 | 3d | 1 | 1.01mi |
| 1215 W Roger Rd Unit 1201-01 Tucson, AZ | 3.0 | 1.5 | 1000 | $1,595 | $1.59 | 44d | 1 | 1.01mi |
| 1132 W Knox Pl Tucson, AZ | 4.0 | 2.0 | 1322 | $1,849 | $1.40 | 44d | 1 | 1.13mi |
| 4030 N Fairview Ave Tucson, AZ | 3.0 | 2.0 | 1500 | $1,700 | $1.13 | 44d | 1 | 1.16mi |
| 5829 N Escondido Ln Tucson, AZ | 3.0 | 2.0 | 1368 | $1,995 | $1.46 | 15d | 1 | 1.47mi |
| 5750 N La Cholla Blvd Tucson, AZ | 2.0–3.0 | 2.0 | 1453 | $2,172 | $1.49 | 2d | 11 | 1.49mi |
HOA detail
- Monthly dues
- $40 · $480/yr
- Likely covers
- security
Listing history 9 events
-
2026-06-05statusdays on market $200,000 Pending 34 DOM
-
2026-06-03days on market $200,000 Active Contingent 33 DOM
-
2026-06-02days on market $200,000 Active Contingent 32 DOM
-
2026-06-01days on market $200,000 Active Contingent 31 DOM
-
2026-05-31days on market $200,000 Active Contingent 30 DOM
-
2026-05-09historical Active Contingent 460-char remark
-
2026-05-02$200,000 Active 460-char remark
-
2001-07-20soldstatus $399,900
-
2001-07-20soldstatus $39,900
ⓘ Source: listings_history table (triggers on properties + properties_extension) + one-shot
backfill from property_details.listing_events for pre-trigger history.
Tax reassessment forecast AZ · Resets to sale price
- Current annual tax
- $1,071 · $89/mo
- Projected year-2 tax
- $1,320 · $110/mo
- Expected delta
- +$249/yr (+$21/mo · 23.3%)
ⓘ Screening estimate from a state-policy table — verify with the county assessor before closing.
Climate risk First Street
- Flood 1/10 Low FEMA zone X (unshaded) · 0% chance over 30 yrs
- Wildfire 2/10 Low
- Heat 8/10 Severe 7 d/yr ≥107°F today · 19 d/yr by 30 yrs out
- Wind 1/10 Low
- Air quality 1/10 Low 0 unhealthy d/yr today · 0 by 30 yrs out
Nearby sold comps map
Loading sold comps map…
Walkable amenities ~0.75 mi
Loading nearby amenities…
Taxation est. · year 1
- Rental income
- $20,356
- − Mortgage interest
- −$11,203
- − Property taxes
- −$1,071
- − Insurance
- −$1,000
- − Repairs & maintenance
- −$1,629
- − Management
- −$1,629
- − HOA
- −$480
- − Depreciation
- −$5,818
- Taxable loss
- −$2,473
- Est. tax savings @ 24.0%
- +$593
- After-tax cash flow
- $1,538/yr
For passive investors: Depreciation is non-cash, so a rental often shows a tax loss while cash-flowing — sheltering income. Rental losses are passive: they offset passive income freely, and up to $25,000/yr can offset ordinary (W-2) income if you actively participate and your MAGI is under $100k (phasing out to $0 by $150k); unused losses carry forward. On sale, claimed depreciation is recaptured at up to 25%, and gains may owe capital-gains tax (a 1031 exchange can defer both). Figures are a year-1 estimate at your 24.0% rate — not tax advice; consult a CPA.
Schools (NCES district)
- District
- Flowing Wells Unified District (4405)
- NCES district ID
- 0403010
- Math proficiency
- 23% ▼ -19.00%
- Reading proficiency
- 30% ▼ -14.00%
- Median HH income
- $33,361
- Composite
- 21.69/100
- National rank
- #8271
- State rank
- #143 of 249 in AZ
Livability — Flowing Wells
- Score
- 73/100
- State rank
- #21
- US rank
- #5288
Category grades
Schools grade is shown separately in the Schools card above.
Census & demographics
- Census place
- Flowing Wells, AZ
- County
- Pima County · 1,012,107 people
- Metro
- Tucson, AZ
- Population (ZIP)
- 54,700
- Household income
- $37,194
- Rent vs Own
- Severe rent burden
- 4240.0
Population outlook (Pima County) Hauer SSP2
- Today (2025)
- 1,066,056 people
- By 2030
- 1,086,684 · +1.9%
- By 2040
- 1,117,160 · +4.8%
- By 2050
- 1,149,778 · +7.9%
- By 2075
- 1,271,480 · +19.3%
- By 2100
- 1,321,160 · +23.9%
Race, ethnicity, and origin ACS 2023
- Neighborhood character
- Diverse neighborhood (Simpson 0.63)
- Race & ethnicity
- Hispanic / Latino 45% White 41% Two or more races 18% Asian 4% Black 3% Native American 3%
- Hispanic origin (detail)
- Mexican 41%
- Common ancestry
- Portuguese 2% Romanian 2% Lithuanian 2%
- Foreign-born
- 18% · Canada, China, Vietnam
- Languages at home
- 65% English-only · Spanish 30% Chinese 1% Vietnamese 1%
Political lean MEDSL · Pima
- 2024 margin
- D (+15.2) · D 57.0% · R 41.8% · Other 1.2%
- 2008→2024 swing
- +9.1pp toward D · 2008: 6.1pp · 2024: 15.2pp
- All cycles
- 2024: D+15.2 2020: D+18.7 2016: D+13.5 2012: D+5.8 2008: D+6.1
Not yet ingested
- Civics
- —
Market trends
- HPI YoY
- ▼ -163.31%
- Current HPI
- 283.0647
- Rent YoY
- ▲ 0.30%
- Metro
- Tucson, AZ
- State GDP YoY
- ▲ 4.54%
- F500 in state
- 20
Industry mix (Fortune 500 HQ in AZ)
| Industry | F500 HQs | Revenue |
|---|---|---|
| Technology | 2 | $13B |
|
||
| Mining / Metals | 1 | $23B |
|
||
| Environmental Services | 1 | $16B |
|
||
| Metals / Steel | 1 | $14B |
|
||
| Technology Distribution | 1 | $9B |
|
||
| Homebuilding | 1 | $8B |
|
||
Price history
-53.7% since first listed6 events — show timeline
- 2026-06-12 Sold (MLS) $185,000 MLSSAZ
- 2026-06-04 Pending — MLSSAZ
- 2026-05-09 Contingent — MLSSAZ
- 2026-05-02 Listed $200,000 MLSSAZ
- 2001-07-20 Sold (Public Records) $39,900 Public Records
- 2001-07-20 Sold (Public Records) $399,900 Public Records
Property tax history
+2.0%/yrLatest (2025): $1,071 · +4.6% YoY. Source: county tax records.
Cash-flow waterfall
monthlySold comps — $/sqft
last 12 mo · ≤1 miLoading sold comps…