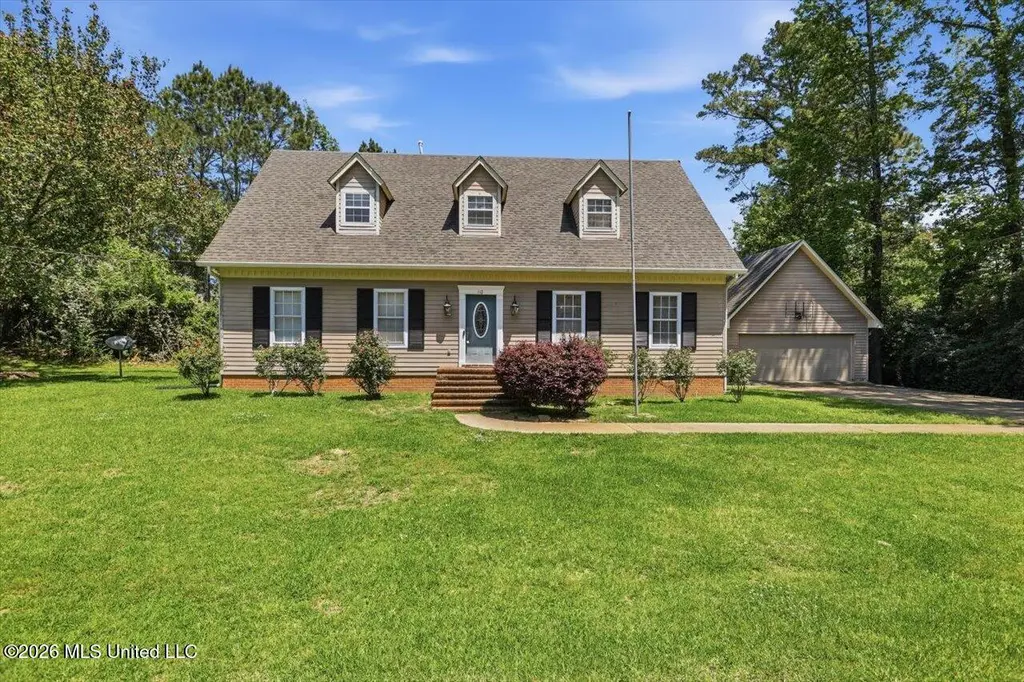
112 Michel St · Brandon, MS
Flood risk 1/10 · Minimal
- FEMA flood zone
- X (unshaded)
- Chance of flooding over 30 yrs
- 0.0%
- Est. flood insurance / yr
- $507 – $1,088
Fire risk 3/10 · Minor
- Est. fire insurance / yr
- $1,241 – $2,305
Heat risk 7/10 · Major
- Hot days now (above 109°F)
- 7 days/yr
- Hot days in 30 yrs
- 20 days/yr
Wind risk 8/10 · Major
- Chance of severe wind over 30 yrs
- 80.0%
Air-quality risk 2/10 · Minimal
- Unhealthy air days now
- 1 days/yr
- Unhealthy air days in 30 yrs
- 1 days/yr
Risk factors via First Street. Map © Google.
Why this score? — see what drove the C grade
The composite is a weighted blend of 9 inputs, each scored 0–100. Each bar is that input's sub-score; the figure is the points it added to the 100-point composite (weight × sub-score).
- Cash flow +18.2/30.0
- ARV discount +15.0/15.0
- DSCR +5.7/10.0
- Schools +4.6/10.0
- Rent growth +4.3/5.0
- Livability +4.0/5.0
- 1% rule +3.9/10.0
- Condition / age +2.5/5.0
- Appreciation +0.0/10.0
$249,900
🖨 Deal sheet 📄 Offer letter ✓ Due diligence
Listing remarks MLS
GORGEOUS! This home has 150 yr old heart pine floor and lead glass window from historic Wysteria Hall. Formal Dining, Large den with tons of natural lighting. French doors in den and master open onto two decks! Two large bedrooms down, and two large bedrooms up. So much storage, huge master bath! 1 downstairs bedroom & 2 ext doors to be painted. If you enjoy history, you'll enjoy the location and beauty of this home! Call your agent today!!!
Key facts
- 0.34 acre lot
- 2 garage spots
- Built 1989
Property features AI
Exterior
- Parking: Detached garage with 2 spaces; Garage door opener; Paved parking; Additional storage in garage
- Security: Smoke detectors
- Utilities: Public water; Public sewer; Electricity available; Natural gas available; Cable available
- Home design: Single-family residence; House; Two stories; Move-in ready
- Construction: Brick, Masonite, and wood siding exterior; Architectural shingle roof; Conventional and pillar/post/pier foundation; Built in public-records year
- Exterior features: Deck; Stone/tile patio or porch; Chain link fencing (partial); Workshop
Interior
- Kitchen: Cooktop; Gas cooktop; Oven; Self-cleaning oven; Microwave; Dishwasher; Disposal; Refrigerator; Indoor grill; Gas water heater; Water heater
- Flooring: Ceramic tile; Laminate; Tile; Wood
- Bathrooms: 2 full bathrooms
- Heating & cooling: Central heating; Electric heating; Fireplace heating; Natural gas heating; Central air conditioning; Gas cooling; Ceiling fans
- Interior features: Double vanity; Eat-in kitchen; Entrance foyer; High ceilings; Storage; Walk-in closets; Fireplace; Insulated windows; Storm windows; Window treatments
- Laundry & utility: Electric dryer hookup
Neighborhood map
What this means for you Summary
Snapshot
- This is a 4-bed/1.0-bath single-family listed at $250k.
Deal economics
- At list price, monthly cash flow is $223 ($3k/yr) — positive.
- The deal already cash-flows at list — no discount required.
- To meet the 1% rule (rent ≥ 1% of price), the offer needs to be $223k (10.6% below list).
- Recommended offer: $223k (10.6% below list) — sets the bar for 1% rule.
- Cap rate 7.4% vs local median 4.2% in Brandon — top-decile yield for the area; either an underpriced asset or a hidden risk that comps aren't pricing in. Stress-test before assuming the spread holds.
Location & tenants
- Location reads 81/100 on livability (#3 in MS, #1,514 nationally) — a professional / high-income tenant draw. Strengths: crime A+, employment A+, cost of living A+; Watch: amenities F, commute F.
- Rankin County School District (rural): math 56% / reading 48% proficiency, ranked #6 of 130 in MS (top 5%) — acceptable for families but not a draw, mixed tenant base, ~2y average lease.
- Zoned schools: Brandon Elementary School (math 69% / reading 65%, grade B+, #11 of 375 statewide, top 3%, 741 students, 100% FRL); Brandon Middle School (math 67% / reading 49%, grade B, #11 of 179 statewide, top 6%, 1,193 students, 100% FRL); Brandon High School (math 47% / reading 49%, grade D, #27 of 197 statewide, top 13%, 1,648 students, 100% FRL) — zoned schools average 100% FRL vs 35% district-wide (65 pts higher); higher-poverty schools than district average — tighter screening recommended.
- Market conditions: Rents rising fast (+7.1%/yr); 302 active listings in the ZIP; 3 comparable units currently listed for rent nearby; rentals at typical pace (median 23d on market — plan ~3-4 weeks tenant-placement turnaround); solid renter incomes; 343 units permitted in Rankin County in 2024 (0 in 5+ unit buildings).
- This rent runs 30% of the median local income ($89k/yr) — at the standard rent-burdened threshold; future hikes will face affordability resistance.
Forward outlook
- Local home prices are declining (-3.0%/yr); year-one equity from $2k of loan paydown is wiped out by about $7k of value loss. Plan a longer hold.
- Rankin County population projected at +17% by 2050 — long-run rental-demand tailwind backs the buy-and-hold thesis.
Negotiation context
- Only 3 days on market — expect competitive offers; lowballing is unlikely to land.
- 4 sale attempts since 22y ago with the ask held roughly flat each time — persistent listings suggest the price (not the market) is what's stuck; bring a comps-based counter.
Risks & watch-outs
- Climate carrying-cost: severe wind risk, 80% chance of damaging wind over 30y; extreme-heat days projected 7→20/yr by 2055 (HVAC capex compounding) — expect insurance premiums to compound above CPI over the hold.
Questions for the listing agent
- Is there a deadline driving the sale (1031 exchange, divorce, estate, relocation)? That informs how much negotiation room exists.
- Schools are A-rated — typically a magnet for longer-tenancy family renters. What's the average tenant stay here, and is there a school-zone premium baked into asking?
- What's the average days-on-market for RENTAL listings here right now (not sales)? A rising rental-DOM trend means longer vacancies and softer asking-rent achievability than the comps imply.
- What's the recent tenant-quality profile in this submarket — average credit score on applications, eviction rate, late-payment / NSF rate, and stable-employment percentage? A property-management company in the area should have these aggregated.
- How much new for-sale + rental construction is in the pipeline within 1–3 miles? Heavy new supply typically softens prices + rents 12–24 months out; constrained supply supports both.
Investment metrics
- 1% rule
- 0.89% ✗
- Cap rate
- 7.36%
- Cash-on-cash
- 3.82%
- DSCR
- 1.17
- GRM
- 9.3
CMA / ARV
- ARV (median comp)
- $339,256
- List price
- $249,900
- Delta
- -26.34%
- Verdict
- UNDERPRICED
- Comps
- 20 within 1.0 mi
Show comp detail 10 sales within ~0.75 mi
| Address | Dist | Beds/Ba | Sqft | Sold | Price | $/sf | Match |
|---|---|---|---|---|---|---|---|
| 103 Bulldog Cir | 0.28mi | 3/2.0 (-1) | 1,965 (+1%) | 6mo | $360,000 | $183 | 70 |
| 324 Celadon Way | 0.33mi | 3/2.0 (-1) | 2,013 (+4%) | 13mo | $389,900 | $194 | 58 |
| 117 Busick Well Rd | 0.60mi | 3/2.0 (-1) | 1,865 (-4%) | 4mo | $360,000 | $193 | 54 |
| 135 Michel St | 0.11mi | 3/2.5 (-1) | 1,660 (-14%) | 10mo | $270,000 | $163 | 51 |
| 225 E Towne Dr | 0.66mi | 3/2.0 (-1) | 1,979 (+2%) | 7mo | $329,000 | $166 | 51 |
| 504 Fusion Way | 0.33mi | 4/3.0 | 2,181 (+12%) | 9mo | $405,000 | $186 | 48 |
| 526 E Jasper St | 0.56mi | 3/2.0 (-1) | 1,700 (-12%) | 4mo | $259,000 | $152 | 41 |
| 200 E Towne Dr | 0.74mi | 3/2.0 (-1) | 1,804 (-7%) | 12mo | $269,000 | $149 | 35 |
| 204 Pearl St | 0.47mi | 3/2.5 (-1) | 2,224 (+15%) | 13mo | $254,900 | $115 | 32 |
| 201 Shiloh Rd | 0.68mi | 3/1.0 (-1) | 1,702 (-12%) | 22mo | $225,500 | $132 | 25 |
Match score weights: distance 35% · size 25% · config 20% · recency 20%. Top-matched comps best support the ARV.
Projected returns pro-forma
-3.0% appreciation · 7.13% rent growth · sell at horizon
- IRR
- -6.2%
- Equity multiple
- 0.76×
- Total profit
- $-16,723
- Equity at exit
- $37,261
- IRR
- 7.5%
- Equity multiple
- 1.67×
- Total profit
- $46,582
- Equity at exit
- $21,607
Cash invested: $69,972 (down + closing). Projections, not guarantees.
Landlord ↔ Tenant lean methodology
- Overall (STATE)
- 90 Strongly Landlord-Friendly
- State Mississippi
- 90 Strongly Landlord-Friendly · R+11
- County
- — inherits STATE
- City
- — inherits STATE
ZIP-level market 39042
- Home prices YoY
- -34.3%
- Rents YoY
- 7.1%
- Active inventory
- 302
- Price-to-rent
- 9.3×
Monthly cashflow live
- Estimated rent
- $2,234 medium interval (Pro) →
- Mortgage (P&I)
- −$1,311
- Tax from tax record
- −$128 /mo · $1,531/yr
- Insurance
- −$104
- HOA
- −$0
- Vacancy / Maint / Mgmt
- −$469
- Net cashflow
- $223
Break-even live
UW: 25.0% down · 7.5% · 30yr · 1.5% tax · 5.0% vac · 8.0% maint · 8.0% mgmt
Financing live
Cash to close
- Down payment
- $62,475
- Closing costs
- $7,497
- Reserves months
- —
- Total cash needed
- —
Loan-product check · same deal, 3 products live
Conventional
25% down · 7.5% · 30yr
- Down + closing
- —
- Monthly P&I
- —
- Monthly cashflow
- —
- DSCR
- —
- Eligible?
- —
Personal DTI + credit; lowest rate.
DSCR
20% down · 8.5% · 30yr
- Down + closing
- —
- Monthly P&I
- —
- Monthly cashflow
- —
- DSCR
- —
- Eligible?
- —
No personal income docs; deal must DSCR.
Hard money
10% down · 12.0% · 12mo
- Down + closing
- —
- Monthly P&I
- —
- Monthly cashflow
- —
- DSCR
- —
- Eligible?
- —
Short-term bridge; refi at stabilization.
Rent comps 3 comps
| Address | Beds | Baths | Sqft | Rent | $/sqft | DOM | Units | Dist |
|---|---|---|---|---|---|---|---|---|
| 114 Rollingwood Dr Brandon, MS | 4.0 | 3.0 | 2613 | $2,223 | $0.85 | 23d | 1 | 0.86mi |
| 202 Overby St Brandon, MS | 3.0 | 2.0 | 1394 | $1,786 | $1.28 | 43d | 1 | 0.87mi |
| 114 Fox Meadow Dr Brandon, MS | 3.0 | 2.0 | 1500 | $2,250 | $1.50 | 13d | 1 | 1.35mi |
Listing history 11 events
-
2026-05-02status Pending 215-char remark
-
2026-04-29$249,900 Active 215-char remark
-
2026-04-20soldstatus
-
2021-12-17soldstatus
-
2021-10-20historical
-
2021-09-15soldstatus
-
2019-02-18$185,900
-
2008-07-31soldstatus
Show marketing remark (449 chars)
GORGEOUS! This home has 150 yr old heart pine floor and lead glass window from historic Wysteria Hall. Formal Dining, Large den with tons of natural lighting. French doors in den and master open onto two decks! Two large bedrooms down, and two large bedrooms up. So much storage, huge master bath! 1 downstairs bedroom & 2 ext doors to be painted. If you enjoy history, you'll enjoy the location and beauty of this home! Call your agent today!!!
-
2008-03-21$194,900
Show marketing remark (449 chars)
GORGEOUS! This home has 150 yr old heart pine floor and lead glass window from historic Wysteria Hall. Formal Dining, Large den with tons of natural lighting. French doors in den and master open onto two decks! Two large bedrooms down, and two large bedrooms up. So much storage, huge master bath! 1 downstairs bedroom & 2 ext doors to be painted. If you enjoy history, you'll enjoy the location and beauty of this home! Call your agent today!!!
-
2004-05-20soldstatus
-
2004-03-29$159,000
ⓘ Source: listings_history table (triggers on properties + properties_extension) + one-shot
backfill from property_details.listing_events for pre-trigger history.
Tax reassessment forecast MS · Resets to sale price
- Current annual tax
- $1,531 · $128/mo
- Projected year-2 tax
- $1,974 · $165/mo
- Expected delta
- +$444/yr (+$37/mo · 29.0%)
ⓘ Screening estimate from a state-policy table — verify with the county assessor before closing.
Climate risk First Street
- Flood 1/10 Low FEMA zone X (unshaded) · 0% chance over 30 yrs
- Wildfire 3/10 Moderate
- Heat 7/10 Severe 7 d/yr ≥109°F today · 20 d/yr by 30 yrs out
- Wind 8/10 Severe 80% chance of damaging wind over 30 yrs
- Air quality 2/10 Low 1 unhealthy d/yr today · 1 by 30 yrs out
Nearby sold comps map
Loading sold comps map…
Walkable amenities ~0.75 mi
Loading nearby amenities…
Taxation est. · year 1
- Rental income
- $26,808
- − Mortgage interest
- −$13,998
- − Property taxes
- −$1,531
- − Insurance
- −$1,250
- − Repairs & maintenance
- −$2,145
- − Management
- −$2,145
- − Depreciation
- −$7,270
- Taxable loss
- −$1,530
- Est. tax savings @ 24.0%
- +$367
- After-tax cash flow
- $3,039/yr
For passive investors: Depreciation is non-cash, so a rental often shows a tax loss while cash-flowing — sheltering income. Rental losses are passive: they offset passive income freely, and up to $25,000/yr can offset ordinary (W-2) income if you actively participate and your MAGI is under $100k (phasing out to $0 by $150k); unused losses carry forward. On sale, claimed depreciation is recaptured at up to 25%, and gains may owe capital-gains tax (a 1031 exchange can defer both). Figures are a year-1 estimate at your 24.0% rate — not tax advice; consult a CPA.
Schools (NCES district)
- District
- Rankin County School District
- NCES district ID
- 2803830
- Math proficiency
- 56% ▼ -4.00%
- Reading proficiency
- 48% ▼ -6.00%
- Median HH income
- $61,867
- Composite
- 45.62/100
- National rank
- #2587
- State rank
- #6 of 130 in MS
Livability — Brandon
- Score
- 81/100
- State rank
- #3
- US rank
- #1514
Category grades
Schools grade is shown separately in the Schools card above.
Census & demographics
- Census place
- Brandon, MS
- County
- Rankin County · 123,614 people
- City population
- 79,950
- Metro
- Jackson, MS
- Population (ZIP)
- 39,142
- Household income
- $88,597
- Rent vs Own
- Severe rent burden
- 474.0
Population outlook (Rankin County) Hauer SSP2
- Today (2025)
- 164,317 people
- By 2030
- 171,013 · +4.1%
- By 2040
- 182,723 · +11.2%
- By 2050
- 192,376 · +17.1%
- By 2075
- 209,535 · +27.5%
- By 2100
- 209,534 · +27.5%
Race, ethnicity, and origin ACS 2023
- Neighborhood character
- Predominantly White (75%)
- Race & ethnicity
- White 75% Black 21% Hispanic / Latino 2% Two or more races 2%
- Common ancestry
- Italian 5% Slovak 2% Iranian 2%
- Foreign-born
- 2% · Canada
- Languages at home
- 97% English-only · Spanish 2%
Political lean MEDSL · Rankin
- 2024 margin
- Solid R (+47.1) · D 25.9% · R 73.0% · Other 1.0%
- 2008→2024 swing
- +6.4pp toward D · 2008: -53.5pp · 2024: -47.1pp
- All cycles
- 2024: R+47.1 2020: R+45.4 2016: R+52.9 2012: R+51.9 2008: R+53.5
Not yet ingested
- Civics
- —
Market trends
- HPI YoY
- ▼ -90.04%
- Current HPI
- 172.5248
- Rent YoY
- ▲ 7.13%
- Metro
- Jackson, MS
- State GDP YoY
- —
- F500 in state
- 0
Price history
+57.2% since first listed12 events — show timeline
- 2026-06-17 Sold (MLS) — MLSU
- 2026-05-02 Pending — MLSU
- 2026-04-29 Listed $249,900 MLSU
- 2026-04-20 Sold (Public Records) — Public Records
- 2021-12-17 Sold (Public Records) — Public Records
- 2021-10-20 Listing Removed — MLSU
- 2021-09-15 Sold (Public Records) — Public Records
- 2019-02-18 Listed $185,900 MLSU
- 2008-07-31 Sold (MLS) — MLSU
- 2008-03-21 Listed $194,900 MLSU
- 2004-05-20 Sold (MLS) — MLSU
- 2004-03-29 Listed $159,000 MLSU
Property tax history
+4.4%/yrLatest (2025): $1,531 · +1.7% YoY. Source: county tax records.
Cash-flow waterfall
monthlySold comps — $/sqft
last 12 mo · ≤1 miLoading sold comps…