2672 Frazier Ln · Edisto, SC
Flood risk 1/10 · Minimal
- FEMA flood zone
- X (unshaded)
- Chance of flooding over 30 yrs
- 0.0%
- Est. flood insurance / yr
- $507 – $1,088
Fire risk 6/10 · Moderate
- Est. fire insurance / yr
- $783 – $1,453
Heat risk 7/10 · Major
- Hot days now (above 107°F)
- 7 days/yr
- Hot days in 30 yrs
- 17 days/yr
Wind risk 8/10 · Major
- Chance of severe wind over 30 yrs
- 80.0%
Air-quality risk 3/10 · Minor
- Unhealthy air days now
- 3 days/yr
- Unhealthy air days in 30 yrs
- 3 days/yr
Risk factors via First Street. Map © Google.
Why this score? — see what drove the B- grade
The composite is a weighted blend of 9 inputs, each scored 0–100. Each bar is that input's sub-score; the figure is the points it added to the 100-point composite (weight × sub-score).
- Cash flow +30.0/30.0
- DSCR +10.0/10.0
- 1% rule +9.6/10.0
- ARV discount +7.5/15.0
- Schools +5.0/10.0
- Livability +2.9/5.0
- Rent growth +2.5/5.0
- Condition / age +2.5/5.0
- Appreciation +0.0/10.0
$95,000
🖨 Deal sheet 📄 Offer letter ✓ Due diligence
Listing remarks
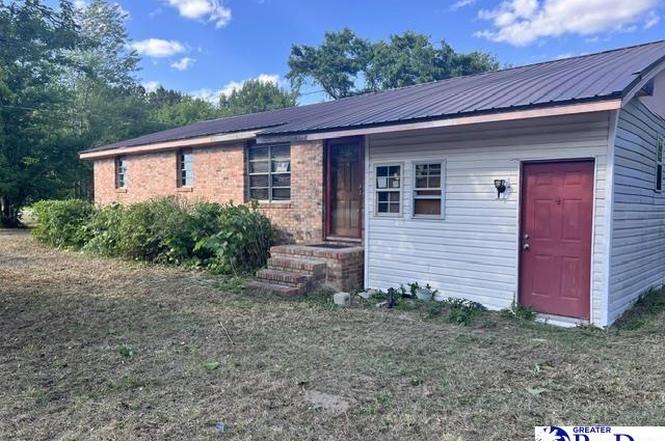
Investor Special! Blank Canvas in Westland Estates. Bring your tools and your vision to 2672 Frazier St! This brick ranch sits on a generous 0.79-acre lot and has been gutted to the studs, offering the ultimate "clean slate" for a complete custom renovation or a high-yield flip. Located in a quiet, established neighborhood, this property offers a peaceful atmosphere while maintaining incredible logistical convenience. You are just minutes away from SC-400 and Hwy 4, providing easy access for commuters. Local amenities are plentiful, with the beautiful Edisto Memorial Gardens, Hillcrest Golf Course, and the Regional Medical Center all nearby. Whether you are looking for your next r
Key facts
- Generous lot
- Local amenities
- Quiet neighborhood
Tags
Property features AI
Finance
- Other: Lot approximately 0.79 acres
Exterior
- Utilities: Public water; Septic tank sewer
- Home design: Single-family residential home; Residential property
- Construction: Brick veneer exterior; Metal roof
- Exterior features: Deck
Interior
- Bathrooms: 1 full bathroom
- Interior features: Crawl space basement
Neighborhood map
What this means for you Summary
Snapshot
- This is a 4-bed/1.5-bath single-family listed at $95k.
Deal economics
- At list price, monthly cash flow is $377 ($5k/yr) — positive.
- The deal already cash-flows at list — no discount required.
- Meets the 1% rule at list price ($1k rent vs $95k).
- Recommended offer: $86k (9.0% below list) — sets the bar for market timing.
Location & tenants
- Location reads 57/100 on livability (#270 in SC) — a working-class tenant base; expect higher turnover. Strengths: cost of living A+, crime B+; Watch: schools C-, amenities F, commute F.
- Market conditions: 226 active listings in the ZIP; 87 units permitted in Orangeburg County in 2024 (0 in 5+ unit buildings).
Forward outlook
- Local home prices are declining (-3.0%/yr); year-one equity from $657 of loan paydown is wiped out by about $3k of value loss. Plan a longer hold.
- Orangeburg County population projected at -27% by 2050 — secular population decline; favor cash flow + early exit over multi-decade hold.
- At projected returns (-3.0% appreciation + 3.0% rent growth), your $27k cash investment doubles in ~8 years — after that, you're playing with house money.
Negotiation context
- It's been on market 114 days — a 9% lower offer ($86k) is reasonable based on typical stale-listing flexibility.
- 2 sale attempts with the ask held roughly flat each time — persistent listings suggest the price (not the market) is what's stuck; bring a comps-based counter.
Risks & watch-outs
- Climate carrying-cost: severe wind risk, 80% chance of damaging wind over 30y; major wildfire risk; extreme-heat days projected 7→17/yr by 2055 (HVAC capex compounding) — expect insurance premiums to compound above CPI over the hold.
Questions for the listing agent
- It's been on market 114 days. Have you received any prior offers? Is the seller open to a 9% concession, seller financing, or rate buy-down credit?
- Built in 1971 — when were the roof, HVAC, electrical panel, plumbing, and water heater last replaced?
- Why hasn't it sold? Are there any deal-killer items the seller is aware of (foundation, flood, title, zoning, code violations)?
- Is there a deadline driving the sale (1031 exchange, divorce, estate, relocation)? That informs how much negotiation room exists.
- What's the average days-on-market for RENTAL listings here right now (not sales)? A rising rental-DOM trend means longer vacancies and softer asking-rent achievability than the comps imply.
- What's the recent tenant-quality profile in this submarket — average credit score on applications, eviction rate, late-payment / NSF rate, and stable-employment percentage? A property-management company in the area should have these aggregated.
- How much new for-sale + rental construction is in the pipeline within 1–3 miles? Heavy new supply typically softens prices + rents 12–24 months out; constrained supply supports both.
Investment metrics
- 1% rule
- 1.46% ✓
- Cap rate
- 11.06%
- Cash-on-cash
- 17.01%
- DSCR
- 1.76
- GRM
- 5.7
CMA / ARV
No comps found within radius.
Projected returns pro-forma
-3.0% appreciation · 3.0% rent growth · sell at horizon
- IRR
- 8.3%
- Equity multiple
- 1.33×
- Total profit
- $8,679
- Equity at exit
- $14,165
- IRR
- 17.6%
- Equity multiple
- 2.46×
- Total profit
- $38,725
- Equity at exit
- $8,214
Cash invested: $26,600 (down + closing). Projections, not guarantees.
Landlord ↔ Tenant lean methodology
- Overall (STATE)
- 90 Strongly Landlord-Friendly
- State South Carolina
- 90 Strongly Landlord-Friendly · R+6
- County
- — inherits STATE
- City
- — inherits STATE
ZIP-level market 29115
- Home prices YoY
- -27.3%
- Active inventory
- 226
- Price-to-rent
- 5.7×
Monthly cashflow live
- Estimated rent
- $1,391 medium interval (Pro) →
- Mortgage (P&I)
- −$498
- Tax from tax record
- −$184 /mo · $2,209/yr
- Insurance
- −$40
- HOA
- −$0
- Vacancy / Maint / Mgmt
- −$292
- Net cashflow
- $377
Break-even live
UW: 25.0% down · 7.5% · 30yr · 1.5% tax · 5.0% vac · 8.0% maint · 8.0% mgmt
Financing live
Cash to close
- Down payment
- $23,750
- Closing costs
- $2,850
- Reserves months
- —
- Total cash needed
- —
Loan-product check · same deal, 3 products live
Conventional
25% down · 7.5% · 30yr
- Down + closing
- —
- Monthly P&I
- —
- Monthly cashflow
- —
- DSCR
- —
- Eligible?
- —
Personal DTI + credit; lowest rate.
DSCR
20% down · 8.5% · 30yr
- Down + closing
- —
- Monthly P&I
- —
- Monthly cashflow
- —
- DSCR
- —
- Eligible?
- —
No personal income docs; deal must DSCR.
Hard money
10% down · 12.0% · 12mo
- Down + closing
- —
- Monthly P&I
- —
- Monthly cashflow
- —
- DSCR
- —
- Eligible?
- —
Short-term bridge; refi at stabilization.
Listing history 19 events
-
2026-06-19days on market $95,000 Active 114 DOM
-
2026-06-18days on market $95,000 Active 113 DOM
-
2026-06-17days on market $95,000 Active 112 DOM
-
2026-06-16days on market $95,000 Active 111 DOM
-
2026-06-15days on market $95,000 Active 110 DOM
-
2026-06-14days on market $95,000 Active 108 DOM
-
2026-06-12days on market $95,000 Active 107 DOM
-
2026-06-09days on market $95,000 Active 104 DOM
-
2026-06-08days on market $95,000 Active 103 DOM
-
2026-06-07days on market $95,000 Active 102 DOM
-
2026-06-07days on market $95,000 Active 101 DOM
-
2026-06-04days on market $95,000 Active 98 DOM
-
2026-06-02days on market $95,000 Active 97 DOM
-
2026-06-01days on market $95,000 Active 96 DOM
-
2026-05-31days on market $95,000 Active 95 DOM
-
2026-05-31days on market $95,000 Active 94 DOM
-
2026-01-19$94,500 Active
-
2026-01-19$95,000 Active
-
2022-09-14soldstatus $89,000
ⓘ Source: listings_history table (triggers on properties + properties_extension) + one-shot
backfill from property_details.listing_events for pre-trigger history.
Tax reassessment forecast SC · Resets to sale price
- Current annual tax
- $2,209 · $184/mo
- Projected year-2 tax
- $2,209 · $184/mo
- Expected delta
- $0/yr ($0/mo · 0.0%)
ⓘ Screening estimate from a state-policy table — verify with the county assessor before closing.
Climate risk First Street
- Flood 1/10 Low FEMA zone X (unshaded) · 0% chance over 30 yrs
- Wildfire 6/10 Major
- Heat 7/10 Severe 7 d/yr ≥107°F today · 17 d/yr by 30 yrs out
- Wind 8/10 Severe 80% chance of damaging wind over 30 yrs
- Air quality 3/10 Moderate 3 unhealthy d/yr today · 3 by 30 yrs out
Nearby sold comps map
Loading sold comps map…
Walkable amenities ~0.75 mi
Loading nearby amenities…
Taxation est. · year 1
- Rental income
- $16,691
- − Mortgage interest
- −$5,321
- − Property taxes
- −$2,209
- − Insurance
- −$475
- − Repairs & maintenance
- −$1,335
- − Management
- −$1,335
- − Depreciation
- −$2,764
- Taxable income
- $3,252
- Est. tax owed @ 24.0%
- −$780
- After-tax cash flow
- $3,744/yr
For passive investors: Depreciation is non-cash, so a rental often shows a tax loss while cash-flowing — sheltering income. Rental losses are passive: they offset passive income freely, and up to $25,000/yr can offset ordinary (W-2) income if you actively participate and your MAGI is under $100k (phasing out to $0 by $150k); unused losses carry forward. On sale, claimed depreciation is recaptured at up to 25%, and gains may owe capital-gains tax (a 1031 exchange can defer both). Figures are a year-1 estimate at your 24.0% rate — not tax advice; consult a CPA.
Schools (NCES district)
No district data.
Livability — Edisto
- Score
- 57/100
- State rank
- #270
- US rank
- #21693
Category grades
Schools grade is shown separately in the Schools card above.
Census & demographics
- Population (ZIP)
- 27,179
Population outlook (Orangeburg County) Hauer SSP2
- Today (2025)
- 82,698 people
- By 2030
- 78,615 · -4.9%
- By 2040
- 69,308 · -16.2%
- By 2050
- 60,629 · -26.7%
- By 2075
- 42,678 · -48.4%
- By 2100
- 28,136 · -66.0%
Race, ethnicity, and origin ACS 2023
- Neighborhood character
- Predominantly Black (76%)
- Race & ethnicity
- Black 76% White 20% Hispanic / Latino 2% Two or more races 2%
- Foreign-born
- 2% · Canada
- Languages at home
- 97% English-only · Spanish 2%
Political lean MEDSL · Orangeburg
- 2024 margin
- Strong D (+24.6) · D 61.8% · R 37.2% · Other 1.1%
- 2008→2024 swing
- -13.5pp toward R · 2008: 38.1pp · 2024: 24.6pp
- All cycles
- 2024: D+24.6 2020: D+33.2 2016: D+37.0 2012: D+43.5 2008: D+38.1
Not yet ingested
- Civics
- —
Market trends
- HPI YoY
- ▼ -56.65%
- Current HPI
- 150.823
- Rent YoY
- —
- Metro
- —
- State GDP YoY
- ▲ 4.51%
- F500 in state
- 2
Industry mix (Fortune 500 HQ in SC)
| Industry | F500 HQs | Revenue |
|---|---|---|
| Packaging | 1 | $7B |
|
||
Price history
+6.7% since first listed3 events — show timeline
- 2026-01-19 Listed $95,000 RAGPD
- 2026-01-19 Listed $94,500 Consolidated MLS
- 2022-09-14 Sold (Public Records) $89,000 Public Records
Property tax history
+10.7%/yrLatest (2024): $2,209 · +0.1% YoY. Source: county tax records.
Cash-flow waterfall
monthlySold comps — $/sqft
last 12 mo · ≤1 miLoading sold comps…