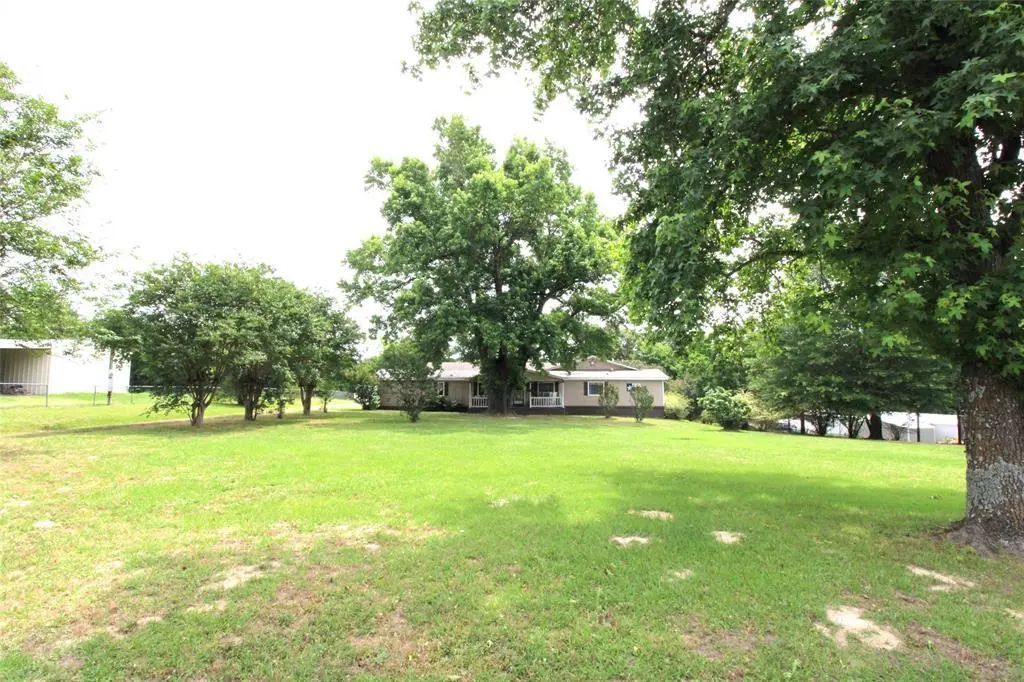
1967 Hopson Dr · Athens, TX
Flood risk 1/10 · Minimal
- FEMA flood zone
- X (unshaded)
- Chance of flooding over 30 yrs
- 0.0%
- Est. flood insurance / yr
- $507 – $1,088
Fire risk 4/10 · Minor
- Est. fire insurance / yr
- $1,222 – $2,270
Heat risk 7/10 · Major
- Hot days now (above 110°F)
- 7 days/yr
- Hot days in 30 yrs
- 26 days/yr
Wind risk 6/10 · Moderate
- Chance of severe wind over 30 yrs
- 61.0%
Air-quality risk 2/10 · Minimal
- Unhealthy air days now
- 0 days/yr
- Unhealthy air days in 30 yrs
- 1 days/yr
Risk factors via First Street. Map © Google.
Why this score? — see what drove the C+ grade
The composite is a weighted blend of 9 inputs, each scored 0–100. Each bar is that input's sub-score; the figure is the points it added to the 100-point composite (weight × sub-score).
- Cash flow +23.1/30.0
- ARV discount +15.0/15.0
- DSCR +7.4/10.0
- 1% rule +5.2/10.0
- Schools +3.7/10.0
- Livability +3.6/5.0
- Rent growth +2.5/5.0
- Condition / age +2.5/5.0
- Appreciation +0.0/10.0
$166,000
🖨 Deal sheet (PDF) 📄 Offer letter ✓ Due diligence
Listing remarks
Secluded, peaceful living half a mile from Lake Athens. Charming 3BR, 2BA home nestled on 1 acre just outside of Athens city limits. Quiet peaceful area. Home is great for retirement or starter home. Split bedroom arrangement, the primary bedroom and 1 other both have private entrance from the back of the home. 25X30 Workshop with electric, water and workbench. Covered back patio
Key facts
- Private entrance
- Covered back patio
- Secluded living
Tags
Property features AI
Finance
- Financial info: Accepts cash and conventional financing
- HOA & community: No association
Exterior
- Parking: Gravel parking
- Utilities: Co-op water; Outside city limits water service
- Home design: Single-family residence; One story
- Construction: Built in 1986; Frame construction; Composition roof
- Exterior features: Covered patio; Deck; Chain link fence; Acreage lot (~0.98 acre)
Interior
- Kitchen: Electric range; Refrigerator; Pantry
- Bedrooms: 3 bedrooms (all on main level)
- Flooring: Carpet; Combination flooring; Luxury vinyl plank
- Bathrooms: 2 full bathrooms
- Heating & cooling: Wood stove heating; Wall/window cooling units
- Interior features: In-law suite floorplan; Pantry; Vaulted ceilings; One living area; One dining area; 4 total rooms
- Laundry & utility: Utility room with full-size washer/dryer area
Neighborhood map
What this means for you Summary
Snapshot
- This is a 3-bed/2.0-bath manufactured listed at $166k.
Deal economics
- At list price, monthly cash flow is $298 ($4k/yr) — positive.
- The deal already cash-flows at list — no discount required.
- Meets the 1% rule at list price ($2k rent vs $166k).
- Recommended offer: $164k (1.5% below list) — sets the bar for market timing.
- Cap rate 8.4% vs local median 2.4% in Athens — top-decile yield for the area; either an underpriced asset or a hidden risk that comps aren't pricing in. Stress-test before assuming the spread holds.
Location & tenants
- Location reads 72/100 on livability (#241 in TX) — a middle-class / working-renter tenant base. Strengths: cost of living A+, health & safety A+, housing A; Watch: crime D+, amenities F, commute F.
- Brownsboro ISD (rural): math 42% / reading 46% proficiency, ranked #290 of 826 in TX (top 35%) — families likely to look elsewhere, expect single-tenant / working-renter base with shorter leases.
- Zoned schools: Brownsboro El (math 32% / reading 37%, grade F, #1,995 of 4,322 statewide, top 50%, 429 students, 66% FRL); Brownsboro J H (math 48% / reading 49%, grade C-, #392 of 1,662 statewide, top 24%, 405 students, 60% FRL); Brownsboro H S (math 31% / reading 63%, grade D-, #591 of 1,632 statewide, top 38%, 757 students, 50% FRL).
- Market conditions: 196 active listings in the ZIP; 263 units permitted in Henderson County in 2024 (0 in 5+ unit buildings).
Forward outlook
- Local home prices are declining (-3.0%/yr); year-one equity from $1k of loan paydown is wiped out by about $5k of value loss. Plan a longer hold.
Negotiation context
- It's been on market 26 days — a 2% lower offer ($164k) is reasonable based on typical stale-listing flexibility.
Risks & watch-outs
- Climate carrying-cost: major wind risk, 61% chance of damaging wind over 30y; extreme-heat days projected 7→26/yr by 2055 (HVAC capex compounding) — expect insurance premiums to compound above CPI over the hold.
Questions for the listing agent
- Is there a deadline driving the sale (1031 exchange, divorce, estate, relocation)? That informs how much negotiation room exists.
- Schools are D-rated, which usually means shorter tenancies and higher turnover. Who's the typical renter profile here, and what's been the actual vacancy rate?
- Crime grade is D in this area — have there been break-ins, vandalism, or insurance claims at this property in the last 3 years? What carrier currently insures it and at what premium?
- What's the average days-on-market for RENTAL listings here right now (not sales)? A rising rental-DOM trend means longer vacancies and softer asking-rent achievability than the comps imply.
- What's the recent tenant-quality profile in this submarket — average credit score on applications, eviction rate, late-payment / NSF rate, and stable-employment percentage? A property-management company in the area should have these aggregated.
- How much new for-sale + rental construction is in the pipeline within 1–3 miles? Heavy new supply typically softens prices + rents 12–24 months out; constrained supply supports both.
Investment metrics
- 1% rule
- 1.02% ✓
- Cap rate
- 8.45%
- Cash-on-cash
- 7.70%
- DSCR
- 1.34
- GRM
- 8.2
CMA / ARV
- ARV (on-the-fly)
- $247,940
- Comps found
- 1
Show comp detail 1 sale within ~0.75 mi
| Address | Dist | Beds/Ba | Sqft | Sold | Price | $/sf | Match |
|---|---|---|---|---|---|---|---|
| 7839 Two Mile Cir | 0.71mi | 3/2.0 | 1,369 (-11%) | 15mo | $220,000 | $161 | 36 |
Match score weights: distance 35% · size 25% · config 20% · recency 20%. Top-matched comps best support the ARV.
Projected returns pro-forma
-3.0% appreciation · 3.0% rent growth · sell at horizon
- IRR
- -4.6%
- Equity multiple
- 0.83×
- Total profit
- $-7,952
- Equity at exit
- $24,751
- IRR
- 5.1%
- Equity multiple
- 1.37×
- Total profit
- $17,352
- Equity at exit
- $14,353
Cash invested: $46,480 (down + closing). Projections, not guarantees.
Landlord ↔ Tenant lean methodology
- Overall (STATE)
- 87 Strongly Landlord-Friendly
- State Texas
- 87 Strongly Landlord-Friendly · R+5
- County
- — inherits STATE
- City
- — inherits STATE
ZIP-level market 75752
- Home prices YoY
- -27.0%
- Active inventory
- 196
- Price-to-rent
- 8.2×
Monthly cashflow live
- Estimated rent
- $1,687 medium interval (Pro) →
- Mortgage (P&I)
- −$871
- Tax from tax record
- −$95 /mo · $1,135/yr
- Insurance
- −$69
- HOA
- −$0
- Vacancy / Maint / Mgmt
- −$354
- Net cashflow
- $298
Break-even live
Sensitivity live
| Price | -10% $392 | -5% $345 | +0% $298 | +5% $251 | +10% $204 |
|---|---|---|---|---|---|
| Rent | -10% $165 | -5% $232 | +0% $298 | +5% $365 | +10% $431 |
| Rate | -1.0pp $382 | -0.5pp $340 | base $298 | +0.5pp $255 | +1.0pp $211 |
UW: 25.0% down · 7.5% · 30yr · 1.5% tax · 5.0% vac · 8.0% maint · 8.0% mgmt
Financing live
Cash to close
- Down payment
- $41,500
- Closing costs
- $4,980
- Reserves months
- —
- Total cash needed
- —
Loan-product check · same deal, 3 products live
Conventional
25% down · 7.5% · 30yr
- Down + closing
- —
- Monthly P&I
- —
- Monthly cashflow
- —
- DSCR
- —
- Eligible?
- —
Personal DTI + credit; lowest rate.
DSCR
20% down · 8.5% · 30yr
- Down + closing
- —
- Monthly P&I
- —
- Monthly cashflow
- —
- DSCR
- —
- Eligible?
- —
No personal income docs; deal must DSCR.
Hard money
10% down · 12.0% · 12mo
- Down + closing
- —
- Monthly P&I
- —
- Monthly cashflow
- —
- DSCR
- —
- Eligible?
- —
Short-term bridge; refi at stabilization.
Listing history 19 events
-
2026-06-21days on market $166,000 Active 26 DOM
-
2026-06-19days on market $166,000 Active 24 DOM
-
2026-06-18days on market $166,000 Active 23 DOM
-
2026-06-17days on market $166,000 Active 22 DOM
-
2026-06-16days on market $166,000 Active 21 DOM
-
2026-06-15days on market $166,000 Active 20 DOM
-
2026-06-14days on market $166,000 Active 18 DOM
-
2026-06-13days on market $166,000 Active 17 DOM
-
2026-06-10days on market $166,000 Active 15 DOM
-
2026-06-09days on market $166,000 Active 14 DOM
-
2026-06-08days on market $166,000 Active 13 DOM
-
2026-06-07days on market $166,000 Active 12 DOM
-
2026-06-02days on market $166,000 Active 7 DOM
-
2026-06-01days on market $166,000 Active 6 DOM
-
2026-05-31days on market $166,000 Active 5 DOM
-
2026-05-30days on market $166,000 Active 4 DOM
-
2026-05-26$166,000 Active
-
2001-03-07soldstatus
-
1998-12-22soldstatus
ⓘ Source: listings_history table (triggers on properties + properties_extension) + one-shot
backfill from property_details.listing_events for pre-trigger history.
Tax reassessment forecast TX · Resets to sale price
- Current annual tax
- $1,135 · $95/mo
- Projected year-2 tax
- $3,038 · $253/mo
- Expected delta
- +$1,903/yr (+$159/mo · 167.6%)
ⓘ Screening estimate from a state-policy table — verify with the county assessor before closing.
Climate risk First Street
- Flood 1/10 Low FEMA zone X (unshaded) · 0% chance over 30 yrs
- Wildfire 4/10 Moderate
- Heat 7/10 Severe 7 d/yr ≥110°F today · 26 d/yr by 30 yrs out
- Wind 6/10 Major 61% chance of damaging wind over 30 yrs
- Air quality 2/10 Low 0 unhealthy d/yr today · 1 by 30 yrs out
Nearby sold comps map
Loading sold comps map…
Walkable amenities ~0.75 mi
Loading nearby amenities…
Taxation est. · year 1
- Rental income
- $20,240
- − Mortgage interest
- −$9,299
- − Property taxes
- −$1,135
- − Insurance
- −$830
- − Repairs & maintenance
- −$1,619
- − Management
- −$1,619
- − Depreciation
- −$4,829
- Taxable income
- $909
- Est. tax owed @ 24.0%
- −$218
- After-tax cash flow
- $3,360/yr
For passive investors: Depreciation is non-cash, so a rental often shows a tax loss while cash-flowing — sheltering income. Rental losses are passive: they offset passive income freely, and up to $25,000/yr can offset ordinary (W-2) income if you actively participate and your MAGI is under $100k (phasing out to $0 by $150k); unused losses carry forward. On sale, claimed depreciation is recaptured at up to 25%, and gains may owe capital-gains tax (a 1031 exchange can defer both). Figures are a year-1 estimate at your 24.0% rate — not tax advice; consult a CPA.
Schools (NCES district)
- District
- Brownsboro ISD
- NCES district ID
- 4811640
- Math proficiency
- 42% ▼ -5.00%
- Reading proficiency
- 46% ▬ 0.00%
- Median HH income
- $45,624
- Composite
- 37.38/100
- National rank
- #4429
- State rank
- #290 of 826 in TX
Livability — Athens
- Score
- 72/100
- State rank
- #241
- US rank
- #5796
Category grades
Schools grade is shown separately in the Schools card above.
Census & demographics
- City population
- 18,644
- Population (ZIP)
- 7,391
Population outlook (Henderson County) Hauer SSP2
- Today (2025)
- 80,471 people
- By 2030
- 80,608 · +0.2%
- By 2040
- 80,087 · -0.5%
- By 2050
- 78,208 · -2.8%
- By 2075
- 72,423 · -10.0%
- By 2100
- 61,012 · -24.2%
Race, ethnicity, and origin ACS 2023
- Neighborhood character
- Predominantly White (71%)
- Race & ethnicity
- White 71% Hispanic / Latino 20% Two or more races 13% Black 7%
- Hispanic origin (detail)
- Mexican 20%
- Common ancestry
- Slovak 5% Italian 3% Serbian 2%
- Foreign-born
- 7% · Canada
- Languages at home
- 85% English-only · Spanish 14% Other Asian/Pacific 1%
Political lean MEDSL · Henderson
- 2024 margin
- Solid R (+63.5) · D 18.0% · R 81.4%
- 2008→2024 swing
- -18.8pp toward R · 2008: -44.6pp · 2024: -63.5pp
- All cycles
- 2024: R+63.5 2020: R+60.2 2016: R+60.0 2012: R+54.8 2008: R+44.6
Not yet ingested
- Civics
- —
Market trends
- HPI YoY
- ▼ -73.92%
- Current HPI
- 200.117
- Rent YoY
- —
- Metro
- —
- State GDP YoY
- ▲ 3.95%
- F500 in state
- 110
Industry mix (Fortune 500 HQ in TX)
| Industry | F500 HQs | Revenue |
|---|---|---|
| Energy | 16 | $1,198B |
|
||
| Technology | 5 | $198B |
|
||
| Engineering / Construction | 4 | $72B |
|
||
| Energy Services | 3 | $60B |
|
||
| Utilities | 3 | $41B |
|
||
| Healthcare | 2 | $330B |
|
||
Price history
3 events — show timeline
- 2026-05-26 Listed $166,000 NTREIS
- 2001-03-07 Sold (Public Records) — Public Records
- 1998-12-22 Sold (Public Records) — Public Records
Property tax history
+2.5%/yrLatest (2025): $1,135 · +8.0% YoY. Source: county tax records.
Cash-flow waterfall
monthlySold comps — $/sqft
last 12 mo · ≤1 miLoading sold comps…