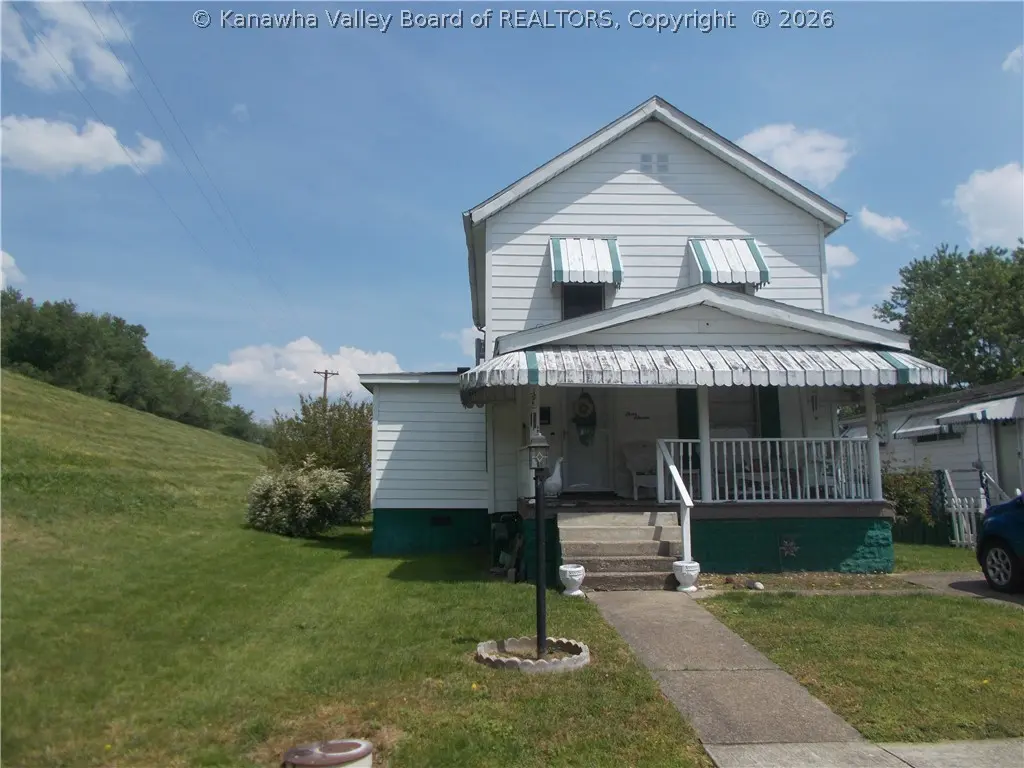
311 W 24th St · Huntington, WV
Flood risk 8/10 · Major
- FEMA flood zone
- X
- Chance of flooding over 30 yrs
- 0.78%
- Est. flood insurance / yr
- $507 – $1,088
Fire risk 3/10 · Minor
- Est. fire insurance / yr
- $787 – $1,461
Heat risk 5/10 · Moderate
- Hot days now (above 102°F)
- 7 days/yr
- Hot days in 30 yrs
- 19 days/yr
Wind risk 2/10 · Minimal
- Chance of severe wind over 30 yrs
- 2.0%
Air-quality risk 1/10 · Minimal
- Unhealthy air days now
- 0 days/yr
- Unhealthy air days in 30 yrs
- 0 days/yr
Risk factors via First Street. Map © Google.
Why this score? — see what drove the B+ grade
The composite is a weighted blend of 9 inputs, each scored 0–100. Each bar is that input's sub-score; the figure is the points it added to the 100-point composite (weight × sub-score).
- Cash flow +30.0/30.0
- ARV discount +15.0/15.0
- DSCR +10.0/10.0
- 1% rule +9.0/10.0
- Livability +4.0/5.0
- Schools +3.0/10.0
- Rent growth +2.5/5.0
- Condition / age +2.5/5.0
- Appreciation +0.0/10.0
$89,500
🖨 Deal sheet 📄 Offer letter ✓ Due diligence
Listing remarks
Located at the end of a street, this home offers a setting with convenient access to everyday amenities. Situated near shopping, medical facilities, and local businesses, with quick access to I-64 and routes to Kentucky and Ohio. Recent updates include a newer roof and HVAC system. This home features a privacy fence, storage building, and deck for outdoor use. Move-in ready and priced to sell!
Key facts
- Newer roof
- Storage building
- Privacy fence
Tags
Property features AI
Exterior
- Parking: Parking pad
- Security: Smoke detector(s)
- Utilities: Public water; Public sewer; Cable available
- Home design: Single family residence; Two-story
- Construction: Aluminum siding; Composition shingle roof
- Exterior features: Porch; Fenced yard; Exterior storage
Interior
- Kitchen: Dishwasher; Gas range; Microwave
- Bedrooms: 6 total rooms
- Flooring: Carpet; Laminate; Tile
- Bathrooms: 2 full bathrooms
- Heating & cooling: Forced air heating; Fireplace with insert; Central air; Window unit(s)
- Interior features: Eat-in kitchen; Storage
- Laundry & utility: Cable available
Neighborhood map
What this means for you Summary
Snapshot
- This is a 3-bed/2.0-bath single-family listed at $90k.
Deal economics
- At list price, monthly cash flow is $398 ($5k/yr) — positive.
- The deal already cash-flows at list — no discount required.
- Meets the 1% rule at list price ($1k rent vs $90k).
- Cap rate 12.5% vs local median 6.5% in Huntington — top-decile yield for the area; either an underpriced asset or a hidden risk that comps aren't pricing in. Stress-test before assuming the spread holds.
Location & tenants
- Location reads 79/100 on livability (#16 in WV, #2,045 nationally) — a middle-class / working-renter tenant base. Strengths: amenities A+, commute A+, cost of living A+; Watch: crime F, employment F.
- Cabell County Schools (urban): math 31% / reading 42% proficiency, ranked #13 of 55 in WV (top 24%) — families likely to look elsewhere, expect single-tenant / working-renter base with shorter leases.
- Zoned schools: Central City Elementary School (math 22% / reading 22%, grade F, #324 of 377 statewide, top 89%, 407 students, 0% FRL); Huntington Middle School (math 21% / reading 35%, grade F, #66 of 109 statewide, top 63%, 647 students, 0% FRL); Huntington High School (math 26% / reading 50%, grade F, #31 of 110 statewide, top 28%, 1,704 students, 0% FRL) — zoned schools average 0% FRL vs 47% district-wide (47 pts lower); this property's tenant base skews higher-income than the district average.
- Market conditions: 76 active listings in the ZIP; 1 comparable units currently listed for rent nearby; 61 units permitted in Cabell County in 2024 (5 in 5+ unit buildings).
Forward outlook
- Local home prices are declining (-3.0%/yr); year-one equity from $619 of loan paydown is wiped out by about $3k of value loss. Plan a longer hold.
- At projected returns (-3.0% appreciation + 3.0% rent growth), your $25k cash investment doubles in ~7 years — after that, you're playing with house money.
Negotiation context
- Only 3 days on market — expect competitive offers; lowballing is unlikely to land.
Risks & watch-outs
- Watch-outs: flood insurance adds $66/mo; built in 1900 — expect roof / HVAC / electrical / plumbing capex.
- Climate carrying-cost: severe flood risk; extreme-heat days projected 7→19/yr by 2055 (HVAC capex compounding) — expect insurance premiums to compound above CPI over the hold.
Questions for the listing agent
- Built in 1900 — when were the roof, HVAC, electrical panel, plumbing, and water heater last replaced?
- What's the actual annual flood-insurance premium (NFIP or private), and is the property in a SFHA with mandatory coverage?
- Is there a deadline driving the sale (1031 exchange, divorce, estate, relocation)? That informs how much negotiation room exists.
- Crime grade is F in this area — have there been break-ins, vandalism, or insurance claims at this property in the last 3 years? What carrier currently insures it and at what premium?
- What's the average days-on-market for RENTAL listings here right now (not sales)? A rising rental-DOM trend means longer vacancies and softer asking-rent achievability than the comps imply.
- What's the recent tenant-quality profile in this submarket — average credit score on applications, eviction rate, late-payment / NSF rate, and stable-employment percentage? A property-management company in the area should have these aggregated.
- How much new for-sale + rental construction is in the pipeline within 1–3 miles? Heavy new supply typically softens prices + rents 12–24 months out; constrained supply supports both.
Investment metrics
- 1% rule
- 1.40% ✓
- Cap rate
- 12.53%
- Cash-on-cash
- 22.26%
- DSCR
- 1.99
- GRM
- 6.0
CMA / ARV
- ARV (on-the-fly)
- $144,096
- Comps found
- 12
Show comp detail 12 sales within ~0.75 mi
| Address | Dist | Beds/Ba | Sqft | Sold | Price | $/sf | Match |
|---|---|---|---|---|---|---|---|
| 311 W 24th St | 0.00mi | 3/2.0 | 1,264 (0%) | 0mo | $100,000 | $79 | 100 |
| 2945 Piedmont Rd | 0.55mi | 2/2.0 (-1) | 1,241 (-2%) | 2mo | $55,000 | $44 | 65 |
| 3115 Brandon Rd | 0.57mi | 2/1.0 (-1) | 1,279 (+1%) | 2mo | $135,000 | $106 | 61 |
| 2971 Hughes St | 0.63mi | 3/1.0 | 1,296 (+2%) | 2mo | $153,750 | $119 | 60 |
| 2917 Auburn Rd | 0.41mi | 3/1.5 | 1,164 (-8%) | 10mo | $134,967 | $116 | 57 |
| 86 Township Road 1436 | 0.67mi | 3/1.5 | 1,248 (-1%) | 10mo | $175,000 | $140 | 56 |
| 3214 Hughes St | 0.75mi | 2/2.0 (-1) | 1,328 (+5%) | 3mo | $192,000 | $145 | 49 |
| 2105 Adams Ave | 0.28mi | 2/1.0 (-1) | 1,418 (+12%) | 14mo | $127,000 | $90 | 46 |
| 3022 Auburn Rd | 0.52mi | 3/2.0 | 1,102 (-13%) | 11mo | $169,900 | $154 | 45 |
| 1648 Jefferson Ave | 0.65mi | 3/2.0 | 1,104 (-13%) | 7mo | $88,000 | $80 | 42 |
| 527 26th St W | 0.24mi | 2/1.0 (-1) | 1,080 (-15%) | 18mo | $40,000 | $37 | 40 |
| 3203 Bradley Rd | 0.68mi | 3/1.5 | 1,439 (+14%) | 4mo | $163,500 | $114 | 40 |
Match score weights: distance 35% · size 25% · config 20% · recency 20%. Top-matched comps best support the ARV.
Projected returns pro-forma
-3.0% appreciation · 3.0% rent growth · sell at horizon
- IRR
- 11.0%
- Equity multiple
- 1.43×
- Total profit
- $10,877
- Equity at exit
- $13,345
- IRR
- 20.0%
- Equity multiple
- 2.68×
- Total profit
- $42,155
- Equity at exit
- $7,738
Cash invested: $25,060 (down + closing). Projections, not guarantees.
Landlord ↔ Tenant lean methodology
- Overall (STATE)
- 83 Strongly Landlord-Friendly
- State West Virginia
- 83 Strongly Landlord-Friendly · R+22
- County
- — inherits STATE
- City
- — inherits STATE
ZIP-level market 25704
- Home prices YoY
- -13.7%
- Active inventory
- 76
- Price-to-rent
- 6.0×
Monthly cashflow live
- Estimated rent
- $1,250 medium interval (Pro) →
- Mortgage (P&I)
- −$469
- Tax from tax record
- −$16 /mo · $191/yr
- Insurance
- −$37
- Flood insurance flood zone
- −$66 /mo · $798/yr
- HOA
- −$0
- Vacancy / Maint / Mgmt
- −$262
- Net cashflow
- $398
Break-even live
UW: 25.0% down · 7.5% · 30yr · 1.5% tax · 5.0% vac · 8.0% maint · 8.0% mgmt
Financing live
Cash to close
- Down payment
- $22,375
- Closing costs
- $2,685
- Reserves months
- —
- Total cash needed
- —
Loan-product check · same deal, 3 products live
Conventional
25% down · 7.5% · 30yr
- Down + closing
- —
- Monthly P&I
- —
- Monthly cashflow
- —
- DSCR
- —
- Eligible?
- —
Personal DTI + credit; lowest rate.
DSCR
20% down · 8.5% · 30yr
- Down + closing
- —
- Monthly P&I
- —
- Monthly cashflow
- —
- DSCR
- —
- Eligible?
- —
No personal income docs; deal must DSCR.
Hard money
10% down · 12.0% · 12mo
- Down + closing
- —
- Monthly P&I
- —
- Monthly cashflow
- —
- DSCR
- —
- Eligible?
- —
Short-term bridge; refi at stabilization.
Rent comps 1 comps
| Address | Beds | Baths | Sqft | Rent | $/sqft | DOM | Units | Dist |
|---|---|---|---|---|---|---|---|---|
| 457 Overby Rd Huntington, WV | 3.0 | 1.5 | 1724 | $1,250 | $0.73 | 43d | 1 | 1.47mi |
Listing history 2 events
-
2026-04-30status Pending
-
2026-04-27$89,500 Active
ⓘ Source: listings_history table (triggers on properties + properties_extension) + one-shot
backfill from property_details.listing_events for pre-trigger history.
Tax reassessment forecast WV · Resets to sale price
- Current annual tax
- $191 · $16/mo
- Projected year-2 tax
- $528 · $44/mo
- Expected delta
- +$337/yr (+$28/mo · 176.4%)
ⓘ Screening estimate from a state-policy table — verify with the county assessor before closing.
Climate risk First Street
- Flood 8/10 Severe FEMA zone X · 78% chance over 30 yrs
- Wildfire 3/10 Moderate
- Heat 5/10 Major 7 d/yr ≥102°F today · 19 d/yr by 30 yrs out
- Wind 2/10 Low 2% chance of damaging wind over 30 yrs
- Air quality 1/10 Low 0 unhealthy d/yr today · 0 by 30 yrs out
Nearby sold comps map
Loading sold comps map…
Walkable amenities ~0.75 mi
Loading nearby amenities…
Taxation est. · year 1
- Rental income
- $15,000
- − Mortgage interest
- −$5,013
- − Property taxes
- −$191
- − Insurance
- −$1,245
- − Repairs & maintenance
- −$1,200
- − Management
- −$1,200
- − Depreciation
- −$2,604
- Taxable income
- $3,547
- Est. tax owed @ 24.0%
- −$851
- After-tax cash flow
- $3,930/yr
For passive investors: Depreciation is non-cash, so a rental often shows a tax loss while cash-flowing — sheltering income. Rental losses are passive: they offset passive income freely, and up to $25,000/yr can offset ordinary (W-2) income if you actively participate and your MAGI is under $100k (phasing out to $0 by $150k); unused losses carry forward. On sale, claimed depreciation is recaptured at up to 25%, and gains may owe capital-gains tax (a 1031 exchange can defer both). Figures are a year-1 estimate at your 24.0% rate — not tax advice; consult a CPA.
Schools (NCES district)
- District
- Cabell County Schools
- NCES district ID
- 5400180
- Math proficiency
- 31% ▼ -7.00%
- Reading proficiency
- 42% ▼ -6.00%
- Median HH income
- $36,426
- Composite
- 30.26/100
- National rank
- #6285
- State rank
- #13 of 55 in WV
Livability — Huntington
- Score
- 79/100
- State rank
- #16
- US rank
- #2045
Category grades
Schools grade is shown separately in the Schools card above.
Census & demographics
- Census place
- Huntington, WV
- City population
- 25,795
- Population (ZIP)
- 14,413
Population outlook (Cabell County) Hauer SSP2
- Today (2025)
- 97,574 people
- By 2030
- 98,060 · +0.5%
- By 2040
- 98,817 · +1.3%
- By 2050
- 100,185 · +2.7%
- By 2075
- 105,895 · +8.5%
- By 2100
- 105,948 · +8.6%
Race, ethnicity, and origin ACS 2023
- Neighborhood character
- Predominantly White (93%)
- Race & ethnicity
- White 93% Two or more races 5% Black 2%
- Common ancestry
- Italian 3% Serbian 2% Slovak 2%
- Foreign-born
- 1% · Canada
- Languages at home
- 99% English-only · French/Haitian/Cajun 1%
Political lean MEDSL · Cabell
- 2024 margin
- Strong R (+21.9) · D 38.0% · R 59.9% · Other 2.0%
- 2008→2024 swing
- -11.8pp toward R · 2008: -10.1pp · 2024: -21.9pp
- All cycles
- 2024: R+21.9 2020: R+18.0 2016: R+25.5 2012: R+13.9 2008: R+10.1
Not yet ingested
- Civics
- —
Market trends
- HPI YoY
- ▼ -32.21%
- Current HPI
- 202.1322
- Rent YoY
- —
- Metro
- —
- State GDP YoY
- —
- F500 in state
- 0
Price history
2 events — show timeline
- 2026-04-30 Pending — KVBOR
- 2026-04-27 Listed $89,500 KVBOR
Property tax history
-13.4%/yrLatest (2025): $191 · -60.1% YoY. Source: county tax records.
Cash-flow waterfall
monthlySold comps — $/sqft
last 12 mo · ≤1 miLoading sold comps…