823 Lacey St SE · Lacey, WA
Flood risk 1/10 · Minimal
- FEMA flood zone
- X (unshaded)
- Chance of flooding over 30 yrs
- 0.0%
- Est. flood insurance / yr
- $507 – $1,088
Fire risk 2/10 · Minimal
- Est. fire insurance / yr
- $604 – $1,122
Heat risk 3/10 · Minor
- Hot days now (above 88°F)
- 7 days/yr
- Hot days in 30 yrs
- 14 days/yr
Wind risk 1/10 · Minimal
- Chance of severe wind over 30 yrs
- —
Air-quality risk 6/10 · Moderate
- Unhealthy air days now
- 7 days/yr
- Unhealthy air days in 30 yrs
- 8 days/yr
Risk factors via First Street. Map © Google.
Why this score? — see what drove the D- grade
The composite is a weighted blend of 9 inputs, each scored 0–100. Each bar is that input's sub-score; the figure is the points it added to the 100-point composite (weight × sub-score).
- ARV discount +15.0/15.0
- Cash flow +6.9/30.0
- Schools +5.1/10.0
- Livability +4.2/5.0
- Rent growth +3.4/5.0
- Condition / age +2.5/5.0
- 1% rule +1.2/10.0
- DSCR +1.1/10.0
- Appreciation +0.0/10.0
$298,500
🖨 Deal sheet (PDF) 📄 Offer letter ✓ Due diligence
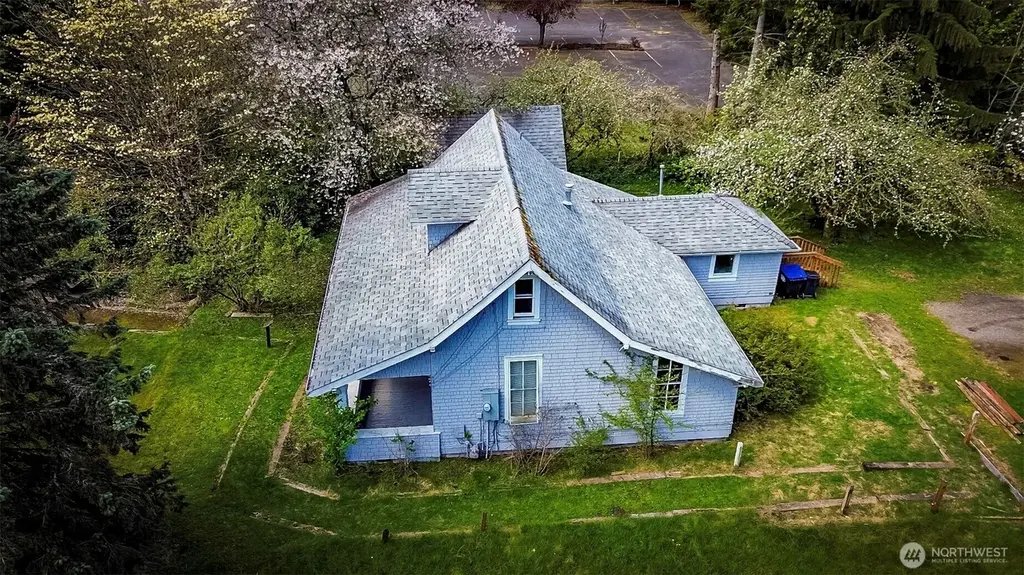
Listing remarks
The Historic Gallagher House of Lacey! This classic home is seeking a new owner who is ready to bring their creativity and vision to this charming property. It offers 3-bedrooms, 1-bath, and a small loft area that can be used for storage or another bedroom (on . 216 acre). The home offers great potential for restoration and personalization. A large, covered front porch welcomes guests and provides a comfortable space to relax. The property also includes a spacious yard, perfect for gardening enthusiasts, and features established fruit trees that add both beauty and utility to the landscape. The Gallagher House is conveniently situated near all Lacey amenities, including local coffee shops
Key facts
- Covered front porch
- Spacious yard
- Near lacey amenities
Tags
Neighborhood map
What this means for you Summary
Snapshot
- This is a 2-bed/1.0-bath single-family listed at $298k.
Deal economics
- At list price, monthly cash flow is $-453 ($-5k/yr) — negative.
- To cash-flow at today's rent, offer at most $219k (26.8% below list).
- To meet the 1% rule (rent ≥ 1% of price), the offer needs to be $184k (38.3% below list).
- Recommended offer: $184k (38.3% below list) — sets the bar for 1% rule.
- Cap rate 4.5% vs local median 3.0% in Lacey — top-decile yield for the area; either an underpriced asset or a hidden risk that comps aren't pricing in. Stress-test before assuming the spread holds.
Location & tenants
- Location reads 85/100 on livability (#33 in WA, #581 nationally) — a professional / high-income tenant draw. Strengths: amenities A+, commute A+, housing A+; Watch: cost of living D+.
- North Thurston Public Schools (suburban): math 51% / reading 62% proficiency, ranked #80 of 291 in WA (top 28%) — acceptable for families but not a draw, mixed tenant base, ~2y average lease.
- Market conditions: Rents rising (+3.6%/yr); 192 active listings in the ZIP; 31 comparable units currently listed for rent nearby; rentals at typical pace (median 22d on market — plan ~3-4 weeks tenant-placement turnaround); solid renter incomes; 1,222 units permitted in Thurston County in 2024 (508 in 5+ unit buildings).
Forward outlook
- Local home prices are declining (-3.0%/yr); year-one equity from $2k of loan paydown is wiped out by about $9k of value loss. Plan a longer hold.
- Thurston County population projected at +27% by 2050 — long-run rental-demand tailwind backs the buy-and-hold thesis.
Negotiation context
- It's been on market 41 days — a 3% lower offer ($290k) is reasonable based on typical stale-listing flexibility.
- 2 sale attempts since 8y ago with the ask held roughly flat each time — persistent listings suggest the price (not the market) is what's stuck; bring a comps-based counter.
- Current owner paid $140k; list at $298k implies a 113% gain — meaningful room to come down on a strong offer.
Risks & watch-outs
- Watch-outs: built in 1896 — expect roof / HVAC / electrical / plumbing capex.
Questions for the listing agent
- What do current leases actually rent for vs. the listed asking? Can we see a recent rent roll and the last 12 months of T-12 income?
- It's been on market 41 days. Have you received any prior offers? Is the seller open to a 38% concession, seller financing, or rate buy-down credit?
- Built in 1896 — when were the roof, HVAC, electrical panel, plumbing, and water heater last replaced?
- Is there a deadline driving the sale (1031 exchange, divorce, estate, relocation)? That informs how much negotiation room exists.
- Schools are B-rated — typically a magnet for longer-tenancy family renters. What's the average tenant stay here, and is there a school-zone premium baked into asking?
- The area grade is low — what's the realistic commute time and amenity access for the typical tenant pool here? Any planned neighborhood developments (good or bad) we should know about?
- What's the average days-on-market for RENTAL listings here right now (not sales)? A rising rental-DOM trend means longer vacancies and softer asking-rent achievability than the comps imply.
- What's the recent tenant-quality profile in this submarket — average credit score on applications, eviction rate, late-payment / NSF rate, and stable-employment percentage? A property-management company in the area should have these aggregated.
- How much new for-sale + rental construction is in the pipeline within 1–3 miles? Heavy new supply typically softens prices + rents 12–24 months out; constrained supply supports both.
Investment metrics
- 1% rule
- 0.62% ✗
- Cap rate
- 4.47%
- Cash-on-cash
- -6.50%
- DSCR
- 0.71
- GRM
- 13.5
CMA / ARV
- ARV (median comp)
- $410,792
- List price
- $298,500
- Delta
- -27.34%
- Verdict
- UNDERPRICED
- Comps
- 20 within 1.0 mi
Show comp detail 12 sales within ~0.75 mi
| Address | Dist | Beds/Ba | Sqft | Sold | Price | $/sf | Match |
|---|---|---|---|---|---|---|---|
| 1509 Dogwood St SE | 0.55mi | 3/1.0 (+1) | 1,040 (+7%) | 0mo | $429,000 | $413 | 57 |
| 1503 Dogwood St | 0.52mi | 3/1.0 (+1) | 1,040 (+7%) | 5mo | $380,000 | $365 | 54 |
| 5708 19TH Ave SE | 0.63mi | 3/1.0 (+1) | 1,032 (+6%) | 2mo | $430,000 | $417 | 53 |
| 543 Malibu Dr SE | 0.65mi | 2/1.0 | 880 (-9%) | 8mo | $352,000 | $400 | 48 |
| 1409 ALDER St SE | 0.49mi | 3/2.0 (+1) | 1,081 (+12%) | 5mo | $465,000 | $430 | 45 |
| 4802 15th Ave SE | 0.68mi | 2/1.0 | 864 (-11%) | 10mo | $375,000 | $434 | 42 |
| 4904 14th Ave SE | 0.62mi | 3/1.0 (+1) | 1,103 (+14%) | 2mo | $395,000 | $358 | 42 |
| 647 Malibu Dr SE | 0.59mi | 3/2.0 (+1) | 1,092 (+13%) | 2mo | $439,999 | $403 | 41 |
| 5703 20th Ave SE | 0.71mi | 3/1.0 (+1) | 1,024 (+6%) | 16mo | $405,000 | $396 | 39 |
| 637 Malibu Dr SE | 0.55mi | 3/2.0 (+1) | 1,092 (+13%) | 7mo | $420,000 | $385 | 39 |
| 547 Malibu Dr SE | 0.64mi | 3/1.5 (+1) | 1,048 (+8%) | 15mo | $375,000 | $358 | 37 |
| 1614 Gemini St SE | 0.63mi | 3/1.0 (+1) | 1,098 (+13%) | 7mo | $450,000 | $410 | 37 |
Match score weights: distance 35% · size 25% · config 20% · recency 20%. Top-matched comps best support the ARV.
Projected returns pro-forma
-3.0% appreciation · 3.56% rent growth · sell at horizon
- IRR
- -27.0%
- Equity multiple
- 0.09×
- Total profit
- $-76,232
- Equity at exit
- $44,507
- IRR
- -23.2%
- Equity multiple
- -0.19×
- Total profit
- $-99,463
- Equity at exit
- $25,809
Cash invested: $83,580 (down + closing). Projections, not guarantees.
Landlord ↔ Tenant lean methodology
- Overall (STATE)
- 28 Tenant-Leaning
- State Washington
- 28 Tenant-Leaning · D+8
- County
- — inherits STATE
- City
- — inherits STATE
ZIP-level market 98503
- Rents YoY
- 3.6%
- Active inventory
- 192
- Price-to-rent
- 13.5×
Monthly cashflow live
- Estimated rent
- $1,840 high interval (Pro) →
- Mortgage (P&I)
- −$1,565
- Tax from tax record
- −$217 /mo · $2,602/yr
- Insurance
- −$124
- HOA
- −$0
- Vacancy / Maint / Mgmt
- −$386
- Net cashflow
- $-453
Break-even live
Sensitivity live
| Price | -10% $-284 | -5% $-368 | +0% $-453 | +5% $-537 | +10% $-622 |
|---|---|---|---|---|---|
| Rent | -10% $-598 | -5% $-525 | +0% $-453 | +5% $-380 | +10% $-307 |
| Rate | -1.0pp $-302 | -0.5pp $-377 | base $-453 | +0.5pp $-530 | +1.0pp $-609 |
UW: 25.0% down · 7.5% · 30yr · 1.5% tax · 5.0% vac · 8.0% maint · 8.0% mgmt
Financing live
Cash to close
- Down payment
- $74,625
- Closing costs
- $8,955
- Reserves months
- —
- Total cash needed
- —
Loan-product check · same deal, 3 products live
Conventional
25% down · 7.5% · 30yr
- Down + closing
- —
- Monthly P&I
- —
- Monthly cashflow
- —
- DSCR
- —
- Eligible?
- —
Personal DTI + credit; lowest rate.
DSCR
20% down · 8.5% · 30yr
- Down + closing
- —
- Monthly P&I
- —
- Monthly cashflow
- —
- DSCR
- —
- Eligible?
- —
No personal income docs; deal must DSCR.
Hard money
10% down · 12.0% · 12mo
- Down + closing
- —
- Monthly P&I
- —
- Monthly cashflow
- —
- DSCR
- —
- Eligible?
- —
Short-term bridge; refi at stabilization.
Rent comps 31 comps
| Address | Beds | Baths | Sqft | Rent | $/sqft | DOM | Units | Dist |
|---|---|---|---|---|---|---|---|---|
| 6110 Pacific Ave SE Lacey, WA | 1.0–2.0 | 1.0 | 632 | $1,459 | $2.31 | 22d | 9 | 0.30mi |
| 5805 13th Ave SE Unit C Lacey, WA | 2.0 | 1.0 | 882 | $1,600 | $1.81 | 44d | 1 | 0.30mi |
| 1405 Clearbrook Dr SE Lacey, WA | 1.0–2.0 | 1.0–2.0 | 737 | $1,976 | $2.68 | 44d | 3 | 0.40mi |
| 6205 Pacific Ave SE Lacey, WA | 1.0–2.0 | 1.0–2.0 | 942 | $2,108 | $2.24 | 14d | 9 | 0.44mi |
| 660 Malibu Dr SE Lacey, WA | 1.0 | 1.0 | 824 | $1,900 | $2.31 | 44d | 1 | 0.58mi |
| 205 Carpenter Rd SE Lacey, WA | 1.0 | 1.0 | 563 | $1,420 | $2.52 | 14d | 5 | 0.77mi |
| 456 Carpenter Rd SE Lacey, WA | 1.0–3.0 | 1.0–3.0 | 1249 | $2,700 | $2.16 | 14d | 27 | 0.78mi |
| 444 Carpenter Rd SE Lacey, WA | 1.0 | 1.0 | 687 | $1,675 | $2.44 | 14d | 1 | 0.82mi |
| 444 Carpenter Rd SE Lacey, WA | 1.0–2.0 | 1.0–2.0 | 1049 | $2,049 | $1.95 | 44d | 2 | 0.82mi |
| 4444 6th Avenue SE Lacey, WA | 1.0 | 1.0 | 532 | $1,849 | $3.47 | 14d | 17 | 0.90mi |
| 4410 6th Ave SE Lacey, WA | 1.0–3.0 | 1.0–2.0 | 980 | $2,010 | $2.05 | 14d | 14 | 0.97mi |
| 1212 Willow St SE Unit 1212-I Olympia, WA | 2.0 | 1.0 | 871 | $1,595 | $1.83 | 22d | 1 | 1.02mi |
| 1224 Willow St SE Lacey, WA | 2.0 | 1.0 | 1000 | $2,000 | $2.00 | 22d | 1 | 1.03mi |
| 2570 Ruddell Rd SE Lacey, WA | 1.0 | 1.0 | 800 | $1,438 | $1.80 | 22d | 2 | 1.08mi |
| 4314 14th Way SE Lacey, WA | 2.0 | 1.0 | 938 | $2,500 | $2.67 | 44d | 1 | 1.08mi |
| 2700 Ruddell Rd SE Unit 2740-B Lacey, WA | 2.0 | 1.5 | 1054 | $1,695 | $1.61 | 44d | 1 | 1.09mi |
| 1245 Willow St SE Lacey, WA | 2.0 | 1.0 | 676 | $1,695 | $2.51 | 22d | 1 | 1.11mi |
| 1025 Neil St NE Apt 45 Olympia, WA | 2.0 | 1.0 | 900 | $1,775 | $1.97 | 44d | 1 | 1.28mi |
| 5499 15th Ave NE Lacey, WA | 1.0–3.0 | 1.0–2.0 | 904 | $2,106 | $2.33 | 14d | 26 | 1.28mi |
| 816 Union Mills Rd SE Unit 3 Lacey, WA | 2.0 | 1.0 | 950 | $1,940 | $2.04 | 22d | 1 | 1.28mi |
| 5701 30th Ave SE Lacey, WA | 2.0 | 2.0 | 899 | $1,503 | $1.67 | 14d | 2 | 1.30mi |
| 1331 Union Mills Rd SE #1 Olympia, WA | 2.0 | 1.5 | 944 | $1,850 | $1.96 | 14d | 1 | 1.31mi |
| 1025 Neil St NE Unit 20 Olympia, WA | 2.0 | 1.0 | 900 | $1,850 | $2.06 | 44d | 1 | 1.32mi |
| 1219 East St SE Apt 3 Lacey, WA | 2.0 | 1.0 | 850 | $1,615 | $1.90 | 44d | 1 | 1.35mi |
| 3928 14th Ave SE Lacey, WA | 1.0 | 1.0 | 580 | $1,222 | $2.11 | 22d | 2 | 1.36mi |
| 1025 Neil St NE Apt 1 Olympia, WA | 2.0 | 1.0 | 900 | $1,750 | $1.94 | 44d | 1 | 1.36mi |
| 948 Neil St NE Olympia, WA | 1.0 | 1.0 | 550 | $1,250 | $2.27 | 22d | 1 | 1.36mi |
| 1122 Neil St NE Olympia, WA | 2.0 | 1.0 | 792 | $1,350 | $1.70 | 14d | 1 | 1.43mi |
| 1122 Neil St NE Olympia, WA | 2.0 | 1.0 | 792 | $1,350 | $1.70 | 22d | 1 | 1.43mi |
| 5224 15th Ave NE Olympia, WA | 1.0–3.0 | 1.0–2.0 | 881 | $2,165 | $2.46 | 14d | 258 | 1.44mi |
| 3806 12th Ave SE Lacey, WA | 1.0–2.0 | 1.0 | 800 | $1,775 | $2.22 | 14d | 3 | 1.44mi |
Listing history 5 events
-
2026-04-16$298,500 Active
-
2018-04-12soldstatus $140,000 Sold
-
2018-04-12soldstatus $140,000
-
2018-03-23status Pending
-
2018-03-12$130,000 Active
ⓘ Source: listings_history table (triggers on properties + properties_extension) + one-shot
backfill from property_details.listing_events for pre-trigger history.
Tax reassessment forecast WA · Resets to sale price
- Current annual tax
- $2,602 · $217/mo
- Projected year-2 tax
- $2,925 · $244/mo
- Expected delta
- +$323/yr (+$27/mo · 12.4%)
ⓘ Screening estimate from a state-policy table — verify with the county assessor before closing.
Climate risk First Street
- Flood 1/10 Low FEMA zone X (unshaded) · 0% chance over 30 yrs
- Wildfire 2/10 Low
- Heat 3/10 Moderate 7 d/yr ≥88°F today · 14 d/yr by 30 yrs out
- Wind 1/10 Low
- Air quality 6/10 Major 7 unhealthy d/yr today · 8 by 30 yrs out
Nearby sold comps map
Loading sold comps map…
Walkable amenities ~0.75 mi
Loading nearby amenities…
Taxation est. · year 1
- Rental income
- $22,083
- − Mortgage interest
- −$16,721
- − Property taxes
- −$2,602
- − Insurance
- −$1,492
- − Repairs & maintenance
- −$1,767
- − Management
- −$1,767
- − Depreciation
- −$8,684
- Taxable loss
- −$10,949
- Est. tax savings @ 24.0%
- +$2,628
- After-tax cash flow
- $-2,805/yr
For passive investors: Depreciation is non-cash, so a rental often shows a tax loss while cash-flowing — sheltering income. Rental losses are passive: they offset passive income freely, and up to $25,000/yr can offset ordinary (W-2) income if you actively participate and your MAGI is under $100k (phasing out to $0 by $150k); unused losses carry forward. On sale, claimed depreciation is recaptured at up to 25%, and gains may owe capital-gains tax (a 1031 exchange can defer both). Figures are a year-1 estimate at your 24.0% rate — not tax advice; consult a CPA.
Schools (NCES district)
- District
- North Thurston Public Schools
- NCES district ID
- 5305850
- Math proficiency
- 51% ▬ 0.00%
- Reading proficiency
- 62% ▬ 0.00%
- Median HH income
- $62,338
- Composite
- 51.09/100
- National rank
- #3798
- State rank
- #80 of 291 in WA
Livability — Lacey
- Score
- 85/100
- State rank
- #33
- US rank
- #581
Category grades
Schools grade is shown separately in the Schools card above.
Census & demographics
- Census place
- Lacey, WA
- County
- Thurston County · 269,345 people
- City population
- 108,850
- Metro
- Olympia-Lacey-Tumwater, WA
- Population (ZIP)
- 41,656
- Household income
- $89,002
- Rent vs Own
- Severe rent burden
- 2195.0
Population outlook (Thurston County) Hauer SSP2
- Today (2025)
- 308,239 people
- By 2030
- 326,483 · +5.9%
- By 2040
- 359,890 · +16.8%
- By 2050
- 391,800 · +27.1%
- By 2075
- 468,024 · +51.8%
- By 2100
- 519,890 · +68.7%
Race, ethnicity, and origin ACS 2023
- Neighborhood character
- Diverse neighborhood (Simpson 0.56)
- Race & ethnicity
- White 65% Two or more races 12% Hispanic / Latino 12% Asian 7% Black 5% Pacific Islander 2% Native American 1%
- Hispanic origin (detail)
- Mexican 8% Puerto Rican 1%
- Common ancestry
- Portuguese 4% Slovak 3% Lithuanian 3%
- Foreign-born
- 10% · Canada, Vietnam, South Korea
- Languages at home
- 82% English-only · Spanish 6% German/W. Germanic 3% Other Asian/Pacific 2%
Political lean MEDSL · Thurston
- 2024 margin
- Strong D (+20.4) · D 58.5% · R 38.1% · Other 3.5%
- 2008→2024 swing
- -1.3pp toward R · 2008: 21.7pp · 2024: 20.4pp
- All cycles
- 2024: D+20.4 2020: D+18.6 2016: D+15.4 2012: D+19.0 2008: D+21.7
Not yet ingested
- Civics
- —
Market trends
- HPI YoY
- ▼ -385.93%
- Current HPI
- 361.0974
- Rent YoY
- ▲ 3.56%
- Metro
- Olympia-Lacey-Tumwater, WA
- State GDP YoY
- ▲ 4.65%
- F500 in state
- 22
Industry mix (Fortune 500 HQ in WA)
| Industry | F500 HQs | Revenue |
|---|---|---|
| Retail | 2 | $269B |
|
||
| Technology / Retail | 1 | $638B |
|
||
| Technology | 1 | $245B |
|
||
| Telecommunications | 1 | $38B |
|
||
| Food / Beverage | 1 | $36B |
|
||
| Automotive / Trucks | 1 | $34B |
|
||
Price history
+129.6% since first listed5 events — show timeline
- 2026-04-16 Listed $298,500 NWMLS as Distributed by MLS Grid
- 2018-04-12 Sold (Public Records) $140,000 Public Records
- 2018-04-12 Sold (MLS) $140,000 NWMLS as Distributed by MLS Grid
- 2018-03-23 Pending — NWMLS as Distributed by MLS Grid
- 2018-03-12 Listed $130,000 NWMLS as Distributed by MLS Grid
Property tax history
+3.9%/yrLatest (2026): $2,602 · +5.9% YoY. Source: county tax records.
Cash-flow waterfall
monthlySold comps — $/sqft
last 12 mo · ≤1 miLoading sold comps…