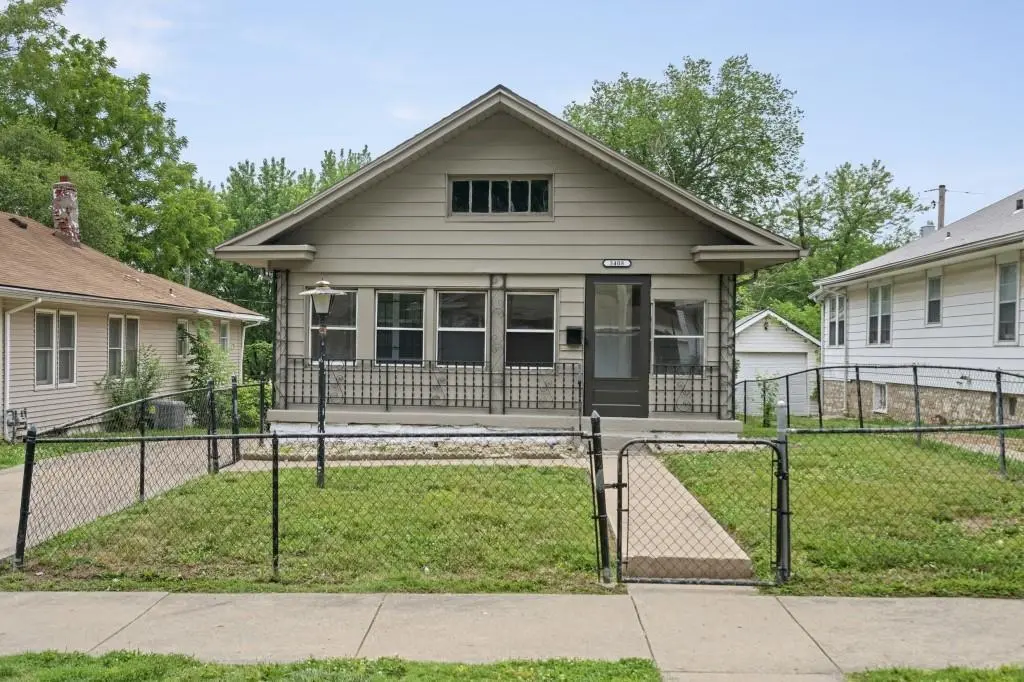
3408 Mersington Ave · Kansas City, MO
Flood risk 1/10 · Minimal
- FEMA flood zone
- X (unshaded)
- Chance of flooding over 30 yrs
- 0.0%
- Est. flood insurance / yr
- $473 – $860
Fire risk 1/10 · Minimal
- Est. fire insurance / yr
- $1,054 – $1,958
Heat risk 4/10 · Minor
- Hot days now (above 107°F)
- 7 days/yr
- Hot days in 30 yrs
- 17 days/yr
Wind risk 2/10 · Minimal
- Chance of severe wind over 30 yrs
- —
Air-quality risk 3/10 · Minor
- Unhealthy air days now
- 2 days/yr
- Unhealthy air days in 30 yrs
- 3 days/yr
Risk factors via First Street. Map © Google.
Why this score? — see what drove the C grade
The composite is a weighted blend of 9 inputs, each scored 0–100. Each bar is that input's sub-score; the figure is the points it added to the 100-point composite (weight × sub-score).
- Cash flow +23.2/30.0
- Appreciation +10.0/10.0
- DSCR +7.4/10.0
- 1% rule +5.0/10.0
- Livability +3.9/5.0
- Rent growth +3.7/5.0
- Condition / age +2.5/5.0
- Schools +1.5/10.0
- ARV discount +0.0/15.0
$118,000
🖨 Deal sheet (PDF) 📄 Offer letter ✓ Due diligence
Listing remarks MLS
Welcome home to this cozy and well-maintained 2-bedroom, 1-bath gem that perfectly blends comfort and potential. From the moment you step inside, you’ll appreciate the inviting atmosphere and thoughtful upkeep that makes this home truly move-in ready. Whether you're a first-time buyer or looking to downsize, this charming property offers a warm and welcoming space to make your own. The unfinished basement provides incredible potential for additional living space, storage, or a custom renovation to fit your needs. Outside, you’ll find a detached garage—a rare and valuable feature for homes in this area—offering convenience and extra storage. With its solid condition, unique features, and opportunity to add value, this home is one you won’t want to miss!
Key facts
- Unfinished basement
- Detached garage
- 4,940 sq ft lot
Tags
Neighborhood map
What this means for you Summary
Snapshot
- This is a 2-bed/1.0-bath single-family listed at $118k.
Deal economics
- At list price, monthly cash flow is $213 ($3k/yr) — positive.
- The deal already cash-flows at list — no discount required.
- To meet the 1% rule (rent ≥ 1% of price), the offer needs to be $118k (0.2% below list).
- Recommended offer: $111k (6.0% below list) — sets the bar for market timing.
- Cap rate 8.5% vs local median 3.9% in Kansas City — top-decile yield for the area; either an underpriced asset or a hidden risk that comps aren't pricing in. Stress-test before assuming the spread holds.
Location & tenants
- Location reads 78/100 on livability (#28 in MO, #2,671 nationally) — a middle-class / working-renter tenant base. Strengths: amenities A+, commute A+, cost of living A+; Watch: crime F.
- Kansas City 33 (urban): math 12% / reading 24% proficiency, ranked #308 of 324 in MO (top 95%) — low school quality limits family demand, transient renter base, plan for 1-2y turnover; 75% free/reduced lunch — lower-income household profile, screen leases tightly.
- Zoned schools: Ac Prep Elementary (math 12% / reading 27%, grade F, #941 of 1,115 statewide, top 86%, 341 students, 99% FRL); Central Middle School (math 0% / reading 9%, grade F, #388 of 391 statewide, top 99%, 428 students, 99% FRL); Central High School (math 2% / reading 17%, grade F, #507 of 521 statewide, top 98%, 535 students, 99% FRL) — zoned schools average 99% FRL vs 75% district-wide (24 pts higher); higher-poverty schools than district average — tighter screening recommended.
- Market conditions: Rents rising fast (+4.7%/yr); 87 active listings in the ZIP; 40 comparable units currently listed for rent nearby; rentals at typical pace (median 19d on market — plan ~3-4 weeks tenant-placement turnaround); lower-income renter base — watch delinquency; 4,002 units permitted in Jackson County in 2024 (2,271 in 5+ unit buildings).
- This rent runs 39% of the median local income ($36k/yr) — at the standard rent-burdened threshold; future hikes will face affordability resistance.
Forward outlook
- In year one you build about $13k of equity ($816 loan paydown + $12k appreciation (10.0% local appreciation)).
- Jackson County population projected at +4% by 2050 — modest demand growth; plan on rents tracking national, not racing it.
- At projected returns (10.0% appreciation + 4.7% rent growth), your $33k cash investment doubles in ~3 years — after that, you're playing with house money.
- By year 3, paydown + projected appreciation supports a ~$32k cash-out refi (75% LTV) — recoverable capital for the next deal without selling this one.
Negotiation context
- It's been on market 86 days — a 6% lower offer ($111k) is reasonable based on typical stale-listing flexibility.
- 7 sale attempts since 3y ago; this cycle's ask is 774% above the opening price — seller raised mid-cycle; expect resistance to lowballs.
Risks & watch-outs
- Watch-outs: built in 1922 — expect roof / HVAC / electrical / plumbing capex.
Questions for the listing agent
- It's been on market 86 days. Have you received any prior offers? Is the seller open to a 6% concession, seller financing, or rate buy-down credit?
- Built in 1922 — when were the roof, HVAC, electrical panel, plumbing, and water heater last replaced?
- Why hasn't it sold? Are there any deal-killer items the seller is aware of (foundation, flood, title, zoning, code violations)?
- Is there a deadline driving the sale (1031 exchange, divorce, estate, relocation)? That informs how much negotiation room exists.
- Crime grade is F in this area — have there been break-ins, vandalism, or insurance claims at this property in the last 3 years? What carrier currently insures it and at what premium?
- What's the average days-on-market for RENTAL listings here right now (not sales)? A rising rental-DOM trend means longer vacancies and softer asking-rent achievability than the comps imply.
- What's the recent tenant-quality profile in this submarket — average credit score on applications, eviction rate, late-payment / NSF rate, and stable-employment percentage? A property-management company in the area should have these aggregated.
- How much new for-sale + rental construction is in the pipeline within 1–3 miles? Heavy new supply typically softens prices + rents 12–24 months out; constrained supply supports both.
Investment metrics
- 1% rule
- 1.00% ✗
- Cap rate
- 8.46%
- Cash-on-cash
- 7.74%
- DSCR
- 1.34
- GRM
- 8.4
CMA / ARV
- ARV (median comp)
- $80,241
- List price
- $118,000
- Delta
- 47.06%
- Verdict
- OVERPRICED
- Comps
- 20 within 1.0 mi
Show comp detail 12 sales within ~0.75 mi
| Address | Dist | Beds/Ba | Sqft | Sold | Price | $/sf | Match |
|---|---|---|---|---|---|---|---|
| 3423 Cleveland Ave | 0.05mi | 2/1.0 | 792 (0%) | 9mo | $80,000 | $101 | 90 |
| 3304 Norton St | 0.19mi | 2/1.0 | 792 (0%) | 9mo | $90,000 | $114 | 84 |
| 3224 Lister Ave | 0.54mi | 2/1.0 | 792 (0%) | 3mo | $30,000 | $38 | 72 |
| 3625 Jackson Ave | 0.36mi | 2/1.0 | 809 (+2%) | 10mo | $110,000 | $136 | 72 |
| 3601 Norton Ave | 0.27mi | 2/1.0 | 725 (-8%) | 3mo | $40,000 | $55 | 71 |
| 3938 Myrtle Ave | 0.69mi | 2/1.0 | 805 (+2%) | 0mo | $65,000 | $81 | 65 |
| 3133 Chelsea Ave | 0.66mi | 2/1.0 | 762 (-4%) | 1mo | $78,990 | $104 | 62 |
| 3630 Jackson Ave | 0.34mi | 2/1.0 | 888 (+12%) | 5mo | $59,000 | $66 | 60 |
| 3624 Mersington Ave | 0.27mi | 2/1.0 | 888 (+12%) | 9mo | $76,000 | $86 | 60 |
| 3640 Cleveland Ave | 0.32mi | 2/2.0 | 900 (+14%) | 4mo | $105,000 | $117 | 55 |
| 3942 Myrtle Ave | 0.70mi | 2/1.0 | 890 (+12%) | 3mo | $85,000 | $96 | 45 |
| 3927 Kensington Ave | 0.74mi | 3/1.0 (+1) | 864 (+9%) | 11mo | $60,000 | $69 | 36 |
Match score weights: distance 35% · size 25% · config 20% · recency 20%. Top-matched comps best support the ARV.
Projected returns pro-forma
10.0% appreciation · 4.65% rent growth · sell at horizon
- IRR
- 30.5%
- Equity multiple
- 3.41×
- Total profit
- $79,777
- Equity at exit
- $106,304
- IRR
- 26.9%
- Equity multiple
- 7.92×
- Total profit
- $228,488
- Equity at exit
- $229,248
Cash invested: $33,040 (down + closing). Projections, not guarantees.
Landlord ↔ Tenant lean methodology
- Overall (STATE)
- 81 Strongly Landlord-Friendly
- State Missouri
- 81 Strongly Landlord-Friendly · R+10
- County
- — inherits STATE
- City
- — inherits STATE
ZIP-level market 64128
- Home prices YoY
- 21.6%
- Rents YoY
- 4.7%
- Active inventory
- 87
- Price-to-rent
- 8.4×
Monthly cashflow live
- Estimated rent
- $1,177 high interval (Pro) →
- Mortgage (P&I)
- −$619
- Tax from tax record
- −$49 /mo · $590/yr
- Insurance
- −$49
- HOA
- −$0
- Vacancy / Maint / Mgmt
- −$247
- Net cashflow
- $213
Break-even live
Sensitivity live
| Price | -10% $280 | -5% $246 | +0% $213 | +5% $180 | +10% $146 |
|---|---|---|---|---|---|
| Rent | -10% $120 | -5% $167 | +0% $213 | +5% $260 | +10% $306 |
| Rate | -1.0pp $272 | -0.5pp $243 | base $213 | +0.5pp $182 | +1.0pp $151 |
UW: 25.0% down · 7.5% · 30yr · 1.5% tax · 5.0% vac · 8.0% maint · 8.0% mgmt
Financing live
Cash to close
- Down payment
- $29,500
- Closing costs
- $3,540
- Reserves months
- —
- Total cash needed
- —
Loan-product check · same deal, 3 products live
Conventional
25% down · 7.5% · 30yr
- Down + closing
- —
- Monthly P&I
- —
- Monthly cashflow
- —
- DSCR
- —
- Eligible?
- —
Personal DTI + credit; lowest rate.
DSCR
20% down · 8.5% · 30yr
- Down + closing
- —
- Monthly P&I
- —
- Monthly cashflow
- —
- DSCR
- —
- Eligible?
- —
No personal income docs; deal must DSCR.
Hard money
10% down · 12.0% · 12mo
- Down + closing
- —
- Monthly P&I
- —
- Monthly cashflow
- —
- DSCR
- —
- Eligible?
- —
Short-term bridge; refi at stabilization.
Rent comps 40 comps
| Address | Beds | Baths | Sqft | Rent | $/sqft | DOM | Units | Dist |
|---|---|---|---|---|---|---|---|---|
| 3437 Jackson Ave Kansas City, MO | 2.0 | 1.0 | 700 | $1,150 | $1.64 | 18d | 1 | 0.24mi |
| 3547 Jackson Ave Kansas City, MO | 3.0 | 1.0 | 1104 | $1,255 | $1.14 | 0d | 1 | 0.30mi |
| 3310 College Ave Kansas City, MO | 3.0 | 1.0 | 874 | $995 | $1.14 | 45d | 1 | 0.38mi |
| 3330 Agnes Ave Kansas City, MO | 3.0 | 1.0 | 1000 | $1,410 | $1.41 | 45d | 1 | 0.55mi |
| 3736 Cypress Ave Kansas City, MO | 3.0 | 1.0 | 1100 | $1,200 | $1.09 | 9d | 1 | 0.57mi |
| 3032 Elmwood Ave Kansas City, MO | 3.0 | 1.0 | 1027 | $1,275 | $1.24 | 9d | 1 | 0.67mi |
| 3118 Chelsea Ave Kansas City, MO | 2.0 | 1.0 | 864 | $980 | $1.13 | 45d | 1 | 0.69mi |
| 4005 Bales Ave Kansas City, MO | 2.0 | 1.0 | 792 | $1,050 | $1.33 | 45d | 1 | 0.72mi |
| 4028 Myrtle Ave Kansas City, MO | 3.0 | 1.0 | 1100 | $1,490 | $1.35 | 45d | 1 | 0.76mi |
| 4902 E 39th St Kansas City, MO | 2.0 | 1.0 | 820 | $1,300 | $1.59 | 18d | 1 | 0.82mi |
| 3710 Wabash Ave Unit 2S Kansas City, MO | 2.0 | 1.0 | 875 | $850 | $0.97 | 25d | 1 | 0.88mi |
| 2637 E 29th St Unit 3 Kansas City, MO | 2.0 | 1.0 | 954 | $1,050 | $1.10 | 45d | 1 | 0.91mi |
| 3243 Denver Dr Kansas City, MO | 1.0–3.0 | 1.0 | 862 | $1,088 | $1.26 | 45d | 1 | 0.94mi |
| 3233 Park Ave Unit 2 Kansas City, MO | 2.0 | 1.0 | 950 | $1,000 | $1.05 | 25d | 1 | 0.96mi |
| 3233 Park Ave Unit 1 Kansas City, MO | 2.0 | 1.0 | 950 | $1,075 | $1.13 | 45d | 1 | 0.96mi |
| 4216 Cleveland Ave Kansas City, MO | 2.0 | 1.0 | 780 | $1,125 | $1.44 | 18d | 1 | 0.97mi |
| 4144 College Ave Kansas City, MO | 3.0 | 1.0 | 1108 | $1,095 | $0.99 | 25d | 1 | 0.97mi |
| 3417 Brooklyn Ave Kansas City, MO | 3.0 | 1.5 | 945 | $1,595 | $1.69 | 0d | 1 | 1.00mi |
| 5108 E 30th St Kansas City, MO | 3.0 | 1.0 | 960 | $1,400 | $1.46 | 5d | 1 | 1.00mi |
| 3841 Olive St Kansas City, MO | 2.0 | 1.0 | 792 | $985 | $1.24 | 16d | 1 | 1.01mi |
| 2614 Indiana Ave Kansas City, MO | 3.0 | 1.0 | 1122 | $1,300 | $1.16 | 0d | 1 | 1.06mi |
| 2701 Benton Blvd Unit 2705-3 Kansas City, MO | 2.0 | 1.0 | 800 | $1,200 | $1.50 | 9d | 1 | 1.08mi |
| 2701 Benton Blvd Unit 2703-2 Kansas City, MO | 2.0 | 1.0 | 800 | $1,200 | $1.50 | 4d | 1 | 1.08mi |
| 2404 E 29th St Apt 2W Kansas City, MO | 2.0 | 1.0 | 850 | $900 | $1.06 | 0d | 1 | 1.12mi |
| 4309 College Ave Kansas City, MO | 3.0 | 2.0 | 1040 | $1,550 | $1.49 | 18d | 1 | 1.12mi |
| 2855 Van Brunt Blvd Unit A Kansas City, MO | 2.0 | 1.0 | 744 | $1,080 | $1.45 | 45d | 1 | 1.21mi |
| 2447 Norton Ave Kansas City, MO | 2.0 | 1.0 | 800 | $976 | $1.22 | 18d | 1 | 1.22mi |
| 2305 E 41st St Kansas City, MO | 2.0 | 1.0 | 750 | $1,000 | $1.33 | 9d | 1 | 1.23mi |
| 3911 Oakley Ave Kansas City, MO | 2.0 | 1.0 | 816 | $1,195 | $1.46 | 14d | 1 | 1.25mi |
| 2454 Cypress Ave Kansas City, MO | 3.0 | 1.0 | 800 | $1,300 | $1.62 | 6d | 1 | 1.27mi |
| 2424 Norton Ave Unit B Kansas City, MO | 3.0 | 1.0 | 982 | $1,150 | $1.17 | 0d | 1 | 1.28mi |
| 2424 Norton Ave Unit B Kansas City, MO | 3.0 | 1.0 | 982 | $1,150 | $1.17 | 18d | 1 | 1.28mi |
| 5601 E 39th Ter Kansas City, MO | 3.0 | 1.0 | 816 | $1,225 | $1.50 | 5d | 1 | 1.28mi |
| 2419 Bales Ave Kansas City, MO | 3.0 | 1.5 | 1116 | $1,500 | $1.34 | 5d | 1 | 1.32mi |
| 4427 Agnes Ave Kansas City, MO | 3.0 | 1.0 | 1100 | $1,350 | $1.23 | 18d | 1 | 1.35mi |
| 2454 Benton Blvd Unit 2460-3 Kansas City, MO | 1.0 | 1.0 | 750 | $1,100 | $1.47 | 19d | 1 | 1.35mi |
| 2454 Benton Blvd Unit 2456-1 Kansas City, MO | 1.0 | 1.0 | 750 | $1,000 | $1.33 | 19d | 1 | 1.35mi |
| 2454 Benton Blvd Unit 2458-2 Kansas City, MO | 1.0 | 1.0 | 750 | $1,000 | $1.33 | 9d | 1 | 1.35mi |
| 5636 E 40th St Kansas City, MO | 3.0 | 1.0 | 816 | $1,225 | $1.50 | 5d | 1 | 1.35mi |
| 5700 E 40th St Kansas City, MO | 3.0 | 1.0 | 816 | $1,245 | $1.53 | 23d | 1 | 1.35mi |
Listing history 37 events
-
2026-06-21days on market $118,000 Active 86 DOM
-
2026-06-18days on market $118,000 Active 83 DOM
-
2026-06-17days on market $118,000 Active 82 DOM
-
2026-06-16days on market $118,000 Active 81 DOM
-
2026-06-15days on market $118,000 Active 80 DOM
-
2026-06-13days on market $118,000 Active 78 DOM
-
2026-06-09days on market $118,000 Active 74 DOM
-
2026-06-08days on market $118,000 Active 73 DOM
-
2026-06-07days on market $118,000 Active 72 DOM
-
2026-06-05days on market $118,000 Active 69 DOM
-
2026-06-03days on market $118,000 Active 68 DOM
-
2026-06-02days on market $118,000 Active 67 DOM
-
2026-06-01days on market $118,000 Active 66 DOM
-
2026-05-31days on market $118,000 Active 65 DOM
-
2026-05-01price $118,000 792-char remark
Show marketing remark (792 chars)
Welcome home to this cozy and well-maintained 2-bedroom, 1-bath gem that perfectly blends comfort and potential. From the moment you step inside, you’ll appreciate the inviting atmosphere and thoughtful upkeep that makes this home truly move-in ready. Whether you're a first-time buyer or looking to downsize, this charming property offers a warm and welcoming space to make your own. The unfinished basement provides incredible potential for additional living space, storage, or a custom renovation to fit your needs. Outside, you’ll find a detached garage—a rare and valuable feature for homes in this area—offering convenience and extra storage. With its solid condition, unique features, and opportunity to add value, this home is one you won’t want to miss!
-
2026-04-14price $125,000 792-char remark
Show marketing remark (792 chars)
Welcome home to this cozy and well-maintained 2-bedroom, 1-bath gem that perfectly blends comfort and potential. From the moment you step inside, you’ll appreciate the inviting atmosphere and thoughtful upkeep that makes this home truly move-in ready. Whether you're a first-time buyer or looking to downsize, this charming property offers a warm and welcoming space to make your own. The unfinished basement provides incredible potential for additional living space, storage, or a custom renovation to fit your needs. Outside, you’ll find a detached garage—a rare and valuable feature for homes in this area—offering convenience and extra storage. With its solid condition, unique features, and opportunity to add value, this home is one you won’t want to miss!
-
2026-03-27price $135,000 792-char remark
Show marketing remark (792 chars)
Welcome home to this cozy and well-maintained 2-bedroom, 1-bath gem that perfectly blends comfort and potential. From the moment you step inside, you’ll appreciate the inviting atmosphere and thoughtful upkeep that makes this home truly move-in ready. Whether you're a first-time buyer or looking to downsize, this charming property offers a warm and welcoming space to make your own. The unfinished basement provides incredible potential for additional living space, storage, or a custom renovation to fit your needs. Outside, you’ll find a detached garage—a rare and valuable feature for homes in this area—offering convenience and extra storage. With its solid condition, unique features, and opportunity to add value, this home is one you won’t want to miss!
-
2026-03-27$13,500 Active 792-char remark
Show marketing remark (792 chars)
Welcome home to this cozy and well-maintained 2-bedroom, 1-bath gem that perfectly blends comfort and potential. From the moment you step inside, you’ll appreciate the inviting atmosphere and thoughtful upkeep that makes this home truly move-in ready. Whether you're a first-time buyer or looking to downsize, this charming property offers a warm and welcoming space to make your own. The unfinished basement provides incredible potential for additional living space, storage, or a custom renovation to fit your needs. Outside, you’ll find a detached garage—a rare and valuable feature for homes in this area—offering convenience and extra storage. With its solid condition, unique features, and opportunity to add value, this home is one you won’t want to miss!
-
2026-01-15historical
-
2025-09-07$116,000 Active
-
2025-09-05historical
-
2025-07-04historical $1,100
-
2025-06-13$1,100
-
2025-05-22historical
-
2025-04-24price $119,000
-
2025-04-12status Active
-
2025-03-29historical Active Under Contract
-
2025-03-05price $125,000
-
2024-10-15price $120,000
-
2024-10-07$128,000 Active
-
2024-03-01soldstatus
-
2023-10-15historical
-
2023-06-20status Active
-
2023-06-20status Pending
-
2023-06-11$125,000 Active
-
2023-05-02soldstatus
-
2001-03-20soldstatus
ⓘ Source: listings_history table (triggers on properties + properties_extension) + one-shot
backfill from property_details.listing_events for pre-trigger history.
Tax reassessment forecast MO · Resets to sale price
- Current annual tax
- $590 · $49/mo
- Projected year-2 tax
- $1,145 · $95/mo
- Expected delta
- +$555/yr (+$46/mo · 94.1%)
ⓘ Screening estimate from a state-policy table — verify with the county assessor before closing.
Climate risk First Street
- Flood 1/10 Low FEMA zone X (unshaded) · 0% chance over 30 yrs
- Wildfire 1/10 Low
- Heat 4/10 Moderate 7 d/yr ≥107°F today · 17 d/yr by 30 yrs out
- Wind 2/10 Low
- Air quality 3/10 Moderate 2 unhealthy d/yr today · 3 by 30 yrs out
Nearby sold comps map
Loading sold comps map…
Walkable amenities ~0.75 mi
Loading nearby amenities…
Taxation est. · year 1
- Rental income
- $14,129
- − Mortgage interest
- −$6,610
- − Property taxes
- −$590
- − Insurance
- −$590
- − Repairs & maintenance
- −$1,130
- − Management
- −$1,130
- − Depreciation
- −$3,433
- Taxable income
- $646
- Est. tax owed @ 24.0%
- −$155
- After-tax cash flow
- $2,401/yr
For passive investors: Depreciation is non-cash, so a rental often shows a tax loss while cash-flowing — sheltering income. Rental losses are passive: they offset passive income freely, and up to $25,000/yr can offset ordinary (W-2) income if you actively participate and your MAGI is under $100k (phasing out to $0 by $150k); unused losses carry forward. On sale, claimed depreciation is recaptured at up to 25%, and gains may owe capital-gains tax (a 1031 exchange can defer both). Figures are a year-1 estimate at your 24.0% rate — not tax advice; consult a CPA.
Schools (NCES district)
- District
- Kansas City 33
- NCES district ID
- 2916400
- Math proficiency
- 12% ▼ -8.00%
- Reading proficiency
- 24% ▬ 0.00%
- Median HH income
- $35,227
- Composite
- 14.8/100
- National rank
- #9387
- State rank
- #308 of 324 in MO
Livability — Kansas City
- Score
- 78/100
- State rank
- #28
- US rank
- #2671
Category grades
Schools grade is shown separately in the Schools card above.
Census & demographics
- Census place
- Kansas City, MO
- County
- Jackson County · 687,798 people
- City population
- 439,467
- Metro
- Kansas City, MO-KS
- Population (ZIP)
- 11,912
- Household income
- $36,088
- Rent vs Own
- Severe rent burden
- 946.0
Population outlook (Jackson County) Hauer SSP2
- Today (2025)
- 719,589 people
- By 2030
- 731,456 · +1.6%
- By 2040
- 746,689 · +3.8%
- By 2050
- 749,289 · +4.1%
- By 2075
- 736,227 · +2.3%
- By 2100
- 668,210 · -7.1%
Race, ethnicity, and origin ACS 2023
- Neighborhood character
- Predominantly Black (79%)
- Race & ethnicity
- Black 79% Hispanic / Latino 9% White 8% Two or more races 7%
- Hispanic origin (detail)
- Mexican 6%
- Common ancestry
- Swedish 1% Hispanic 1%
- Foreign-born
- 7% · Canada
- Languages at home
- 88% English-only · Spanish 7% French/Haitian/Cajun 2%
Political lean MEDSL · Jackson
- 2024 margin
- D (+19.3) · D 58.9% · R 39.5% · Other 1.6%
- 2008→2024 swing
- -6.1pp toward R · 2008: 25.4pp · 2024: 19.3pp
- All cycles
- 2024: D+19.3 2020: D+22.0 2016: D+16.6 2012: D+19.0 2008: D+25.4
Not yet ingested
- Civics
- —
Market trends
- HPI YoY
- ▲ 73.41%
- Current HPI
- 412.6862
- Rent YoY
- ▲ 4.65%
- Metro
- Kansas City, MO-KS
- State GDP YoY
- ▲ 1.84%
- F500 in state
- 20
Industry mix (Fortune 500 HQ in MO)
| Industry | F500 HQs | Revenue |
|---|---|---|
| Healthcare | 1 | $163B |
|
||
| Insurance | 1 | $21B |
|
||
| Industrial Technology | 1 | $17B |
|
||
| Retail | 1 | $16B |
|
||
| Industrial Distribution | 1 | $10B |
|
||
| Utilities | 1 | $9B |
|
||
Price history
-5.6% since first listed23 events — show timeline
- 2026-05-01 Price Changed $118,000 Heartland MLS as Distributed by MLS Grid
- 2026-04-14 Price Changed $125,000 Heartland MLS as Distributed by MLS Grid
- 2026-03-27 Price Changed $135,000 Heartland MLS as Distributed by MLS Grid
- 2026-03-27 Listed $13,500 Heartland MLS as Distributed by MLS Grid
- 2026-01-15 Listing Removed — Heartland MLS as Distributed by MLS Grid
- 2025-09-07 Listed $116,000 Heartland MLS as Distributed by MLS Grid
- 2025-09-05 Coming Soon — Heartland MLS as Distributed by MLS Grid
- 2025-07-04 Rental Removed $1,100 RenterWarehouse
- 2025-06-13 Listed for Rent $1,100 RenterWarehouse
- 2025-05-22 Listing Removed — Heartland MLS as Distributed by MLS Grid
- 2025-04-24 Price Changed $119,000 Heartland MLS as Distributed by MLS Grid
- 2025-04-12 Relisted — Heartland MLS as Distributed by MLS Grid
- 2025-03-29 Contingent — Heartland MLS as Distributed by MLS Grid
- 2025-03-05 Price Changed $125,000 Heartland MLS as Distributed by MLS Grid
- 2024-10-15 Price Changed $120,000 Heartland MLS as Distributed by MLS Grid
- 2024-10-07 Listed $128,000 Heartland MLS as Distributed by MLS Grid
- 2024-03-01 Sold (Public Records) — Public Records
- 2023-10-15 Listing Removed — Heartland MLS as Distributed by MLS Grid
- 2023-06-20 Relisted — Heartland MLS as Distributed by MLS Grid
- 2023-06-20 Pending — Heartland MLS as Distributed by MLS Grid
- 2023-06-11 Listed $125,000 Heartland MLS as Distributed by MLS Grid
- 2023-05-02 Sold (Public Records) — Public Records
- 2001-03-20 Sold (Public Records) — Public Records
Property tax history
+6.2%/yrLatest (2025): $590 · +31.8% YoY. Source: county tax records.
Cash-flow waterfall
monthlySold comps — $/sqft
last 12 mo · ≤1 miLoading sold comps…