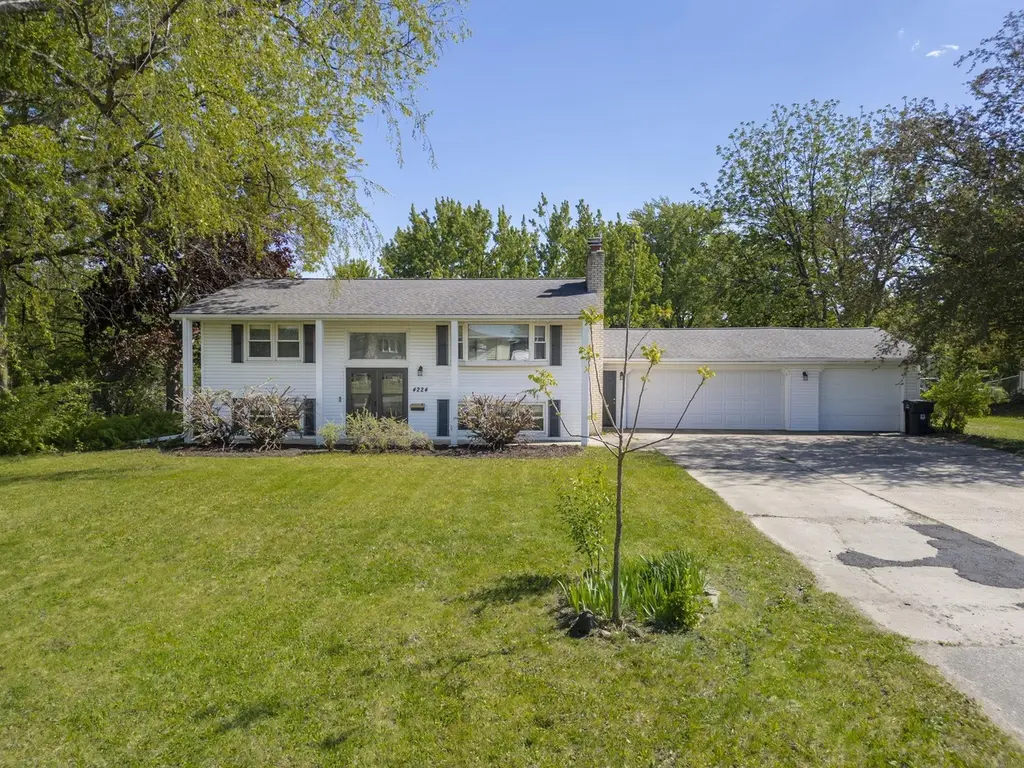
4224 Cherrywood Dr · Cedar Falls, IA
Flood risk 1/10 · Minimal
- FEMA flood zone
- X (unshaded)
- Chance of flooding over 30 yrs
- 0.0%
- Est. flood insurance / yr
- $473 – $860
Fire risk 2/10 · Minimal
- Est. fire insurance / yr
- $902 – $1,676
Heat risk 2/10 · Minimal
- Hot days now (above 101°F)
- 7 days/yr
- Hot days in 30 yrs
- 15 days/yr
Wind risk 2/10 · Minimal
- Chance of severe wind over 30 yrs
- —
Air-quality risk 1/10 · Minimal
- Unhealthy air days now
- 0 days/yr
- Unhealthy air days in 30 yrs
- 0 days/yr
Risk factors via First Street. Map © Google.
Why this score? — see what drove the D- grade
The composite is a weighted blend of 9 inputs, each scored 0–100. Each bar is that input's sub-score; the figure is the points it added to the 100-point composite (weight × sub-score).
- ARV discount +15.0/15.0
- Schools +6.6/10.0
- Cash flow +4.0/30.0
- Livability +4.0/5.0
- Rent growth +3.0/5.0
- Condition / age +2.5/5.0
- 1% rule +0.1/10.0
- DSCR +0.0/10.0
- Appreciation +0.0/10.0
$279,900
🖨 Deal sheet 📄 Offer letter ✓ Due diligence
Listing remarks
Spacious split foyer home located in a highly desired neighborhood with an attached 3 stall garage, .54 acre lot, with updated mechanicals, new deck, among the other updates. Large living room with lots of natural light with a bay window and there is also a wood fireplace to keep you cozy in the winter. Easy access to an eat-in kitchen with lots of counter space and cupboards. All appliances will remain with the property. Sliding glass door opens to the new spacious deck, perfect extension of the living space, that overlooks the large fenced-in back yard with play set, firepit, and shed. Two bedrooms on the main floor with double closets, and a full bathroom. Lots of storage throughout. Low
Key facts
- Split foyer home
- Attached garage
- Natural light
Tags
Property features AI
Exterior
- Parking: Attached garage; Carport with 3 spaces
- Security: Smoke detectors
- Utilities: Private well water; Public sewer
- Home design: Single-family residence; Residential property; Subdivision: CHERRYWOOD ACRES; Zoned R-1
- Construction: Vinyl siding; Below-grade finished area (basement) 833; Block foundation
- Exterior features: Deck; Sliding doors; Fenced yard; Asphalt roof; Concrete road access
Interior
- Kitchen: Dishwasher; Disposal; Free-standing range; Refrigerator; Vented exhaust fan
- Bathrooms: 1 full bathroom; 1 three-quarter bathroom
- Heating & cooling: Central air conditioning; Forced air heating; Natural gas heating; Exhaust fan
- Interior features: Eat-in kitchen; Finished basement with interior entry and sump pump; Storage space
- Laundry & utility: Washer hookup on lower level; Electric dryer hookup; Washer included; Gas water heater; Water softener (rented)
Neighborhood map
What this means for you Summary
Snapshot
- This is a 2-bed/2.0-bath single-family listed at $280k.
Deal economics
- At list price, monthly cash flow is $-785 ($-9k/yr) — negative.
- To cash-flow at today's rent, offer at most $141k (49.6% below list).
- To meet the 1% rule (rent ≥ 1% of price), the offer needs to be $142k (49.3% below list).
- Recommended offer: $141k (49.6% below list) — sets the bar for cash-flow.
Location & tenants
- Location reads 81/100 on livability (#60 in IA, #1,357 nationally) — a professional / high-income tenant draw. Strengths: cost of living A+, housing A+, health & safety A+; Watch: amenities D, commute F.
- Cedar Falls Community School District (urban): math 76% / reading 79% proficiency, ranked #45 of 289 in IA (top 16%) — strong family-tenant draw, lease renewals of 3-5y typical; only 18% free/reduced lunch — higher-income household profile.
- Zoned schools: Helen A Hansen Elementary School (math 84% / reading 87%, grade A+, #28 of 616 statewide, top 5%, 591 students, 16% FRL); Holmes Junior High School (math 79% / reading 78%, grade A+, #44 of 246 statewide, top 19%, 639 students, 28% FRL); Cedar Falls High School (math 74% / reading 78%, grade A-, #75 of 336 statewide, top 23%, 1,302 students, 24% FRL).
- Market conditions: Rents rising (+2.0%/yr); 387 active listings in the ZIP; solid renter incomes; 287 units permitted in Black Hawk County in 2024 (67 in 5+ unit buildings).
Forward outlook
- Local home prices are declining (-3.0%/yr); year-one equity from $2k of loan paydown is wiped out by about $8k of value loss. Plan a longer hold.
- Black Hawk County population projected at +10% by 2050 — modest demand growth; plan on rents tracking national, not racing it.
Negotiation context
- Only 13 days on market — expect competitive offers; lowballing is unlikely to land.
- Current owner paid $194k; 44% above their basis — modest negotiation headroom, anchor on the comps not their cost.
Questions for the listing agent
- What do current leases actually rent for vs. the listed asking? Can we see a recent rent roll and the last 12 months of T-12 income?
- Built in 1968 — when were the roof, HVAC, electrical panel, plumbing, and water heater last replaced?
- Is there a deadline driving the sale (1031 exchange, divorce, estate, relocation)? That informs how much negotiation room exists.
- Schools are A-rated — typically a magnet for longer-tenancy family renters. What's the average tenant stay here, and is there a school-zone premium baked into asking?
- The area grade is low — what's the realistic commute time and amenity access for the typical tenant pool here? Any planned neighborhood developments (good or bad) we should know about?
- What's the average days-on-market for RENTAL listings here right now (not sales)? A rising rental-DOM trend means longer vacancies and softer asking-rent achievability than the comps imply.
- What's the recent tenant-quality profile in this submarket — average credit score on applications, eviction rate, late-payment / NSF rate, and stable-employment percentage? A property-management company in the area should have these aggregated.
- How much new for-sale + rental construction is in the pipeline within 1–3 miles? Heavy new supply typically softens prices + rents 12–24 months out; constrained supply supports both.
Investment metrics
- 1% rule
- 0.51% ✗
- Cap rate
- 2.93%
- Cash-on-cash
- -12.02%
- DSCR
- 0.47
- GRM
- 16.4
CMA / ARV
- ARV (median comp)
- $451,028
- List price
- $279,900
- Delta
- -37.94%
- Verdict
- UNDERPRICED
- Comps
- 20 within 1.0 mi
Show comp detail 12 sales within ~0.75 mi
| Address | Dist | Beds/Ba | Sqft | Sold | Price | $/sf | Match |
|---|---|---|---|---|---|---|---|
| 4602 Sonoma Dr | 0.49mi | 3/2.0 (+1) | 1,550 (+2%) | 2mo | $467,233 | $301 | 68 |
| 4718 Wild Horse Dr | 0.51mi | 3/2.0 (+1) | 1,584 (+4%) | 8mo | $455,500 | $288 | 58 |
| 4710 Wild Horse Dr | 0.50mi | 3/2.0 (+1) | 1,669 (+9%) | 1mo | $549,515 | $329 | 55 |
| 4519 Sonoma Dr | 0.45mi | 3/2.0 (+1) | 1,564 (+2%) | 18mo | $444,500 | $284 | 55 |
| 4525 Sonoma Dr | 0.46mi | 2/2.0 | 1,408 (-8%) | 13mo | $424,900 | $302 | 55 |
| 3906 Keagles Xing | 0.48mi | 1/2.0 (-1) | 1,376 (-10%) | 3mo | $330,000 | $240 | 54 |
| 4004 Broomfield Dr | 0.65mi | 3/2.0 (+1) | 1,527 (+0%) | 17mo | $398,747 | $261 | 51 |
| 1821 Laramie St | 0.67mi | 3/2.0 (+1) | 1,654 (+8%) | 4mo | $480,000 | $290 | 46 |
| 4007 Wild Horse Dr | 0.67mi | 3/2.0 (+1) | 1,367 (-10%) | 1mo | $398,037 | $291 | 46 |
| 4532 Granite Ridge Rd | 0.54mi | 3/2.0 (+1) | 1,716 (+12%) | 8mo | $503,000 | $293 | 43 |
| 4324 Blair Ridge Rd | 0.50mi | 3/2.5 (+1) | 1,681 (+10%) | 18mo | $517,167 | $308 | 38 |
| 1820 Laramie St | 0.68mi | 3/2.0 (+1) | 1,636 (+7%) | 18mo | $450,000 | $275 | 36 |
Match score weights: distance 35% · size 25% · config 20% · recency 20%. Top-matched comps best support the ARV.
Projected returns pro-forma
-3.0% appreciation · 1.97% rent growth · sell at horizon
- IRR
- -39.5%
- Equity multiple
- -0.24×
- Total profit
- $-96,811
- Equity at exit
- $41,734
- IRR
- -69.5%
- Equity multiple
- -0.97×
- Total profit
- $-154,524
- Equity at exit
- $24,201
Cash invested: $78,372 (down + closing). Projections, not guarantees.
Landlord ↔ Tenant lean methodology
- Overall (STATE)
- 83 Strongly Landlord-Friendly
- State Iowa
- 83 Strongly Landlord-Friendly · R+6
- County
- — inherits STATE
- City
- — inherits STATE
ZIP-level market 50613
- Rents YoY
- 2.0%
- Active inventory
- 387
- Price-to-rent
- 16.4×
Monthly cashflow live
- Estimated rent
- $1,419 medium interval (Pro) →
- Mortgage (P&I)
- −$1,468
- Tax from tax record
- −$322 /mo · $3,860/yr
- Insurance
- −$117
- HOA
- −$0
- Vacancy / Maint / Mgmt
- −$298
- Net cashflow
- $-785
Break-even live
UW: 25.0% down · 7.5% · 30yr · 1.5% tax · 5.0% vac · 8.0% maint · 8.0% mgmt
Financing live
Cash to close
- Down payment
- $69,975
- Closing costs
- $8,397
- Reserves months
- —
- Total cash needed
- —
Loan-product check · same deal, 3 products live
Conventional
25% down · 7.5% · 30yr
- Down + closing
- —
- Monthly P&I
- —
- Monthly cashflow
- —
- DSCR
- —
- Eligible?
- —
Personal DTI + credit; lowest rate.
DSCR
20% down · 8.5% · 30yr
- Down + closing
- —
- Monthly P&I
- —
- Monthly cashflow
- —
- DSCR
- —
- Eligible?
- —
No personal income docs; deal must DSCR.
Hard money
10% down · 12.0% · 12mo
- Down + closing
- —
- Monthly P&I
- —
- Monthly cashflow
- —
- DSCR
- —
- Eligible?
- —
Short-term bridge; refi at stabilization.
Listing history 2 events
-
2026-05-14$289,900 Active 1035-char remark
-
2013-10-08soldstatus $194,000
ⓘ Source: listings_history table (triggers on properties + properties_extension) + one-shot
backfill from property_details.listing_events for pre-trigger history.
Tax reassessment forecast IA · Partial reset (capped growth)
- Current annual tax
- $3,860 · $322/mo
- Projected year-2 tax
- $4,127 · $344/mo
- Expected delta
- +$267/yr (+$22/mo · 6.9%)
ⓘ Screening estimate from a state-policy table — verify with the county assessor before closing.
Climate risk First Street
- Flood 1/10 Low FEMA zone X (unshaded) · 0% chance over 30 yrs
- Wildfire 2/10 Low
- Heat 2/10 Low 7 d/yr ≥101°F today · 15 d/yr by 30 yrs out
- Wind 2/10 Low
- Air quality 1/10 Low 0 unhealthy d/yr today · 0 by 30 yrs out
Nearby sold comps map
Loading sold comps map…
Walkable amenities ~0.75 mi
Loading nearby amenities…
Taxation est. · year 1
- Rental income
- $17,028
- − Mortgage interest
- −$15,679
- − Property taxes
- −$3,860
- − Insurance
- −$1,400
- − Repairs & maintenance
- −$1,362
- − Management
- −$1,362
- − Depreciation
- −$8,143
- Taxable loss
- −$14,777
- Est. tax savings @ 24.0%
- +$3,547
- After-tax cash flow
- $-5,875/yr
For passive investors: Depreciation is non-cash, so a rental often shows a tax loss while cash-flowing — sheltering income. Rental losses are passive: they offset passive income freely, and up to $25,000/yr can offset ordinary (W-2) income if you actively participate and your MAGI is under $100k (phasing out to $0 by $150k); unused losses carry forward. On sale, claimed depreciation is recaptured at up to 25%, and gains may owe capital-gains tax (a 1031 exchange can defer both). Figures are a year-1 estimate at your 24.0% rate — not tax advice; consult a CPA.
Schools (NCES district)
- District
- Cedar Falls Community School District
- NCES district ID
- 1906510
- Math proficiency
- 76% ▼ -6.00%
- Reading proficiency
- 79% ▼ -2.00%
- Median HH income
- $53,634
- Composite
- 65.93/100
- National rank
- #443
- State rank
- #45 of 289 in IA
Livability — Cedar Falls
- Score
- 81/100
- State rank
- #60
- US rank
- #1357
Category grades
Schools grade is shown separately in the Schools card above.
Census & demographics
- Census place
- Cedar Falls, IA
- County
- Black Hawk County · 112,933 people
- City population
- 43,867
- Metro
- Waterloo-Cedar Falls, IA
- Population (ZIP)
- 43,867
- Household income
- $78,503
- Rent vs Own
- Severe rent burden
- 1514.0
Population outlook (Black Hawk County) Hauer SSP2
- Today (2025)
- 139,716 people
- By 2030
- 142,853 · +2.2%
- By 2040
- 147,843 · +5.8%
- By 2050
- 153,247 · +9.7%
- By 2075
- 167,977 · +20.2%
- By 2100
- 177,320 · +26.9%
Race, ethnicity, and origin ACS 2023
- Neighborhood character
- Predominantly White (90%)
- Race & ethnicity
- White 90% Asian 3% Two or more races 3% Hispanic / Latino 3% Black 1%
- Common ancestry
- Portuguese 6% Italian 3% Iranian 3%
- Foreign-born
- 4% · Canada, South Korea
- Languages at home
- 95% English-only · Spanish 2% Russian/Polish/Slavic 1% Other Indo-European 1%
Political lean MEDSL · Black Hawk
- 2024 margin
- Toss-up / Even · D 50.0% · R 48.8% · Other 1.2%
- 2008→2024 swing
- -21.3pp toward R · 2008: 22.4pp · 2024: 1.2pp
- All cycles
- 2024: D+1.2 2020: D+9.0 2016: D+7.3 2012: D+20.0 2008: D+22.4
Not yet ingested
- Civics
- —
Market trends
- HPI YoY
- ▼ -175.51%
- Current HPI
- 169.0591
- Rent YoY
- ▲ 1.97%
- Metro
- Waterloo-Cedar Falls, IA
- State GDP YoY
- ▲ 2.48%
- F500 in state
- 4
Industry mix (Fortune 500 HQ in IA)
| Industry | F500 HQs | Revenue |
|---|---|---|
| Financial Services | 1 | $16B |
|
||
| Retail / Convenience | 1 | $15B |
|
||
Price history
+44.3% since first listed4 events — show timeline
- 2026-05-27 Pending — NEIRBR as distributed by MLS GRID
- 2026-05-21 Price Changed $279,900 NEIRBR as distributed by MLS GRID
- 2026-05-14 Listed $289,900 NEIRBR as distributed by MLS GRID
- 2013-10-08 Sold (Public Records) $194,000 Public Records
Property tax history
+2.2%/yrLatest (2025): $3,860 · +3.0% YoY. Source: county tax records.
Cash-flow waterfall
monthlySold comps — $/sqft
last 12 mo · ≤1 miLoading sold comps…