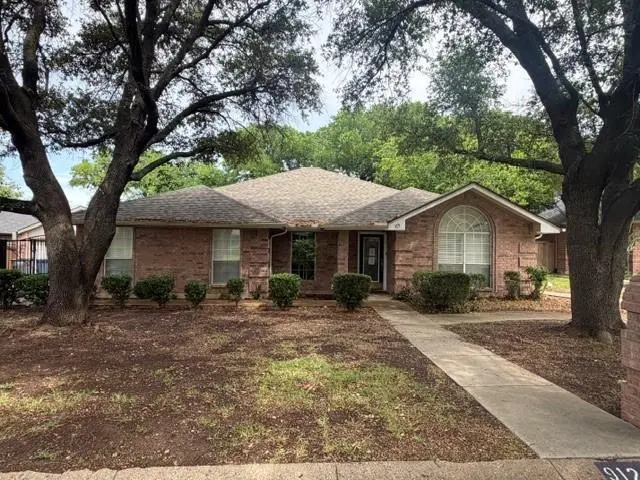
9124 Timber Oaks Dr · Fort Worth, TX
Flood risk 3/10 · Minor
- FEMA flood zone
- X (shaded)
- Chance of flooding over 30 yrs
- 0.1%
- Est. flood insurance / yr
- $507 – $1,088
Fire risk 4/10 · Minor
- Est. fire insurance / yr
- $1,222 – $2,270
Heat risk 7/10 · Major
- Hot days now (above 109°F)
- 7 days/yr
- Hot days in 30 yrs
- 22 days/yr
Wind risk 4/10 · Minor
- Chance of severe wind over 30 yrs
- 24.0%
Air-quality risk 2/10 · Minimal
- Unhealthy air days now
- 1 days/yr
- Unhealthy air days in 30 yrs
- 2 days/yr
Risk factors via First Street. Map © Google.
Why this score? — see what drove the C+ grade
The composite is a weighted blend of 9 inputs, each scored 0–100. Each bar is that input's sub-score; the figure is the points it added to the 100-point composite (weight × sub-score).
- Cash flow +19.4/30.0
- ARV discount +15.0/15.0
- 1% rule +7.6/10.0
- DSCR +6.1/10.0
- Livability +4.0/5.0
- Schools +3.5/10.0
- Rent growth +2.9/5.0
- Condition / age +2.5/5.0
- Appreciation +0.0/10.0
$320,000
🖨 Deal sheet 📄 Offer letter ✓ Due diligence
Listing remarks
Single-story brick home with 2 fireplaces is located in the peaceful and sought-after Secret Harbor community with so much potential, just bring your personal touches and update to make your own. This property has 3 large living areas 3 bedrooms 2 full baths and a 4th bedroom was converted into a large closet and could be converted back into a 4th bedroom. It has a large kitchen with an island, a large detached 2 car garage. Park of Timber Oaks backs up to Eagle Mountain Lake. It sits on a good size lot and is located close to just about everything! It would make a great retirement home or rental property just bring your imagination. The seller does not accept blind offers or escalation cla
Key facts
- Large living areas
- Good size lot
- 0.29 acre lot
Tags
Property features AI
Finance
- Other: Subdivision: Lake Country Secret Harbour; County: Tarrant
- Financial info: Listing is Real Estate Owned; Acceptable financing: Cash or Conventional
- HOA & community: Voluntary association (LCPOA); Annual association fee of $100
Exterior
- Parking: 2 covered parking spaces; Driveway; 2-car garage (approx. 24' x 24')
- Utilities: City water; City sewer; Cable available; All-weather road
- Home design: Single-family residence; Residential property; One story; Preowned (built in 1994); Not attached
- Construction: Brick construction; Asphalt roof; Slab foundation; Year built 1994
- Exterior features: Covered and enclosed front porch; Covered porches; Gutters; Wood and wrought iron fencing; Landscaped yard with many trees; Interior lot in a subdivision
Interior
- Kitchen: Granite countertops; Kitchen island; Pantry; Water line to refrigerator; Dishwasher; Disposal; Electric range; Microwave; Natural stone/granite surfaces
- Bedrooms: 3 bedrooms; Primary bedroom on main level with ensuite bath, garden tub, separate shower and walk-in closet; Secondary bedrooms on main level with split-bedroom layout and walk-in closets
- Flooring: Carpet; Ceramic tile; Wood flooring
- Bathrooms: 2 full bathrooms; Primary bathroom with garden tub, separate shower, separate vanities and built-in cabinets
- Heating & cooling: Central heating (electric); Central air conditioning; Ceiling fans
- Interior features: Cable TV available; High-speed internet available; Granite counters; Kitchen island; Vaulted ceilings; Walk-in closets; 12 total rooms; 4 living areas; 1 dining area; One-level layout
- Laundry & utility: Utility room / separate full-size W/D area; Washer hookup; Electric dryer hookup
Neighborhood map
What this means for you Summary
Snapshot
- This is a 4-bed/2.0-bath single-family listed at $320k.
Deal economics
- At list price, monthly cash flow is $357 ($4k/yr) — positive.
- The deal already cash-flows at list — no discount required.
- Meets the 1% rule at list price ($4k rent vs $320k).
- Recommended offer: $310k (3.0% below list) — sets the bar for market timing.
- Cap rate 7.6% vs local median 3.9% in Fort Worth — top-decile yield for the area; either an underpriced asset or a hidden risk that comps aren't pricing in. Stress-test before assuming the spread holds.
Location & tenants
- Location reads 80/100 on livability (#49 in TX, #1,954 nationally) — a professional / high-income tenant draw. Strengths: amenities A+, cost of living A+, housing A+; Watch: crime F.
- Eagle Mt-Saginaw ISD (urban): math 35% / reading 42% proficiency, ranked #361 of 826 in TX (top 44%) — families likely to look elsewhere, expect single-tenant / working-renter base with shorter leases.
- Zoned schools: Eagle Mountain El (math 40% / reading 42%, grade F, #1,462 of 4,322 statewide, top 34%, 507 students, 19% FRL) — zoned schools average 19% FRL vs 36% district-wide (16 pts lower); this property's tenant base skews higher-income than the district average.
- Market conditions: Rents rising (+1.5%/yr); 1050 active listings in the ZIP; 3 comparable units currently listed for rent nearby; rentals leasing fast (median 1d on market — plan ~1-2 weeks tenant-placement turnaround); solid renter incomes; 18,938 units permitted in Tarrant County in 2024 (8,336 in 5+ unit buildings).
- At $4,048/mo this rent would consume 45% of the median local household income ($107k/yr) (locally 1494% of renters already pay >50% of income on rent) — very limited rent-growth headroom before tenants either downsize or default.
Forward outlook
- Local home prices are declining (-3.0%/yr); year-one equity from $2k of loan paydown is wiped out by about $10k of value loss. Plan a longer hold.
- Tarrant County population projected at +41% by 2050 — long-run rental-demand tailwind backs the buy-and-hold thesis.
Negotiation context
- It's been on market 44 days — a 3% lower offer ($310k) is reasonable based on typical stale-listing flexibility.
Risks & watch-outs
- Watch-outs: property tax is 3.8% of price.
- Climate carrying-cost: extreme-heat days projected 7→22/yr by 2055 (HVAC capex compounding) — expect insurance premiums to compound above CPI over the hold.
Questions for the listing agent
- It's been on market 44 days. Have you received any prior offers? Is the seller open to a 3% concession, seller financing, or rate buy-down credit?
- Property tax is high relative to price — has the assessment been appealed recently, and will the sale trigger a re-assessment?
- What does the HOA fee cover, when was the last increase, and are there any pending special assessments or reserve-fund shortfalls?
- Is there a deadline driving the sale (1031 exchange, divorce, estate, relocation)? That informs how much negotiation room exists.
- Schools are D-rated, which usually means shorter tenancies and higher turnover. Who's the typical renter profile here, and what's been the actual vacancy rate?
- Crime grade is F in this area — have there been break-ins, vandalism, or insurance claims at this property in the last 3 years? What carrier currently insures it and at what premium?
- What's the average days-on-market for RENTAL listings here right now (not sales)? A rising rental-DOM trend means longer vacancies and softer asking-rent achievability than the comps imply.
- What's the recent tenant-quality profile in this submarket — average credit score on applications, eviction rate, late-payment / NSF rate, and stable-employment percentage? A property-management company in the area should have these aggregated.
- How much new for-sale + rental construction is in the pipeline within 1–3 miles? Heavy new supply typically softens prices + rents 12–24 months out; constrained supply supports both.
Investment metrics
- 1% rule
- 1.26% ✓
- Cap rate
- 7.63%
- Cash-on-cash
- 4.78%
- DSCR
- 1.21
- GRM
- 6.6
CMA / ARV
- ARV (on-the-fly)
- $526,176
- Comps found
- 12
Show comp detail 12 sales within ~0.75 mi
| Address | Dist | Beds/Ba | Sqft | Sold | Price | $/sf | Match |
|---|---|---|---|---|---|---|---|
| 8 Buccaneer Ct | 0.34mi | 4/3.0 | 3,071 (+2%) | 1mo | $700,000 | $228 | 77 |
| 9325 Harbour View Ln | 0.31mi | 4/2.5 | 3,039 (+0%) | 8mo | $675,000 | $222 | 76 |
| 9112 Westwood Shores Dr | 0.06mi | 3/2.5 (-1) | 2,788 (-8%) | 4mo | $355,000 | $127 | 74 |
| 7801 Timberwood Ct | 0.45mi | 4/3.0 | 3,103 (+3%) | 4mo | $469,000 | $151 | 67 |
| 9327 Dosier Cv E | 0.40mi | 4/3.5 | 3,117 (+3%) | 7mo | $574,900 | $184 | 64 |
| 7450 Balsam Wood Ct | 0.73mi | 5/3.5 (+1) | 3,039 (+0%) | 0mo | $525,000 | $173 | 54 |
| 7800 Regatta Ct | 0.54mi | 4/3.0 | 3,291 (+9%) | 4mo | $410,000 | $125 | 52 |
| 8804 Crosswind Dr | 0.69mi | 4/3.0 | 3,213 (+6%) | 9mo | $479,000 | $149 | 46 |
| 7725 Westwind Dr | 0.66mi | 4/4.0 | 3,194 (+6%) | 9mo | $420,000 | $131 | 44 |
| 8877 Random Rd | 0.66mi | 5/3.0 (+1) | 3,388 (+12%) | 1mo | $1,285,000 | $379 | 39 |
| 9933 Villa Verde Dr | 0.75mi | 5/4.0 (+1) | 3,335 (+10%) | 2mo | $689,772 | $207 | 33 |
| 9857 La Frontera Dr | 0.71mi | 4/3.0 | 3,417 (+13%) | 10mo | $595,000 | $174 | 33 |
Match score weights: distance 35% · size 25% · config 20% · recency 20%. Top-matched comps best support the ARV.
Projected returns pro-forma
-3.0% appreciation · 1.51% rent growth · sell at horizon
- IRR
- -10.8%
- Equity multiple
- 0.61×
- Total profit
- $-34,663
- Equity at exit
- $47,713
- IRR
- -4.2%
- Equity multiple
- 0.74×
- Total profit
- $-22,918
- Equity at exit
- $27,668
Cash invested: $89,600 (down + closing). Projections, not guarantees.
Landlord ↔ Tenant lean methodology
- Overall (STATE)
- 87 Strongly Landlord-Friendly
- State Texas
- 87 Strongly Landlord-Friendly · R+5
- County
- — inherits STATE
- City
- — inherits STATE
ZIP-level market 76179
- Rents YoY
- 1.5%
- Active inventory
- 1050
- Price-to-rent
- 6.6×
Monthly cashflow live
- Estimated rent
- $4,048 medium interval (Pro) →
- Mortgage (P&I)
- −$1,678
- Tax from tax record
- −$1,021 /mo · $12,258/yr
- Insurance
- −$133
- HOA
- −$8
- Vacancy / Maint / Mgmt
- −$850
- Net cashflow
- $357
Break-even live
UW: 25.0% down · 7.5% · 30yr · 1.5% tax · 5.0% vac · 8.0% maint · 8.0% mgmt
Financing live
Cash to close
- Down payment
- $80,000
- Closing costs
- $9,600
- Reserves months
- —
- Total cash needed
- —
Loan-product check · same deal, 3 products live
Conventional
25% down · 7.5% · 30yr
- Down + closing
- —
- Monthly P&I
- —
- Monthly cashflow
- —
- DSCR
- —
- Eligible?
- —
Personal DTI + credit; lowest rate.
DSCR
20% down · 8.5% · 30yr
- Down + closing
- —
- Monthly P&I
- —
- Monthly cashflow
- —
- DSCR
- —
- Eligible?
- —
No personal income docs; deal must DSCR.
Hard money
10% down · 12.0% · 12mo
- Down + closing
- —
- Monthly P&I
- —
- Monthly cashflow
- —
- DSCR
- —
- Eligible?
- —
Short-term bridge; refi at stabilization.
Rent comps 3 comps
| Address | Beds | Baths | Sqft | Rent | $/sqft | DOM | Units | Dist |
|---|---|---|---|---|---|---|---|---|
| 9832 El Colina Dr Fort Worth, TX | 3.0 | 2.5 | 3244 | $4,495 | $1.39 | 1d | 1 | 0.58mi |
| 4146 Shore Front Dr Fort Worth, TX | 4.0 | 3.0 | 2397 | $4,950 | $2.07 | 1d | 1 | 1.35mi |
| 7129 Aves St Fort Worth, TX | 3.0 | 2.5 | 3050 | $4,000 | $1.31 | 1d | 1 | 1.46mi |
HOA detail
- Monthly dues
- $8 · $96/yr
Listing history 18 events
-
2026-06-18days on market $320,000 Active 44 DOM
-
2026-06-17days on market $320,000 Active 43 DOM
-
2026-06-16days on market $320,000 Active 42 DOM
-
2026-06-15days on market $320,000 Active 41 DOM
-
2026-06-13days on market $320,000 Active 39 DOM
-
2026-06-13days on market $320,000 Active 38 DOM
-
2026-06-09days on market $320,000 Active 35 DOM
-
2026-06-08days on market $320,000 Active 34 DOM
-
2026-06-07days on market $320,000 Active 33 DOM
-
2026-06-04days on market $320,000 Active 30 DOM
-
2026-06-03days on market $320,000 Active 29 DOM
-
2026-06-02days on market $320,000 Active 28 DOM
-
2026-06-01days on market $320,000 Active 27 DOM
-
2026-05-31days on market $320,000 Active 26 DOM
-
2026-05-05$345,000 Active
-
2004-03-01soldstatus
-
1998-03-09soldstatus
-
1996-01-25soldstatus
ⓘ Source: listings_history table (triggers on properties + properties_extension) + one-shot
backfill from property_details.listing_events for pre-trigger history.
Tax reassessment forecast TX · Resets to sale price
- Current annual tax
- $12,258 · $1,021/mo
- Projected year-2 tax
- $12,258 · $1,021/mo
- Expected delta
- $0/yr ($0/mo · 0.0%)
ⓘ Screening estimate from a state-policy table — verify with the county assessor before closing.
Climate risk First Street
- Flood 3/10 Moderate FEMA zone X (shaded) · 10% chance over 30 yrs
- Wildfire 4/10 Moderate
- Heat 7/10 Severe 7 d/yr ≥109°F today · 22 d/yr by 30 yrs out
- Wind 4/10 Moderate 24% chance of damaging wind over 30 yrs
- Air quality 2/10 Low 1 unhealthy d/yr today · 2 by 30 yrs out
Nearby sold comps map
Loading sold comps map…
Walkable amenities ~0.75 mi
Loading nearby amenities…
Taxation est. · year 1
- Rental income
- $48,573
- − Mortgage interest
- −$17,925
- − Property taxes
- −$12,258
- − Insurance
- −$1,600
- − Repairs & maintenance
- −$3,886
- − Management
- −$3,886
- − HOA
- −$96
- − Depreciation
- −$9,309
- Taxable loss
- −$387
- Est. tax savings @ 24.0%
- +$93
- After-tax cash flow
- $4,374/yr
For passive investors: Depreciation is non-cash, so a rental often shows a tax loss while cash-flowing — sheltering income. Rental losses are passive: they offset passive income freely, and up to $25,000/yr can offset ordinary (W-2) income if you actively participate and your MAGI is under $100k (phasing out to $0 by $150k); unused losses carry forward. On sale, claimed depreciation is recaptured at up to 25%, and gains may owe capital-gains tax (a 1031 exchange can defer both). Figures are a year-1 estimate at your 24.0% rate — not tax advice; consult a CPA.
Schools (NCES district)
- District
- Eagle Mt-Saginaw ISD
- NCES district ID
- 4817700
- Math proficiency
- 35% ▼ -16.00%
- Reading proficiency
- 42% ▼ -9.00%
- Median HH income
- $72,781
- Composite
- 35.41/100
- National rank
- #4945
- State rank
- #361 of 826 in TX
Livability — Fort Worth
- Score
- 80/100
- State rank
- #49
- US rank
- #1954
Category grades
Schools grade is shown separately in the Schools card above.
Census & demographics
- Census place
- Fort Worth, TX
- County
- Tarrant County · 2,033,669 people
- City population
- 911,619
- Metro
- Dallas-Fort Worth-Arlington, TX
- Population (ZIP)
- 80,090
- Household income
- $107,428
- Rent vs Own
- Severe rent burden
- 1494.0
Population outlook (Tarrant County) Hauer SSP2
- Today (2025)
- 2,380,417 people
- By 2030
- 2,578,900 · +8.3%
- By 2040
- 2,974,995 · +25.0%
- By 2050
- 3,350,489 · +40.8%
- By 2075
- 4,216,909 · +77.2%
- By 2100
- 4,741,527 · +99.2%
Race, ethnicity, and origin ACS 2023
- Neighborhood character
- Diverse neighborhood (Simpson 0.63)
- Race & ethnicity
- White 53% Hispanic / Latino 28% Two or more races 14% Black 12% Asian 4%
- Hispanic origin (detail)
- Mexican 22% Puerto Rican 2%
- Common ancestry
- Slovak 2% Lithuanian 2% Italian 1%
- Foreign-born
- 8% · Canada, Jamaica
- Languages at home
- 81% English-only · Spanish 15% Other Asian/Pacific 2% Other Indo-European 1%
Political lean MEDSL · Tarrant
- 2024 margin
- Lean R (+5.1) · D 46.7% · R 51.9% · Other 1.4%
- 2008→2024 swing
- +6.6pp toward D · 2008: -11.7pp · 2024: -5.1pp
- All cycles
- 2024: R+5.1 2020: D+0.2 2016: R+8.7 2012: R+15.7 2008: R+11.7
Not yet ingested
- Civics
- —
Market trends
- HPI YoY
- ▼ -137.12%
- Current HPI
- 237.6676
- Rent YoY
- ▲ 1.51%
- Metro
- Dallas-Fort Worth-Arlington, TX
- State GDP YoY
- ▲ 3.95%
- F500 in state
- 110
Industry mix (Fortune 500 HQ in TX)
| Industry | F500 HQs | Revenue |
|---|---|---|
| Energy | 16 | $1,198B |
|
||
| Technology | 5 | $198B |
|
||
| Engineering / Construction | 4 | $72B |
|
||
| Energy Services | 3 | $60B |
|
||
| Utilities | 3 | $41B |
|
||
| Healthcare | 2 | $330B |
|
||
Price history
4 events — show timeline
- 2026-05-05 Listed $345,000 NTREIS
- 2004-03-01 Sold (Public Records) — Public Records
- 1998-03-09 Sold (Public Records) — Public Records
- 1996-01-25 Sold (Public Records) — Public Records
Property tax history
+5.1%/yrLatest (2025): $12,258 · +9.0% YoY. Source: county tax records.
Cash-flow waterfall
monthlySold comps — $/sqft
last 12 mo · ≤1 miLoading sold comps…