 Duplex
1656-1658 Forest St · Columbus, OH
Flood risk 1/10 · Minimal
- FEMA flood zone
- X (unshaded)
- Chance of flooding over 30 yrs
- 0.0%
- Est. flood insurance / yr
- $473 – $860
Fire risk 1/10 · Minimal
- Est. fire insurance / yr
- $713 – $1,323
Heat risk 4/10 · Minor
- Hot days now (above 100°F)
- 7 days/yr
- Hot days in 30 yrs
- 18 days/yr
Wind risk 2/10 · Minimal
- Chance of severe wind over 30 yrs
- 1.0%
Air-quality risk 3/10 · Minor
- Unhealthy air days now
- 2 days/yr
- Unhealthy air days in 30 yrs
- 3 days/yr
Risk factors via First Street. Map © Google.
Why this score? — see what drove the C grade
The composite is a weighted blend of 9 inputs, each scored 0–100. Each bar is that input's sub-score; the figure is the points it added to the 100-point composite (weight × sub-score).
- Cash flow +22.8/30.0
- ARV discount +11.4/15.0
- DSCR +7.3/10.0
- 1% rule +5.3/10.0
- Livability +4.0/5.0
- Rent growth +3.4/5.0
- Condition / age +2.5/5.0
- Schools +1.7/10.0
- Appreciation +0.0/10.0
$245,000
🖨 Deal sheet (PDF) 📄 Offer letter ✓ Due diligence
Multi-family units
County records classify this as Multi-Family (2-4 Unit). Listing-text estimate: 2 units. confirmed
Listing remarks MLS
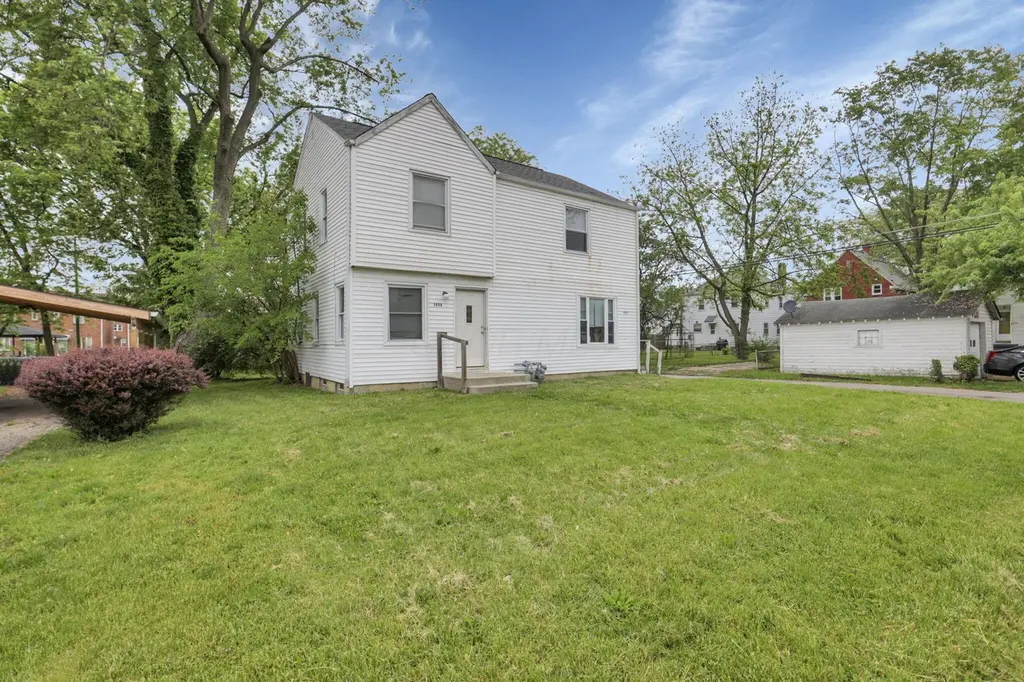
This fully occupied duplex is situated in a great location near Downtown Columbus, Nationwide Children's Hospital, and more! The property has been well maintained with recent updates including brand new windows in 2024, new hot water tanks in both units in 2023, and many other updates. The hole in the kitchen ceiling is from a previous leak that has been remedied. The ceiling is being patched and painted. Each unit consists of 2 bedrooms/1 bathroom, a full separate basement, and plenty of yard space. Both units are occupied, with unit 1656 rented at $980/month until 7/31/2026, while unit 1658 is rented at $1,025/month on a month-to-month lease. Tenants pay for all utilities. This property is professionally managed, and who's willing to stay in place. The inspection report is available upon request.
Key facts
- Plenty of yard space
- Recent updates
- New hot water tanks
Tags
Neighborhood map
What this means for you Summary
Snapshot
- This is a 2 × 2-bed/1-bath units multifamily listed at $245k.
Deal economics
- At list price, monthly cash flow is $424 ($5k/yr) — positive. Per door: $212/mo.
- The deal already cash-flows at list — no discount required.
- Meets the 1% rule at list price ($3k rent vs $245k).
- Recommended offer: $216k (12.0% below list) — sets the bar for market timing.
- Cap rate 8.4% vs local median 3.8% in Columbus — top-decile yield for the area; either an underpriced asset or a hidden risk that comps aren't pricing in. Stress-test before assuming the spread holds.
Location & tenants
- Location reads 81/100 on livability (#97 in OH, #1,491 nationally) — a professional / high-income tenant draw. Strengths: commute A+, cost of living A+, housing A+; Watch: employment C-, crime F.
- Columbus City School District (urban): math 15% / reading 26% proficiency, ranked #626 of 656 in OH (top 95%) — low school quality limits family demand, transient renter base, plan for 1-2y turnover; 72% free/reduced lunch — lower-income household profile, screen leases tightly.
- Market conditions: Rents rising (+3.5%/yr); 193 active listings in the ZIP; 40 comparable units currently listed for rent nearby; rentals at typical pace (median 22d on market — plan ~3-4 weeks tenant-placement turnaround); 40% of comp listings sitting > 30 days — soft ceiling on asking rent; solid renter incomes; 8,139 units permitted in Franklin County in 2024 (5,940 in 5+ unit buildings).
- This rent runs 40% of the median local income ($76k/yr) — at the standard rent-burdened threshold; future hikes will face affordability resistance.
Forward outlook
- Local home prices are declining (-3.0%/yr); year-one equity from $2k of loan paydown is wiped out by about $7k of value loss. Plan a longer hold.
- Franklin County population projected at +34% by 2050 — long-run rental-demand tailwind backs the buy-and-hold thesis.
Negotiation context
- It's been on market 225 days — a 12% lower offer ($216k) is reasonable based on typical stale-listing flexibility.
- 5 sale attempts since 23y ago with the ask held roughly flat each time — persistent listings suggest the price (not the market) is what's stuck; bring a comps-based counter.
- Current owner paid $210k; 17% above their basis — modest negotiation headroom, anchor on the comps not their cost.
Risks & watch-outs
- Watch-outs: built in 1941 — expect roof / HVAC / electrical / plumbing capex.
Questions for the listing agent
- It's been on market 225 days. Have you received any prior offers? Is the seller open to a 12% concession, seller financing, or rate buy-down credit?
- Can we see the unit-by-unit rent roll, current vacancy, and any below-market leases? What's the average tenancy length?
- What capital expenditures (roof, boiler, parking lot, exteriors) have been made in the last 5 years, and what's planned in the next 2?
- Built in 1941 — when were the roof, HVAC, electrical panel, plumbing, and water heater last replaced?
- Why hasn't it sold? Are there any deal-killer items the seller is aware of (foundation, flood, title, zoning, code violations)?
- Is there a deadline driving the sale (1031 exchange, divorce, estate, relocation)? That informs how much negotiation room exists.
- Crime grade is F in this area — have there been break-ins, vandalism, or insurance claims at this property in the last 3 years? What carrier currently insures it and at what premium?
- What's the average days-on-market for RENTAL listings here right now (not sales)? A rising rental-DOM trend means longer vacancies and softer asking-rent achievability than the comps imply.
- What's the recent tenant-quality profile in this submarket — average credit score on applications, eviction rate, late-payment / NSF rate, and stable-employment percentage? A property-management company in the area should have these aggregated.
- How much new apartment / multifamily construction is in the pipeline within 1–3 miles? Heavy new supply (>2% of stock underway) typically softens rents 12–24 months out; light construction supports rent growth.
Investment metrics
- 1% rule
- 1.03% ✓
- Cap rate
- 8.37%
- Cash-on-cash
- 7.42%
- DSCR
- 1.33
- GRM
- 8.1
CMA / ARV
- ARV (median comp)
- $268,317
- List price
- $245,000
- Delta
- -8.69%
- Verdict
- FAIR
- Comps
- 20 within 1.0 mi
Show comp detail 9 sales within ~0.75 mi
| Address | Dist | Beds/Ba | Sqft | Sold | Price | $/sf | Match |
|---|---|---|---|---|---|---|---|
| 1732-1734 E Whittier St | 0.28mi | 4/— | 1,568 (-3%) | 1mo | $195,000 | $124 | 82 |
| 1701 E Whittier St #1703 | 0.28mi | 4/— | 1,624 (+1%) | 9mo | $245,000 | $151 | 78 |
| 1723-1725 E Whittier St | 0.29mi | 4/— | 1,624 (+1%) | 10mo | $193,315 | $119 | 77 |
| 736-738 Lilley Ave | 0.45mi | 4/— | 1,551 (-4%) | 6mo | $240,000 | $155 | 68 |
| 1710-1712 E Whittier St | 0.25mi | 4/— | 1,624 (+1%) | 24mo | $300,000 | $185 | 67 |
| 960 Ferndale Pl | 0.72mi | 4/— | 1,537 (-5%) | 10mo | $225,000 | $146 | 50 |
| 940 Ferndale Pl | 0.72mi | 4/— | 1,782 (+10%) | 1mo | $206,000 | $116 | 48 |
| 969 Sheridan Ave | 0.75mi | 4/— | 1,792 (+11%) | 0mo | $295,000 | $165 | 46 |
| 651-653 Rhoads Ave | 0.57mi | 4/— | 1,844 (+14%) | 14mo | $270,000 | $146 | 38 |
Match score weights: distance 35% · size 25% · config 20% · recency 20%. Top-matched comps best support the ARV.
Projected returns pro-forma
-3.0% appreciation · 3.51% rent growth · sell at horizon
- IRR
- -4.4%
- Equity multiple
- 0.83×
- Total profit
- $-11,427
- Equity at exit
- $36,530
- IRR
- 5.8%
- Equity multiple
- 1.44×
- Total profit
- $30,094
- Equity at exit
- $21,183
Cash invested: $68,600 (down + closing). Projections, not guarantees.
Landlord ↔ Tenant lean methodology
- Overall (STATE)
- 73 Landlord-Friendly
- State Ohio
- 73 Landlord-Friendly · R+6
- County
- — inherits STATE
- City
- — inherits STATE
ZIP-level market 43206
- Rents YoY
- 3.5%
- Active inventory
- 193
- Price-to-rent
- 16.1×
Monthly cashflow live
- Estimated rent
- $2,531 high interval (Pro) →
- Mortgage (P&I)
- −$1,285
- Tax from tax record
- −$189 /mo · $2,264/yr
- Insurance
- −$102
- HOA
- −$0
- Vacancy / Maint / Mgmt
- −$532
- Net cashflow
- $424
Break-even live
Sensitivity live
| Price | -10% $563 | -5% $493 | +0% $424 | +5% $355 | +10% $285 |
|---|---|---|---|---|---|
| Rent | -10% $224 | -5% $324 | +0% $424 | +5% $524 | +10% $624 |
| Rate | -1.0pp $547 | -0.5pp $486 | base $424 | +0.5pp $360 | +1.0pp $296 |
2-unit breakdown (identical units grouped — click to expand)
| Units | Beds | Baths | Est. rent |
|---|---|---|---|
| 2× units | 2 | 1 | $2,530 |
| #1 | 2 | 1 | $1,265 |
| #2 | 2 | 1 | $1,265 |
| Total (2 units) | $2,531 | ||
UW: 25.0% down · 7.5% · 30yr · 1.5% tax · 5.0% vac · 8.0% maint · 8.0% mgmt
Financing live
Cash to close
- Down payment
- $61,250
- Closing costs
- $7,350
- Reserves months
- —
- Total cash needed
- —
Loan-product check · same deal, 3 products live
Conventional
25% down · 7.5% · 30yr
- Down + closing
- —
- Monthly P&I
- —
- Monthly cashflow
- —
- DSCR
- —
- Eligible?
- —
Personal DTI + credit; lowest rate.
DSCR
20% down · 8.5% · 30yr
- Down + closing
- —
- Monthly P&I
- —
- Monthly cashflow
- —
- DSCR
- —
- Eligible?
- —
No personal income docs; deal must DSCR.
Hard money
10% down · 12.0% · 12mo
- Down + closing
- —
- Monthly P&I
- —
- Monthly cashflow
- —
- DSCR
- —
- Eligible?
- —
Short-term bridge; refi at stabilization.
Rent comps 40 comps
| Address | Beds | Baths | Sqft | Rent | $/sqft | DOM | Units | Dist |
|---|---|---|---|---|---|---|---|---|
| 1050 Bulen Ave Columbus, OH | 3.0 | 2.0 | 1104 | $1,700 | $1.54 | 18d | 1 | 0.07mi |
| 864 Fairwood Ave Columbus, OH | 3.0 | 1.0 | 1176 | $1,300 | $1.11 | 44d | 1 | 0.24mi |
| 852-854 Fairwood Ave Columbus, OH | 3.0 | 1.0 | 1176 | $1,295 | $1.10 | 15d | 1 | 0.25mi |
| 852-854 Fairwood Ave Columbus, OH | 3.0 | 1.0 | 1176 | $1,295 | $1.10 | 24d | 1 | 0.25mi |
| 854 Fairwood Ave Columbus, OH | 3.0 | 1.0 | 1176 | $1,295 | $1.10 | 44d | 1 | 0.25mi |
| 910 Rhoads Ave Columbus, OH | 1.0–3.0 | 1.0–2.0 | 941 | $1,350 | $1.43 | 2d | 30 | 0.30mi |
| 773-775 Berkeley Rd Columbus, OH | 3.0 | 1.0 | 1280 | $1,400 | $1.09 | 22d | 1 | 0.40mi |
| 773-775 Berkeley Rd Columbus, OH | 3.0 | 1.0 | 1280 | $1,350 | $1.05 | 2d | 1 | 0.40mi |
| 1805 Kent St Columbus, OH | 4.0 | 1.5 | 1399 | $1,900 | $1.36 | 24d | 1 | 0.41mi |
| 1026 Ellsworth Ave Columbus, OH | 3.0 | 1.0 | 1100 | $1,295 | $1.18 | 20d | 1 | 0.42mi |
| 736 Seymour Ave Columbus, OH | 3.0 | 1.0 | 1176 | $1,350 | $1.15 | 44d | 1 | 0.42mi |
| 908 Ellsworth Ave Columbus, OH | 3.0 | 1.0 | 1154 | $1,325 | $1.15 | 4d | 1 | 0.43mi |
| 1106 Ellsworth Ave Columbus, OH | 3.0 | 1.0 | 1150 | $1,495 | $1.30 | 8d | 1 | 0.45mi |
| 614-616 Lilley Ave Columbus, OH | 3.0 | 1.5 | 1232 | $1,700 | $1.38 | 44d | 1 | 0.61mi |
| 904 Studer Ave Columbus, OH | 3.0 | 1.5 | 1364 | $1,780 | $1.30 | 24d | 1 | 0.61mi |
| 883 Studer Ave Columbus, OH | 4.0 | 2.5 | 2217 | $2,500 | $1.13 | 2d | 1 | 0.65mi |
| 932 Linwood Ave Columbus, OH | 4.0 | 1.5 | 1663 | $2,045 | $1.23 | 44d | 1 | 0.68mi |
| 1167 E Whittier St Columbus, OH | 3.0 | 1.5 | 1300 | $1,950 | $1.50 | 44d | 1 | 0.68mi |
| 1165-1167 E Whittier St Columbus, OH | 3.0 | 1.5 | 1300 | $1,950 | $1.50 | 44d | 1 | 0.69mi |
| 988 Linwood Ave Columbus, OH | 4.0 | 3.0 | 1800 | $2,750 | $1.53 | 18d | 1 | 0.69mi |
| 558 Lilley Ave Columbus, OH | 3.0 | 1.0 | 1372 | $1,600 | $1.17 | 44d | 1 | 0.69mi |
| 1683-1685 E Main St Columbus, OH | 3.0 | 2.0 | 1380 | $1,695 | $1.23 | 13d | 1 | 0.78mi |
| 857 Wilson Ave #859 Columbus, OH | 3.0 | 2.5 | 1527 | $1,650 | $1.08 | 44d | 1 | 0.79mi |
| 815 Wilson Ave Columbus, OH | 3.0 | 1.5 | 1400 | $1,500 | $1.07 | 8d | 1 | 0.80mi |
| 813 Wilson Ave Unit 1 Columbus, OH | 3.0 | 1.5 | 1400 | $1,500 | $1.07 | 8d | 1 | 0.80mi |
| 555 Kimball Pl Columbus, OH | 3.0 | 2.5 | 1252 | $1,785 | $1.43 | 44d | 1 | 0.84mi |
| 1559 Frebis Ave Columbus, OH | 3.0 | 2.0 | 1744 | $2,100 | $1.20 | 44d | 1 | 0.84mi |
| 1288 Linwood Ave Columbus, OH | 3.0 | 1.0 | 1344 | $1,900 | $1.41 | 44d | 1 | 0.85mi |
| 997 Oakwood Ave Columbus, OH | 3.0 | 1.5 | 1260 | $1,800 | $1.43 | 13d | 1 | 0.88mi |
| 730-732 Oakwood Ave Unit 732 Columbus, OH | 3.0 | 1.0 | 1232 | $1,425 | $1.16 | 44d | 1 | 0.88mi |
| 391 Berkeley Rd Columbus, OH | 3.0 | 1.5 | 1518 | $2,295 | $1.51 | 15d | 1 | 0.92mi |
| 382 Morrison Ave Columbus, OH | 4.0 | 1.5 | 2027 | $2,500 | $1.23 | 3d | 1 | 0.92mi |
| 627 Oakwood Ave Columbus, OH | 3.0 | 2.5 | 2009 | $2,379 | $1.18 | 13d | 1 | 0.96mi |
| 814 S Ohio Ave Columbus, OH | 3.0 | 1.0 | 1380 | $1,600 | $1.16 | 44d | 1 | 0.98mi |
| 685 S Champion Ave Unit 683 Columbus, OH | 3.0 | 1.0 | 1364 | $1,575 | $1.15 | 22d | 1 | 0.99mi |
| 1702 Bryden Rd #1704 Columbus, OH | 3.0 | 2.5 | 2000 | $2,300 | $1.15 | 18d | 1 | 1.00mi |
| 977 S Ohio Ave Columbus, OH | 3.0 | 2.5 | 1650 | $2,500 | $1.52 | 44d | 1 | 1.01mi |
| 1118 S Ohio Ave Columbus, OH | 3.0 | 1.5 | 1232 | $1,750 | $1.42 | 44d | 1 | 1.03mi |
| 2200 E Main St Bexley, OH | 3.0 | 1.0–3.0 | 1142 | $4,678 | $4.10 | 2d | 137 | 1.04mi |
| 1227 S Champion Ave Unit 1227 Columbus, OH | 3.0 | 1.0 | 1110 | $1,195 | $1.08 | 4d | 1 | 1.05mi |
Listing history 30 events
-
2026-06-18days on market $245,000 Active 225 DOM
-
2026-06-17days on market $245,000 Active 224 DOM
-
2026-06-16days on market $245,000 Active 223 DOM
-
2026-06-15days on market $245,000 Active 222 DOM
-
2026-06-13days on market $245,000 Active 220 DOM
-
2026-06-13days on market $245,000 Active 219 DOM
-
2026-06-09days on market $245,000 Active 216 DOM
-
2026-06-08days on market $245,000 Active 215 DOM
-
2026-06-07days on market $245,000 Active 214 DOM
-
2026-06-05days on market $245,000 Active 211 DOM
-
2026-06-03days on market $245,000 Active 210 DOM
-
2026-06-02days on market $245,000 Active 209 DOM
-
2026-06-01days on market $245,000 Active 208 DOM
-
2026-05-31days on market $245,000 Active 207 DOM
-
2025-11-05$245,000 Active 809-char remark
Show marketing remark (809 chars)
This fully occupied duplex is situated in a great location near Downtown Columbus, Nationwide Children's Hospital, and more! The property has been well maintained with recent updates including brand new windows in 2024, new hot water tanks in both units in 2023, and many other updates. The hole in the kitchen ceiling is from a previous leak that has been remedied. The ceiling is being patched and painted. Each unit consists of 2 bedrooms/1 bathroom, a full separate basement, and plenty of yard space. Both units are occupied, with unit 1656 rented at $980/month until 7/31/2026, while unit 1658 is rented at $1,025/month on a month-to-month lease. Tenants pay for all utilities. This property is professionally managed, and who's willing to stay in place. The inspection report is available upon request.
-
2025-01-06historical
-
2024-11-23status Active
-
2024-11-16historical Contingent Finance and Inspection
-
2024-11-05price $255,000
-
2024-05-29price $262,500
-
2024-05-07$265,000 Active
-
2021-12-02soldstatus $210,000
-
2017-08-11soldstatus $147,500
-
2007-03-23historical
-
2007-01-17$64,900
-
2003-09-29soldstatus $40,000
-
2003-09-22historical
-
2003-08-27$45,000
-
1999-04-15soldstatus $69,900
-
1999-03-04soldstatus $40,000
ⓘ Source: listings_history table (triggers on properties + properties_extension) + one-shot
backfill from property_details.listing_events for pre-trigger history.
Tax reassessment forecast OH · Partial reset (capped growth)
- Current annual tax
- $2,264 · $189/mo
- Projected year-2 tax
- $3,043 · $254/mo
- Expected delta
- +$779/yr (+$65/mo · 34.4%)
ⓘ Screening estimate from a state-policy table — verify with the county assessor before closing.
Climate risk First Street
- Flood 1/10 Low FEMA zone X (unshaded) · 0% chance over 30 yrs
- Wildfire 1/10 Low
- Heat 4/10 Moderate 7 d/yr ≥100°F today · 18 d/yr by 30 yrs out
- Wind 2/10 Low 100% chance of damaging wind over 30 yrs
- Air quality 3/10 Moderate 2 unhealthy d/yr today · 3 by 30 yrs out
Nearby sold comps map
Loading sold comps map…
Walkable amenities ~0.75 mi
Loading nearby amenities…
Taxation est. · year 1
- Rental income
- $30,372
- − Mortgage interest
- −$13,724
- − Property taxes
- −$2,264
- − Insurance
- −$1,225
- − Repairs & maintenance
- −$2,430
- − Management
- −$2,430
- − Depreciation
- −$7,127
- Taxable income
- $1,173
- Est. tax owed @ 24.0%
- −$281
- After-tax cash flow
- $4,806/yr
For passive investors: Depreciation is non-cash, so a rental often shows a tax loss while cash-flowing — sheltering income. Rental losses are passive: they offset passive income freely, and up to $25,000/yr can offset ordinary (W-2) income if you actively participate and your MAGI is under $100k (phasing out to $0 by $150k); unused losses carry forward. On sale, claimed depreciation is recaptured at up to 25%, and gains may owe capital-gains tax (a 1031 exchange can defer both). Figures are a year-1 estimate at your 24.0% rate — not tax advice; consult a CPA.
Schools (NCES district)
- District
- Columbus City School District
- NCES district ID
- 3904380
- Math proficiency
- 15% ▼ -17.00%
- Reading proficiency
- 26% ▼ -12.00%
- Median HH income
- $38,483
- Composite
- 17.19/100
- National rank
- #9105
- State rank
- #626 of 656 in OH
Livability — Columbus
- Score
- 81/100
- State rank
- #97
- US rank
- #1491
Category grades
Schools grade is shown separately in the Schools card above.
Census & demographics
- Census place
- Columbus, OH
- County
- Franklin County · 1,351,780 people
- City population
- 612,189
- Metro
- Columbus, OH
- Population (ZIP)
- 21,996
- Household income
- $75,806
- Rent vs Own
- Severe rent burden
- 846.0
Population outlook (Franklin County) Hauer SSP2
- Today (2025)
- 1,456,139 people
- By 2030
- 1,556,890 · +6.9%
- By 2040
- 1,757,349 · +20.7%
- By 2050
- 1,950,539 · +34.0%
- By 2075
- 2,376,171 · +63.2%
- By 2100
- 2,636,796 · +81.1%
Race, ethnicity, and origin ACS 2023
- Neighborhood character
- Diverse neighborhood (Simpson 0.59)
- Race & ethnicity
- White 56% Black 31% Two or more races 9% Hispanic / Latino 4% Asian 1% Native American 1%
- Common ancestry
- Romanian 3% Slovak 2% Lithuanian 1%
- Foreign-born
- 4% · Canada
- Languages at home
- 96% English-only · Spanish 2% Other Indo-European 1%
Political lean MEDSL · Franklin
- 2024 margin
- Strong D (+28.4) · D 63.7% · R 35.3% · Other 1.0%
- 2008→2024 swing
- +7.7pp toward D · 2008: 20.7pp · 2024: 28.4pp
- All cycles
- 2024: D+28.4 2020: D+31.4 2016: D+25.9 2012: D+21.7 2008: D+20.7
Not yet ingested
- Civics
- —
Market trends
- HPI YoY
- ▼ -576.73%
- Current HPI
- 173.8569
- Rent YoY
- ▲ 3.51%
- Metro
- Columbus, OH
- State GDP YoY
- ▲ 1.98%
- F500 in state
- 48
Industry mix (Fortune 500 HQ in OH)
| Industry | F500 HQs | Revenue |
|---|---|---|
| Insurance | 3 | $145B |
|
||
| Industrial Machinery | 3 | $49B |
|
||
| Financial Services | 3 | $24B |
|
||
| Consumer Goods | 2 | $93B |
|
||
| Aerospace / Defense | 2 | $47B |
|
||
| Utilities | 2 | $33B |
|
||
Price history
+512.5% since first listed16 events — show timeline
- 2025-11-05 Listed $245,000 CBRMLS
- 2025-01-06 Listing Removed — CBRMLS
- 2024-11-23 Relisted — CBRMLS
- 2024-11-16 Contingent — CBRMLS
- 2024-11-05 Price Changed $255,000 CBRMLS
- 2024-05-29 Price Changed $262,500 CBRMLS
- 2024-05-07 Listed $265,000 CBRMLS
- 2021-12-02 Sold (Public Records) $210,000 Public Records
- 2017-08-11 Sold (Public Records) $147,500 Public Records
- 2007-03-23 Listing Removed — CBRMLS
- 2007-01-17 Listed $64,900 CBRMLS
- 2003-09-29 Sold (MLS) $40,000 CBRMLS
- 2003-09-22 Listing Removed — CBRMLS
- 2003-08-27 Listed $45,000 CBRMLS
- 1999-04-15 Sold (Public Records) $69,900 Public Records
- 1999-03-04 Sold (Public Records) $40,000 Public Records
Property tax history
+6.8%/yrLatest (2024): $2,264 · -5.1% YoY. Source: county tax records.
Cash-flow waterfall
monthlySold comps — $/sqft
last 12 mo · ≤1 miLoading sold comps…