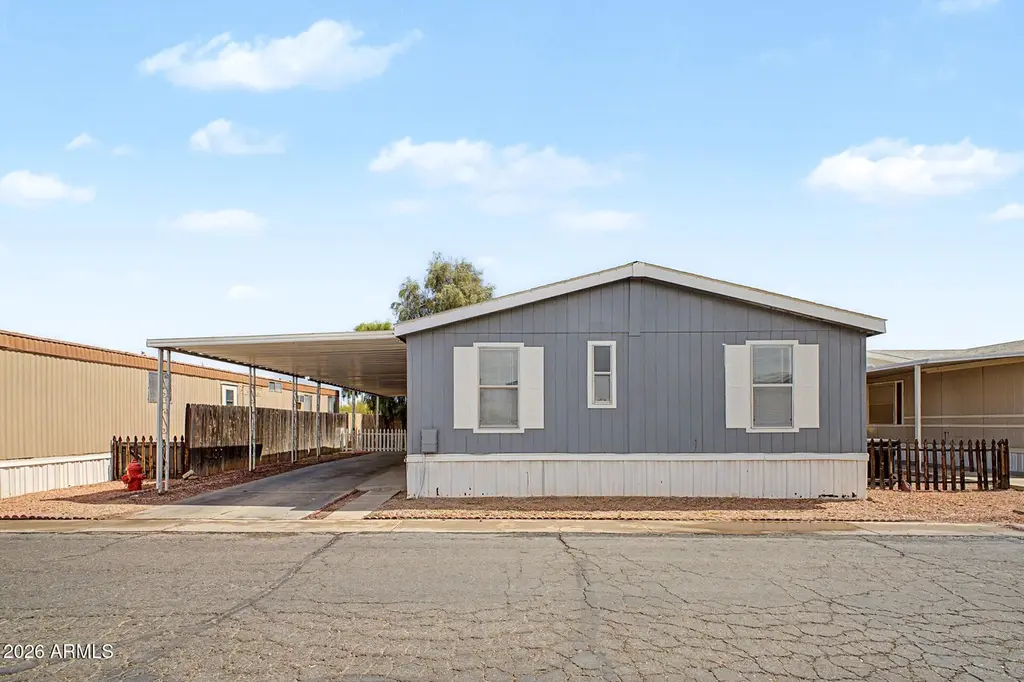
8427 W Glendale Ave #210 · Glendale, AZ
Flood risk 1/10 · Minimal
- FEMA flood zone
- X (shaded)
- Chance of flooding over 30 yrs
- 0.0%
- Est. flood insurance / yr
- $507 – $1,088
Fire risk 1/10 · Minimal
- Est. fire insurance / yr
- $610 – $1,132
Heat risk 9/10 · Severe
- Hot days now (above 112°F)
- 7 days/yr
- Hot days in 30 yrs
- 19 days/yr
Wind risk 1/10 · Minimal
- Chance of severe wind over 30 yrs
- —
Air-quality risk 2/10 · Minimal
- Unhealthy air days now
- 0 days/yr
- Unhealthy air days in 30 yrs
- 1 days/yr
Risk factors via First Street. Map © Google.
Why this score? — see what drove the B+ grade
The composite is a weighted blend of 9 inputs, each scored 0–100. Each bar is that input's sub-score; the figure is the points it added to the 100-point composite (weight × sub-score).
- Cash flow +30.0/30.0
- ARV discount +15.0/15.0
- 1% rule +10.0/10.0
- DSCR +10.0/10.0
- Livability +3.8/5.0
- Condition / age +3.8/5.0
- Rent growth +1.8/5.0
- Schools +1.6/10.0
- Appreciation +0.0/10.0
$89,900
🖨 Deal sheet 📄 Offer letter ✓ Due diligence
Listing remarks
Beautiful 4-bedroom home in a prime Glendale location, walking distance to the popular Westgate Entertainment District with dining, shopping, and entertainment just minutes away. This well-designed home features a desirable split floorplan offering added privacy, along with a spacious living room and separate family room providing flexibility for entertaining, relaxing, or creating a home office or game room. The primary suite includes a private bathroom with a separate tub and shower, creating a comfortable retreat. With generous living space and an unbeatable location near Westgate, major freeways, and entertainment venues, this home offers convenience, comfort, and access to some of Glen
Key facts
- Glendale location
- Split floorplan
- Private bathroom
Tags
Property features AI
Finance
- HOA & community: Land lease of $825 per month; No association fees included; Community playground
Exterior
- Parking: 1 covered parking space; 1 carport space
- Utilities: City water; Public sewer
- Home design: Manufactured/mobile home; Leasehold ownership
- Construction: Wood siding; Wood frame; Steel frame; Composition roof
- Exterior features: Partial fencing; Gravel/stone front; Private maintained road
Interior
- Kitchen: Laminate counters; Refrigerator
- Bedrooms: Up to 4 possible bedrooms
- Flooring: Carpet; Laminate
- Bathrooms: 2 full bathrooms
- Heating & cooling: Electric heating; Cooling information: see remarks
- Interior features: Eat-in kitchen; Vaulted ceilings; Full bath in primary bedroom; Separate shower and tub; Dual-pane windows
Neighborhood map
What this means for you Summary
Snapshot
- This is a 4-bed/2.0-bath manufactured listed at $90k. Condition is rated good.
Deal economics
- At list price, monthly cash flow is $1k ($14k/yr) — positive.
- The deal already cash-flows at list — no discount required.
- Meets the 1% rule at list price ($2k rent vs $90k).
- Recommended offer: $85k (6.0% below list) — sets the bar for market timing.
- Cap rate 22.0% vs local median 3.5% in Glendale — top-decile yield for the area; either an underpriced asset or a hidden risk that comps aren't pricing in. Stress-test before assuming the spread holds.
Location & tenants
- Location reads 76/100 on livability (#12 in AZ, #3,235 nationally) — a middle-class / working-renter tenant base. Strengths: commute A+, housing A+, amenities B; Watch: health & safety D+, crime F.
- Tolleson Union High School District (4288) (suburban): math 14% / reading 22% proficiency, ranked #188 of 249 in AZ (top 76%) — low school quality limits family demand, transient renter base, plan for 1-2y turnover.
- Zoned schools: Copper Canyon High School (math 6% / reading 15%, grade F, #295 of 381 statewide, top 78%, 2,156 students, 60% FRL).
- Market conditions: Rents soft (-2.8%/yr); 119 active listings in the ZIP; 40 comparable units currently listed for rent nearby; rentals leasing fast (median 3d on market — plan ~1-2 weeks tenant-placement turnaround); solid renter incomes; 36,011 units permitted in Maricopa County in 2024 (12,801 in 5+ unit buildings).
- This rent runs 31% of the median local income ($88k/yr) — at the standard rent-burdened threshold; future hikes will face affordability resistance.
Forward outlook
- Local home prices are declining (-3.0%/yr); year-one equity from $622 of loan paydown is wiped out by about $3k of value loss. Plan a longer hold.
- Maricopa County population projected at +38% by 2050 — long-run rental-demand tailwind backs the buy-and-hold thesis.
- At projected returns (-3.0% appreciation + 0.0% rent growth), your $25k cash investment doubles in ~3 years — after that, you're playing with house money.
Negotiation context
- It's been on market 66 days — a 6% lower offer ($85k) is reasonable based on typical stale-listing flexibility.
- 2 sale attempts with the ask held roughly flat each time — persistent listings suggest the price (not the market) is what's stuck; bring a comps-based counter.
Risks & watch-outs
- Climate carrying-cost: extreme-heat days projected 7→19/yr by 2055 (HVAC capex compounding) — expect insurance premiums to compound above CPI over the hold.
Questions for the listing agent
- It's been on market 66 days. Have you received any prior offers? Is the seller open to a 6% concession, seller financing, or rate buy-down credit?
- Why hasn't it sold? Are there any deal-killer items the seller is aware of (foundation, flood, title, zoning, code violations)?
- Is there a deadline driving the sale (1031 exchange, divorce, estate, relocation)? That informs how much negotiation room exists.
- Crime grade is F in this area — have there been break-ins, vandalism, or insurance claims at this property in the last 3 years? What carrier currently insures it and at what premium?
- What's the average days-on-market for RENTAL listings here right now (not sales)? A rising rental-DOM trend means longer vacancies and softer asking-rent achievability than the comps imply.
- What's the recent tenant-quality profile in this submarket — average credit score on applications, eviction rate, late-payment / NSF rate, and stable-employment percentage? A property-management company in the area should have these aggregated.
- How much new for-sale + rental construction is in the pipeline within 1–3 miles? Heavy new supply typically softens prices + rents 12–24 months out; constrained supply supports both.
Investment metrics
- 1% rule
- 2.54% ✓
- Cap rate
- 22.03%
- Cash-on-cash
- 56.22%
- DSCR
- 3.50
- GRM
- 3.3
CMA / ARV
- ARV (on-the-fly)
- $131,712
- Comps found
- 2
Show comp detail 2 sales within ~0.75 mi
| Address | Dist | Beds/Ba | Sqft | Sold | Price | $/sf | Match |
|---|---|---|---|---|---|---|---|
| 8427 W Glendale Ave #31 | 0.00mi | 3/2.0 (-1) | 1,536 (-2%) | 13mo | $110,000 | $72 | 80 |
| 8427 W Glendale Ave #160 | 0.04mi | 3/2.0 (-1) | 1,369 (-13%) | 24mo | $115,000 | $84 | 52 |
Match score weights: distance 35% · size 25% · config 20% · recency 20%. Top-matched comps best support the ARV.
Projected returns pro-forma
-3.0% appreciation · 0.0% rent growth · sell at horizon
- IRR
- 51.2%
- Equity multiple
- 3.14×
- Total profit
- $53,895
- Equity at exit
- $13,404
- IRR
- 55.3%
- Equity multiple
- 5.69×
- Total profit
- $117,970
- Equity at exit
- $7,773
Cash invested: $25,172 (down + closing). Projections, not guarantees.
Landlord ↔ Tenant lean methodology
- Overall (STATE)
- 87 Strongly Landlord-Friendly
- State Arizona
- 87 Strongly Landlord-Friendly · R+3
- County
- — inherits STATE
- City
- — inherits STATE
ZIP-level market 85305
- Home prices YoY
- -29.0%
- Rents YoY
- -2.8%
- Active inventory
- 119
- Price-to-rent
- 3.3×
Monthly cashflow live
- Estimated rent
- $2,279 high interval (Pro) →
- Mortgage (P&I)
- −$471
- Tax est. 1.5%
- −$112 /mo · $1,348/yr
- Insurance
- −$37
- HOA
- −$0
- Vacancy / Maint / Mgmt
- −$479
- Net cashflow
- $1,179
Break-even live
UW: 25.0% down · 7.5% · 30yr · 1.5% tax · 5.0% vac · 8.0% maint · 8.0% mgmt
Financing live
Cash to close
- Down payment
- $22,475
- Closing costs
- $2,697
- Reserves months
- —
- Total cash needed
- —
Loan-product check · same deal, 3 products live
Conventional
25% down · 7.5% · 30yr
- Down + closing
- —
- Monthly P&I
- —
- Monthly cashflow
- —
- DSCR
- —
- Eligible?
- —
Personal DTI + credit; lowest rate.
DSCR
20% down · 8.5% · 30yr
- Down + closing
- —
- Monthly P&I
- —
- Monthly cashflow
- —
- DSCR
- —
- Eligible?
- —
No personal income docs; deal must DSCR.
Hard money
10% down · 12.0% · 12mo
- Down + closing
- —
- Monthly P&I
- —
- Monthly cashflow
- —
- DSCR
- —
- Eligible?
- —
Short-term bridge; refi at stabilization.
Rent comps 40 comps
| Address | Beds | Baths | Sqft | Rent | $/sqft | DOM | Units | Dist |
|---|---|---|---|---|---|---|---|---|
| 8564 W Ocotillo Rd Glendale, AZ | 3.0 | 2.0 | 1420 | $1,895 | $1.33 | 1d | 1 | 0.23mi |
| 8565 W Tuckey Ln Glendale, AZ | 3.0 | 2.0 | 1464 | $2,100 | $1.43 | 1d | 1 | 0.30mi |
| 6512 N 85th Ave Glendale, AZ | 3.0 | 2.5 | 1906 | $1,976 | $1.04 | 18d | 1 | 0.33mi |
| 8407 W Myrtle Ave Glendale, AZ | 3.0 | 2.0 | 2220 | $2,300 | $1.04 | 24d | 1 | 0.36mi |
| 8407 W Myrtle Ave Glendale, AZ | 3.0 | 2.0 | 2220 | $2,200 | $0.99 | 17d | 1 | 0.36mi |
| 8805 W Glenn Dr Glendale, AZ | 4.0 | 2.0 | 2143 | $2,495 | $1.16 | 5d | 1 | 0.37mi |
| 8736 W Tuckey Ln Glendale, AZ | 4.0 | 3.0 | 2170 | $2,501 | $1.15 | 1d | 1 | 0.42mi |
| 8745 W Tuckey Ln Glendale, AZ | 4.0 | 2.0 | 1776 | $2,315 | $1.30 | 1d | 1 | 0.46mi |
| 8735 W Sierra Vista Dr Glendale, AZ | 3.0 | 2.5 | 1840 | $2,431 | $1.32 | 1d | 1 | 0.48mi |
| 8831 W Northview Ave Glendale, AZ | 4.0 | 1.5 | 1575 | $1,399 | $0.89 | 24d | 1 | 0.59mi |
| 7306 N 88th Ln Glendale, AZ | 4.0 | 2.0 | 1913 | $4,500 | $2.35 | 1d | 1 | 0.64mi |
| 6528 N 80th Ave Glendale, AZ | 4.0 | 2.0 | 1776 | $2,500 | $1.41 | 1d | 1 | 0.64mi |
| 6157 N 87th Ln Glendale, AZ | 3.0 | 2.0 | 1638 | $1,990 | $1.21 | 5d | 1 | 0.70mi |
| 6157 N 87th Ln Glendale, AZ | 3.0 | 2.0 | 1638 | $2,030 | $1.24 | 18d | 1 | 0.70mi |
| 7402 N 88th Ln Glendale, AZ | 4.0 | 2.0 | 2219 | $2,195 | $0.99 | 44d | 1 | 0.70mi |
| 9020 W Nicolet Ave Glendale, AZ | 3.0 | 2.5 | 1903 | $2,045 | $1.07 | 15d | 1 | 0.76mi |
| 9020 W Nicolet Ave Glendale, AZ | 3.0 | 2.5 | 1903 | $2,045 | $1.07 | 18d | 1 | 0.76mi |
| 7403 N 91st Ave Glendale, AZ | 1.0–3.0 | 1.0–2.0 | 1014 | $2,328 | $2.29 | 2d | 14 | 0.81mi |
| 6832 N 77th Ln Glendale, AZ | 5.0 | 3.0 | 2136 | $2,300 | $1.08 | 22d | 1 | 0.88mi |
| 7732 W Ocotillo Rd Glendale, AZ | 3.0 | 2.0 | 1446 | $2,000 | $1.38 | 1d | 1 | 0.93mi |
| 8752 W Frier Dr Glendale, AZ | 3.0 | 2.0 | 1922 | $2,100 | $1.09 | 44d | 1 | 0.95mi |
| 8860 W Frier Dr Glendale, AZ | 3.0 | 2.0 | 1922 | $2,095 | $1.09 | 22d | 1 | 0.96mi |
| 7963 W Marlette Ave Glendale, AZ | 4.0 | 2.5 | 1959 | $2,096 | $1.07 | 1d | 1 | 0.98mi |
| 7460 N Zanjero Blvd Glendale, AZ | 1.0–3.0 | 1.0–2.0 | 949 | $2,374 | $2.50 | 2d | 45 | 0.99mi |
| 7375 N Zanjero Blvd Glendale, AZ | 1.0–3.0 | 1.0–3.0 | 975 | $2,174 | $2.23 | 2d | 41 | 1.00mi |
| 7668 W Flynn Ln Glendale, AZ | 3.0 | 2.5 | 2178 | $2,196 | $1.01 | 20d | 1 | 1.04mi |
| 6585 N 77th Dr Glendale, AZ | 4.0 | 2.0 | 1710 | $2,095 | $1.23 | 1d | 1 | 1.04mi |
| 7812 N 79th Dr Glendale, AZ | 4.0 | 2.0 | 1682 | $2,250 | $1.34 | 1d | 1 | 1.17mi |
| 8746 W Solano Dr Glendale, AZ | 4.0 | 2.5 | 2162 | $2,500 | $1.16 | 13d | 1 | 1.17mi |
| 8908 W Solano Dr Glendale, AZ | 3.0 | 2.0 | 1400 | $3,000 | $2.14 | 3d | 1 | 1.19mi |
| 7861 N 80th Ave Glendale, AZ | 4.0 | 2.0 | 1614 | $2,250 | $1.39 | 8d | 1 | 1.20mi |
| 8924 W Solano Dr Glendale, AZ | 3.0 | 2.0 | 1399 | $4,000 | $2.86 | 1d | 1 | 1.20mi |
| 8915 W Solano Dr Glendale, AZ | 3.0 | 2.0 | 1399 | $2,150 | $1.54 | 3d | 1 | 1.22mi |
| 8923 W Solano Dr Glendale, AZ | 3.0 | 2.0 | 1400 | $1,999 | $1.43 | 12d | 1 | 1.23mi |
| 9450 W Cabela Dr Glendale, AZ | 3.0 | 1.0–2.0 | 1027 | $2,073 | $2.02 | 2d | 13 | 1.25mi |
| 8749 W San Miguel Ave Glendale, AZ | 3.0 | 2.0 | 1800 | $2,450 | $1.36 | 3d | 1 | 1.25mi |
| 6780 N 74th Dr Glendale, AZ | 3.0 | 2.0 | 1646 | $1,900 | $1.15 | 1d | 1 | 1.27mi |
| 6780 N 74th Dr Glendale, AZ | 3.0 | 2.0 | 1646 | $1,900 | $1.15 | 18d | 1 | 1.27mi |
| 7455 N 95th Ave Glendale, AZ | 1.0–3.0 | 1.0–2.0 | 1080 | $2,162 | $2.00 | 2d | 16 | 1.28mi |
| 8839 W Manzanita Dr Peoria, AZ | 3.0 | 2.0 | 1343 | $2,305 | $1.72 | 22d | 1 | 1.28mi |
Listing history 17 events
-
2026-06-18days on market $89,900 Active 66 DOM
-
2026-06-17days on market $89,900 Active 65 DOM
-
2026-06-16days on market $89,900 Active 64 DOM
-
2026-06-15days on market $89,900 Active 63 DOM
-
2026-06-13days on market $89,900 Active 61 DOM
-
2026-06-09days on market $89,900 Active 57 DOM
-
2026-06-08days on market $89,900 Active 56 DOM
-
2026-06-07days on market $89,900 Active 55 DOM
-
2026-06-04days on market $89,900 Active 52 DOM
-
2026-06-03days on market $89,900 Active 51 DOM
-
2026-06-02days on market $89,900 Active 50 DOM
-
2026-06-01days on market $89,900 Active 49 DOM
-
2026-05-31days on market $89,900 Active 48 DOM
-
2026-05-18historical Under Contract Accepting Backups
-
2026-04-13$89,900 Active
-
2026-01-01historical
-
2025-07-23$139,900 Active
ⓘ Source: listings_history table (triggers on properties + properties_extension) + one-shot
backfill from property_details.listing_events for pre-trigger history.
Climate risk First Street
- Flood 1/10 Low FEMA zone X (shaded) · 0% chance over 30 yrs
- Wildfire 1/10 Low
- Heat 9/10 Extreme 7 d/yr ≥112°F today · 19 d/yr by 30 yrs out
- Wind 1/10 Low
- Air quality 2/10 Low 0 unhealthy d/yr today · 1 by 30 yrs out
Nearby sold comps map
Loading sold comps map…
Walkable amenities ~0.75 mi
Loading nearby amenities…
Taxation est. · year 1
- Rental income
- $27,350
- − Mortgage interest
- −$5,036
- − Property taxes
- −$1,348
- − Insurance
- −$450
- − Repairs & maintenance
- −$2,188
- − Management
- −$2,188
- − Depreciation
- −$2,615
- Taxable income
- $13,525
- Est. tax owed @ 24.0%
- −$3,246
- After-tax cash flow
- $10,905/yr
For passive investors: Depreciation is non-cash, so a rental often shows a tax loss while cash-flowing — sheltering income. Rental losses are passive: they offset passive income freely, and up to $25,000/yr can offset ordinary (W-2) income if you actively participate and your MAGI is under $100k (phasing out to $0 by $150k); unused losses carry forward. On sale, claimed depreciation is recaptured at up to 25%, and gains may owe capital-gains tax (a 1031 exchange can defer both). Figures are a year-1 estimate at your 24.0% rate — not tax advice; consult a CPA.
Condition & rehab AI · 12 photos
This well-maintained, move-in-ready manufactured home in Glendale offers a good investment opportunity with a prime location and modern updates.
Value-add opportunities
- Resale painting the exterior — enhances curb appeal
- Rental upgrading ceiling fans — improves comfort and energy efficiency
- Both installing smart home devices — increases convenience and marketability
Renovation cost estimate screening
Value-add ROI direction
- Resale painting the exterior — enhances curb appeal ↑
- Rental upgrading ceiling fans — improves comfort and energy efficiency ↑
- Both installing smart home devices — increases convenience and marketability ↑
ⓘ Cost ranges are severity-bucket heuristics (US national rule-of-thumb). Get contractor quotes + a written scope before underwriting a rehab budget.
Schools (NCES district)
- District
- Tolleson Union High School District (4288)
- NCES district ID
- 0408520
- Math proficiency
- 14% ▼ -21.00%
- Reading proficiency
- 22% ▼ -14.00%
- Median HH income
- $51,925
- Composite
- 16.41/100
- National rank
- #9193
- State rank
- #188 of 249 in AZ
Livability — Glendale
- Score
- 76/100
- State rank
- #12
- US rank
- #3235
Category grades
Schools grade is shown separately in the Schools card above.
Census & demographics
- Census place
- Glendale, AZ
- County
- Maricopa County · 4,537,380 people
- City population
- 294,586
- Metro
- Phoenix-Mesa-Chandler, AZ
- Population (ZIP)
- 18,043
- Household income
- $88,167
- Rent vs Own
- Severe rent burden
- 832.0
Population outlook (Maricopa County) Hauer SSP2
- Today (2025)
- 4,979,203 people
- By 2030
- 5,378,229 · +8.0%
- By 2040
- 6,156,598 · +23.6%
- By 2050
- 6,872,376 · +38.0%
- By 2075
- 8,401,270 · +68.7%
- By 2100
- 9,247,439 · +85.7%
Race, ethnicity, and origin ACS 2023
- Neighborhood character
- Diverse neighborhood (Simpson 0.67)
- Race & ethnicity
- Hispanic / Latino 47% White 31% Two or more races 23% Black 10% Asian 6% Native American 2%
- Hispanic origin (detail)
- Mexican 39% Cuban 1% Dominican 2%
- Common ancestry
- Lithuanian 1% Portuguese 1% Slovak 1%
- Foreign-born
- 19% · Canada, Vietnam
- Languages at home
- 58% English-only · Spanish 32% Other Indo-European 2% French/Haitian/Cajun 1%
Political lean MEDSL · Maricopa
- 2024 margin
- Toss-up / Even · D 47.7% · R 51.2% · Other 1.1%
- 2008→2024 swing
- +7.1pp toward D · 2008: -10.6pp · 2024: -3.5pp
- All cycles
- 2024: R+3.5 2020: D+2.2 2016: R+3.5 2012: R+12.0 2008: R+10.6
Not yet ingested
- Civics
- —
Market trends
- HPI YoY
- ▼ -114.07%
- Current HPI
- 278.8051
- Rent YoY
- ▼ -2.78%
- Metro
- Phoenix-Mesa-Chandler, AZ
- State GDP YoY
- ▲ 4.54%
- F500 in state
- 20
Industry mix (Fortune 500 HQ in AZ)
| Industry | F500 HQs | Revenue |
|---|---|---|
| Technology | 2 | $13B |
|
||
| Mining / Metals | 1 | $23B |
|
||
| Environmental Services | 1 | $16B |
|
||
| Metals / Steel | 1 | $14B |
|
||
| Technology Distribution | 1 | $9B |
|
||
| Homebuilding | 1 | $8B |
|
||
Price history
-35.7% since first listed4 events — show timeline
- 2026-05-18 Contingent — ARMLS
- 2026-04-13 Listed $89,900 ARMLS
- 2026-01-01 Listing Removed — ARMLS
- 2025-07-23 Listed $139,900 ARMLS
Cash-flow waterfall
monthlySold comps — $/sqft
last 12 mo · ≤1 miLoading sold comps…