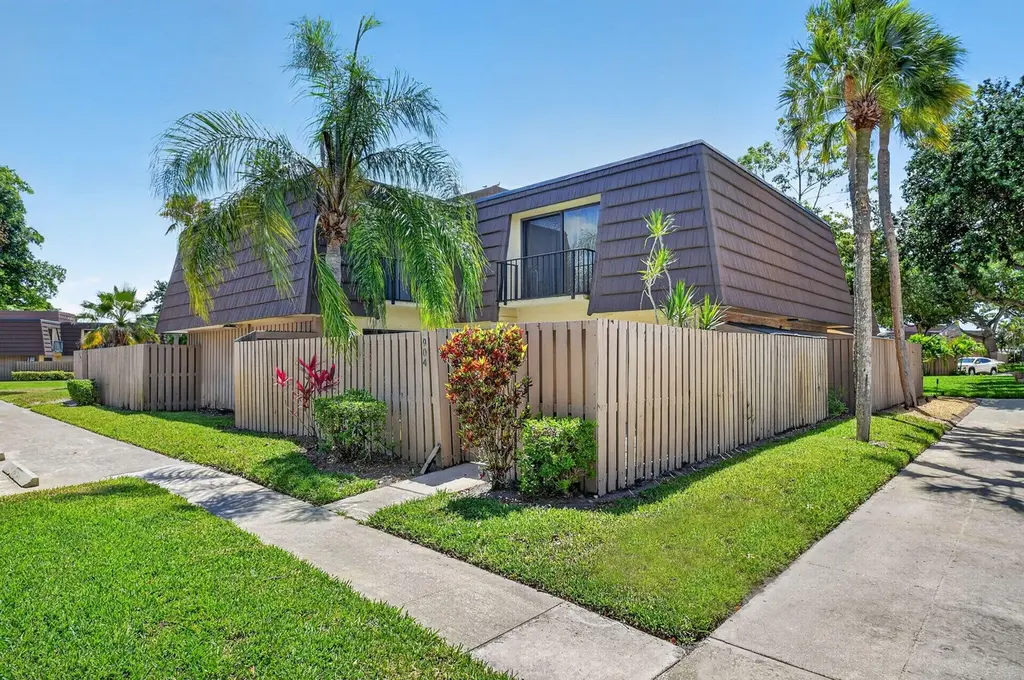
904 9th Ct · Palm Beach Gardens, FL
Flood risk 1/10 · Minimal
- FEMA flood zone
- X (unshaded)
- Chance of flooding over 30 yrs
- 0.0%
- Est. flood insurance / yr
- $507 – $1,088
Fire risk 1/10 · Minimal
- Est. fire insurance / yr
- $947 – $1,759
Heat risk 10/10 · Severe
- Hot days now (above 106°F)
- 7 days/yr
- Hot days in 30 yrs
- 24 days/yr
Wind risk 10/10 · Severe
- Chance of severe wind over 30 yrs
- 99.0%
Air-quality risk 2/10 · Minimal
- Unhealthy air days now
- 0 days/yr
- Unhealthy air days in 30 yrs
- 1 days/yr
Risk factors via First Street. Map © Google.
Why this score? — see what drove the C- grade
The composite is a weighted blend of 9 inputs, each scored 0–100. Each bar is that input's sub-score; the figure is the points it added to the 100-point composite (weight × sub-score).
- Cash flow +19.0/30.0
- ARV discount +7.5/15.0
- DSCR +6.0/10.0
- 1% rule +5.8/10.0
- Schools +4.3/10.0
- Livability +3.5/5.0
- Rent growth +3.1/5.0
- Condition / age +2.5/5.0
- Appreciation +0.0/10.0
$355,000
🖨 Deal sheet 📄 Offer letter ✓ Due diligence
Listing remarks MLS
Sandalwood Palm Beach Gardens townhouse with brand new roof. Wooden fence recently replaced! Kitchen has granite counter tops and stainless steel appliances. Great location with easy access to the beach, Gardens Mall, Downtown at the Gardens and restaurants. Park located in neighborhood.
Key facts
- $239 HOA
- 2 parking spots
- Built 1977
Property features AI
Finance
- Other: Pets allowed (call for details)
- HOA & community: Association: United Community Management Corp; Quarterly HOA includes maintenance of structure and common areas; Association amenities: Pool, playground, parking, maintenance
Exterior
- Parking: 2 assigned asphalt parking spaces; Guest parking
- Security: Smoke detectors
- Utilities: Public water; Public sewer; Cable available; Electricity available
- Home design: Townhouse; One level living; North-facing; Resale property
- Construction: CBS construction; Mansard and shingle roof; Block foundation; Built as a 2-story building (unit has one-level living)
- Exterior features: Open porch; Covered porch; Patio; Fenced yard
Interior
- Kitchen: Electric range; Dishwasher; Microwave; Refrigerator; Electric water heater
- Bedrooms: 2 main-level bedrooms
- Flooring: Ceramic tile; Laminate; Tile; Wood
- Bathrooms: 2 full bathrooms; 1 half bathroom
- Heating & cooling: Central electric heating; Central air conditioning; Ceiling fans
- Interior features: Walk-in closets; Unfurnished
- Laundry & utility: Laundry inside
Neighborhood map
What this means for you Summary
Snapshot
- This is a 2-bed/2.5-bath townhouse listed at $355k.
Deal economics
- At list price, monthly cash flow is $372 ($4k/yr) — positive.
- The deal already cash-flows at list — no discount required.
- Meets the 1% rule at list price ($4k rent vs $355k).
- Recommended offer: $334k (6.0% below list) — sets the bar for market timing.
Location & tenants
- Location reads 69/100 on livability (#464 in FL) — a middle-class / working-renter tenant base. Strengths: crime A+, employment A+, housing A+; Watch: amenities F, commute F, cost of living F.
- Palm Beach (suburban): math 46% / reading 53% proficiency, ranked #34 of 73 in FL (top 47%) — families likely to look elsewhere, expect single-tenant / working-renter base with shorter leases.
- Market conditions: Rents rising (+2.5%/yr); 303 active listings in the ZIP; 23 comparable units currently listed for rent nearby; rentals at typical pace (median 24d on market — plan ~3-4 weeks tenant-placement turnaround); solid renter incomes; 3,974 units permitted in Palm Beach County in 2024 (1,012 in 5+ unit buildings).
- At $3,849/mo this rent would consume 49% of the median local household income ($95k/yr) (locally 1429% of renters already pay >50% of income on rent) — very limited rent-growth headroom before tenants either downsize or default.
Forward outlook
- Local home prices are declining (-3.0%/yr); year-one equity from $2k of loan paydown is wiped out by about $11k of value loss. Plan a longer hold.
- Palm Beach County population projected at +30% by 2050 — long-run rental-demand tailwind backs the buy-and-hold thesis.
Negotiation context
- It's been on market 78 days — a 6% lower offer ($334k) is reasonable based on typical stale-listing flexibility.
- 6 sale attempts since 4y ago; this cycle's ask is 12579% above the opening price — seller raised mid-cycle; expect resistance to lowballs.
Risks & watch-outs
- Climate carrying-cost: severe wind risk, 99% chance of damaging wind over 30y; extreme-heat days projected 7→24/yr by 2055 (HVAC capex compounding) — expect insurance premiums to compound above CPI over the hold.
Questions for the listing agent
- It's been on market 78 days. Have you received any prior offers? Is the seller open to a 6% concession, seller financing, or rate buy-down credit?
- Built in 1977 — when were the roof, HVAC, electrical panel, plumbing, and water heater last replaced?
- What does the HOA fee cover, when was the last increase, and are there any pending special assessments or reserve-fund shortfalls?
- Why hasn't it sold? Are there any deal-killer items the seller is aware of (foundation, flood, title, zoning, code violations)?
- Is there a deadline driving the sale (1031 exchange, divorce, estate, relocation)? That informs how much negotiation room exists.
- Schools are B-rated — typically a magnet for longer-tenancy family renters. What's the average tenant stay here, and is there a school-zone premium baked into asking?
- What's the average days-on-market for RENTAL listings here right now (not sales)? A rising rental-DOM trend means longer vacancies and softer asking-rent achievability than the comps imply.
- What's the recent tenant-quality profile in this submarket — average credit score on applications, eviction rate, late-payment / NSF rate, and stable-employment percentage? A property-management company in the area should have these aggregated.
- How much new for-sale + rental construction is in the pipeline within 1–3 miles? Heavy new supply typically softens prices + rents 12–24 months out; constrained supply supports both.
Investment metrics
- 1% rule
- 1.08% ✓
- Cap rate
- 7.55%
- Cash-on-cash
- 4.49%
- DSCR
- 1.20
- GRM
- 7.7
CMA / ARV
No comps found within radius.
Projected returns pro-forma
-3.0% appreciation · 2.49% rent growth · sell at horizon
- IRR
- -9.9%
- Equity multiple
- 0.64×
- Total profit
- $-35,610
- Equity at exit
- $52,932
- IRR
- -1.2%
- Equity multiple
- 0.92×
- Total profit
- $-7,711
- Equity at exit
- $30,694
Cash invested: $99,400 (down + closing). Projections, not guarantees.
Landlord ↔ Tenant lean methodology
- Overall (STATE)
- 87 Strongly Landlord-Friendly
- State Florida
- 87 Strongly Landlord-Friendly · R+3
- County
- — inherits STATE
- City
- — inherits STATE
ZIP-level market 33410
- Rents YoY
- 2.5%
- Active inventory
- 303
- Price-to-rent
- 7.7×
Monthly cashflow live
- Estimated rent
- $3,849 high interval (Pro) →
- Mortgage (P&I)
- −$1,862
- Tax from tax record
- −$420 /mo · $5,039/yr
- Insurance
- −$148
- HOA
- −$239
- Vacancy / Maint / Mgmt
- −$808
- Net cashflow
- $372
Break-even live
UW: 25.0% down · 7.5% · 30yr · 1.5% tax · 5.0% vac · 8.0% maint · 8.0% mgmt
Financing live
Cash to close
- Down payment
- $88,750
- Closing costs
- $10,650
- Reserves months
- —
- Total cash needed
- —
Loan-product check · same deal, 3 products live
Conventional
25% down · 7.5% · 30yr
- Down + closing
- —
- Monthly P&I
- —
- Monthly cashflow
- —
- DSCR
- —
- Eligible?
- —
Personal DTI + credit; lowest rate.
DSCR
20% down · 8.5% · 30yr
- Down + closing
- —
- Monthly P&I
- —
- Monthly cashflow
- —
- DSCR
- —
- Eligible?
- —
No personal income docs; deal must DSCR.
Hard money
10% down · 12.0% · 12mo
- Down + closing
- —
- Monthly P&I
- —
- Monthly cashflow
- —
- DSCR
- —
- Eligible?
- —
Short-term bridge; refi at stabilization.
Rent comps 23 comps
| Address | Beds | Baths | Sqft | Rent | $/sqft | DOM | Units | Dist |
|---|---|---|---|---|---|---|---|---|
| 2750 Rio Vista Blvd Palm Beach Gardens, FL | 1.0–2.0 | 1.0–2.0 | 925 | $2,999 | $3.24 | 3d | 27 | 0.41mi |
| 2539 Wabash Dr West Palm Beach, FL | 3.0 | 2.5 | 1468 | $5,500 | $3.75 | 24d | 1 | 0.61mi |
| 10201 Chapman Oak Ct Palm Beach Gardens, FL | 2.0 | 2.0 | 1152 | $4,000 | $3.47 | 24d | 1 | 0.61mi |
| 7102 Geminata Oak Ct Unit 7102 Palm Beach Gardens, FL | 2.0 | 2.0 | 1152 | $3,200 | $2.78 | 7d | 1 | 0.68mi |
| 908 Lighthouse Dr North Palm Beach, FL | 3.0 | 2.0 | 1478 | $4,250 | $2.88 | 24d | 1 | 0.73mi |
| 913 Lighthouse Dr North Palm Beach, FL | 3.0 | 2.5 | 1092 | $5,900 | $5.40 | 24d | 1 | 0.76mi |
| 3660 RCA Blvd Palm Beach Gardens, FL | 1.0–2.0 | 1.0–2.0 | 1524 | $6,849 | $4.49 | 1d | 30 | 0.84mi |
| 11011 Legacy Dr #306 Palm Beach Gardens, FL | 2.0 | 2.0 | 1403 | $4,350 | $3.10 | 24d | 1 | 0.86mi |
| 700 Sanctuary Cove Dr West Palm Beach, FL | 1.0–3.0 | 1.0–2.0 | 1120 | $2,602 | $2.32 | 1d | 55 | 0.88mi |
| 11024 Legacy Dr #104 Palm Beach Gardens, FL | 2.0 | 2.0 | 1345 | $6,000 | $4.46 | 24d | 1 | 0.96mi |
| 11028 Legacy Dr #203 Palm Beach Gardens, FL | 2.0 | 2.0 | 1309 | $4,000 | $3.06 | 24d | 1 | 0.98mi |
| 11023 Legacy Ln #204 Palm Beach Gardens, FL | 2.0 | 2.0 | 1309 | $3,500 | $2.67 | 24d | 1 | 1.01mi |
| 11021 Legacy Ln #303 Palm Beach Gardens, FL | 2.0 | 2.0 | 1403 | $2,950 | $2.10 | 24d | 1 | 1.04mi |
| 2545 Conroy Dr West Palm Beach, FL | 3.0 | 2.0 | 1066 | $3,295 | $3.09 | 24d | 1 | 1.20mi |
| 9446 Birmingham Dr Palm Beach Gardens, FL | 3.0 | 2.0 | 1092 | $3,250 | $2.98 | 5d | 1 | 1.26mi |
| 2396 Easy St Unit A Palm Beach Gardens, FL | 2.0 | 1.0 | 948 | $3,500 | $3.69 | 24d | 1 | 1.26mi |
| 3955 Design Center Dr Palm Beach Gardens, FL | 3.0 | 1.0–2.0 | 996 | $3,514 | $3.53 | 2d | 25 | 1.27mi |
| 4120 Union Square Blvd Palm Beach Gardens, FL | 1.0–3.0 | 1.0–2.0 | 1035 | $2,632 | $2.54 | 1d | 92 | 1.33mi |
| 9507 Bellewood St Palm Beach Gardens, FL | 3.0 | 2.0 | 1200 | $5,000 | $4.17 | 19d | 1 | 1.37mi |
| 4295 Crestdale St Palm Beach Gardens, FL | 3.0 | 2.0 | 1366 | $4,500 | $3.29 | 24d | 1 | 1.46mi |
| 624 Southwind Cir #2 North Palm Beach, FL | 2.0 | 2.0 | 718 | $3,750 | $5.22 | 24d | 1 | 1.50mi |
| 624 Southwind Cir Apt 4 North Palm Beach, FL | 3.0 | 2.0 | 1134 | $4,750 | $4.19 | 24d | 1 | 1.50mi |
| 624 Southwind Cir Unit 3 North Palm Beach, FL | 3.0 | 3.0 | 1316 | $5,500 | $4.18 | 24d | 1 | 1.50mi |
HOA detail
- Monthly dues
- $239 · $2,868/yr
Listing history 36 events
-
2026-06-18days on market $355,000 Active 78 DOM
-
2026-06-17days on market $355,000 Active 77 DOM
-
2026-06-16days on market $355,000 Active 76 DOM
-
2026-06-15days on market $355,000 Active 75 DOM
-
2026-06-13pricedays on market $355,000 Active 73 DOM
-
2026-06-09days on market $359,000 Active 69 DOM
-
2026-06-08days on market $359,000 Active 68 DOM
-
2026-06-07days on market $359,000 Active 67 DOM
-
2026-06-04days on market $359,000 Active 64 DOM
-
2026-06-03days on market $359,000 Active 63 DOM
-
2026-06-02days on market $359,000 Active 62 DOM
-
2026-06-01days on market $359,000 Active 61 DOM
-
2026-05-31days on market $359,000 Active 60 DOM
-
2026-05-24historical $2,800
-
2026-05-22$2,800
-
2026-05-22historical $2,800
-
2026-05-19$2,800
-
2026-05-18historical $2,800
-
2026-05-18price $359,000
-
2026-04-29price $2,800
-
2026-04-29status Active
-
2026-04-28price $369,000
-
2026-04-21price $2,850
-
2026-04-19historical
-
2026-04-09$3,000
-
2026-03-23$399,993 Active
-
2023-02-10soldstatus $310,000
-
2023-02-08soldstatus $310,000 Closed 288-char remark
Show marketing remark (288 chars)
Sandalwood Palm Beach Gardens townhouse with brand new roof. Wooden fence recently replaced! Kitchen has granite counter tops and stainless steel appliances. Great location with easy access to the beach, Gardens Mall, Downtown at the Gardens and restaurants. Park located in neighborhood.
-
2023-01-24status Pending 288-char remark
Show marketing remark (288 chars)
Sandalwood Palm Beach Gardens townhouse with brand new roof. Wooden fence recently replaced! Kitchen has granite counter tops and stainless steel appliances. Great location with easy access to the beach, Gardens Mall, Downtown at the Gardens and restaurants. Park located in neighborhood.
-
2022-12-10historical Active Under Contract 288-char remark
Show marketing remark (288 chars)
Sandalwood Palm Beach Gardens townhouse with brand new roof. Wooden fence recently replaced! Kitchen has granite counter tops and stainless steel appliances. Great location with easy access to the beach, Gardens Mall, Downtown at the Gardens and restaurants. Park located in neighborhood.
-
2022-11-27$320,000 Active 288-char remark
Show marketing remark (288 chars)
Sandalwood Palm Beach Gardens townhouse with brand new roof. Wooden fence recently replaced! Kitchen has granite counter tops and stainless steel appliances. Great location with easy access to the beach, Gardens Mall, Downtown at the Gardens and restaurants. Park located in neighborhood.
-
2018-06-13soldstatus $214,900
-
2017-10-23soldstatus $150,000
-
2002-11-20soldstatus $112,000
-
1997-09-19soldstatus $64,000
-
1994-06-10soldstatus $63,000
ⓘ Source: listings_history table (triggers on properties + properties_extension) + one-shot
backfill from property_details.listing_events for pre-trigger history.
Tax reassessment forecast FL · Resets to sale price
- Current annual tax
- $5,039 · $420/mo
- Projected year-2 tax
- $5,039 · $420/mo
- Expected delta
- $0/yr ($0/mo · 0.0%)
ⓘ Screening estimate from a state-policy table — verify with the county assessor before closing.
Climate risk First Street
- Flood 1/10 Low FEMA zone X (unshaded) · 0% chance over 30 yrs
- Wildfire 1/10 Low
- Heat 10/10 Extreme 7 d/yr ≥106°F today · 24 d/yr by 30 yrs out
- Wind 10/10 Extreme 99% chance of damaging wind over 30 yrs
- Air quality 2/10 Low 0 unhealthy d/yr today · 1 by 30 yrs out
Nearby sold comps map
Loading sold comps map…
Walkable amenities ~0.75 mi
Loading nearby amenities…
Taxation est. · year 1
- Rental income
- $46,184
- − Mortgage interest
- −$19,886
- − Property taxes
- −$5,039
- − Insurance
- −$1,775
- − Repairs & maintenance
- −$3,695
- − Management
- −$3,695
- − HOA
- −$2,868
- − Depreciation
- −$10,327
- Taxable loss
- −$1,100
- Est. tax savings @ 24.0%
- +$264
- After-tax cash flow
- $4,728/yr
For passive investors: Depreciation is non-cash, so a rental often shows a tax loss while cash-flowing — sheltering income. Rental losses are passive: they offset passive income freely, and up to $25,000/yr can offset ordinary (W-2) income if you actively participate and your MAGI is under $100k (phasing out to $0 by $150k); unused losses carry forward. On sale, claimed depreciation is recaptured at up to 25%, and gains may owe capital-gains tax (a 1031 exchange can defer both). Figures are a year-1 estimate at your 24.0% rate — not tax advice; consult a CPA.
Schools (NCES district)
- District
- Palm Beach
- NCES district ID
- 1201500
- Math proficiency
- 46% ▼ -16.00%
- Reading proficiency
- 53% ▼ -4.00%
- Median HH income
- $53,943
- Composite
- 42.72/100
- National rank
- #3160
- State rank
- #34 of 73 in FL
Livability — Palm Beach Gardens
- Score
- 69/100
- State rank
- #464
- US rank
- #8366
Category grades
Schools grade is shown separately in the Schools card above.
Census & demographics
- Census place
- Palm Beach Gardens, FL
- County
- Palm Beach County · 1,438,312 people
- City population
- 96,294
- Metro
- Miami-Fort Lauderdale-Pompano Beach, FL
- Population (ZIP)
- 36,759
- Household income
- $94,530
- Rent vs Own
- Severe rent burden
- 1429.0
Population outlook (Palm Beach County) Hauer SSP2
- Today (2025)
- 1,637,487 people
- By 2030
- 1,743,255 · +6.5%
- By 2040
- 1,948,712 · +19.0%
- By 2050
- 2,132,979 · +30.3%
- By 2075
- 2,530,027 · +54.5%
- By 2100
- 2,706,979 · +65.3%
Race, ethnicity, and origin ACS 2023
- Neighborhood character
- Predominantly White (70%)
- Race & ethnicity
- White 70% Hispanic / Latino 15% Two or more races 13% Black 5% Asian 4%
- Hispanic origin (detail)
- Mexican 2% Puerto Rican 2% Cuban 3%
- Common ancestry
- Romanian 4% Lithuanian 3% Slovak 2%
- Foreign-born
- 17% · Canada, Jamaica, Vietnam
- Languages at home
- 78% English-only · Spanish 13% French/Haitian/Cajun 3% Other Indo-European 2%
Political lean MEDSL · Palm Beach
- 2024 margin
- Toss-up / Even · D 50.0% · R 49.2%
- 2008→2024 swing
- -22.1pp toward R · 2008: 22.9pp · 2024: 0.8pp
- All cycles
- 2024: D+0.8 2020: D+12.8 2016: D+15.3 2012: D+17.0 2008: D+22.9
Not yet ingested
- Civics
- —
Market trends
- HPI YoY
- ▼ -346.12%
- Current HPI
- 375.5381
- Rent YoY
- ▲ 2.49%
- Metro
- Miami-Fort Lauderdale-Pompano Beach, FL
- State GDP YoY
- ▲ 3.28%
- F500 in state
- 36
Industry mix (Fortune 500 HQ in FL)
| Industry | F500 HQs | Revenue |
|---|---|---|
| Industrial Technology | 2 | $29B |
|
||
| Insurance | 2 | $17B |
|
||
| Retail | 1 | $60B |
|
||
| Technology Distribution | 1 | $58B |
|
||
| Homebuilding | 1 | $35B |
|
||
| Technology Manufacturing | 1 | $35B |
|
||
Price history
-95.6% since first listed23 events — show timeline
- 2026-05-24 Rental Removed $2,800 TURBOTENANT
- 2026-05-22 Listed for Rent $2,800 TURBOTENANT
- 2026-05-22 Rental Removed $2,800 ZUMPER1
- 2026-05-19 Listed for Rent $2,800 ZUMPER1
- 2026-05-18 Rental Removed $2,800 GFLMLS
- 2026-05-18 Price Changed $359,000 Beaches MLS
- 2026-04-29 Price Changed $2,800 GFLMLS
- 2026-04-29 Relisted — Beaches MLS
- 2026-04-28 Price Changed $369,000 Beaches MLS
- 2026-04-21 Price Changed $2,850 GFLMLS
- 2026-04-19 Listing Removed — Beaches MLS
- 2026-04-09 Listed for Rent $3,000 GFLMLS
- 2026-03-23 Listed $399,993 Beaches MLS
- 2023-02-10 Sold (Public Records) $310,000 Public Records
- 2023-02-08 Sold (MLS) $310,000 Beaches MLS
- 2023-01-24 Pending — Beaches MLS
- 2022-12-10 Contingent — Beaches MLS
- 2022-11-27 Listed $320,000 Beaches MLS
- 2018-06-13 Sold (Public Records) $214,900 Public Records
- 2017-10-23 Sold (Public Records) $150,000 Public Records
- 2002-11-20 Sold (Public Records) $112,000 Public Records
- 1997-09-19 Sold (Public Records) $64,000 Public Records
- 1994-06-10 Sold (Public Records) $63,000 Public Records
Property tax history
+12.5%/yrLatest (2025): $5,039 · +3.8% YoY. Source: county tax records.
Cash-flow waterfall
monthlySold comps — $/sqft
last 12 mo · ≤1 miLoading sold comps…