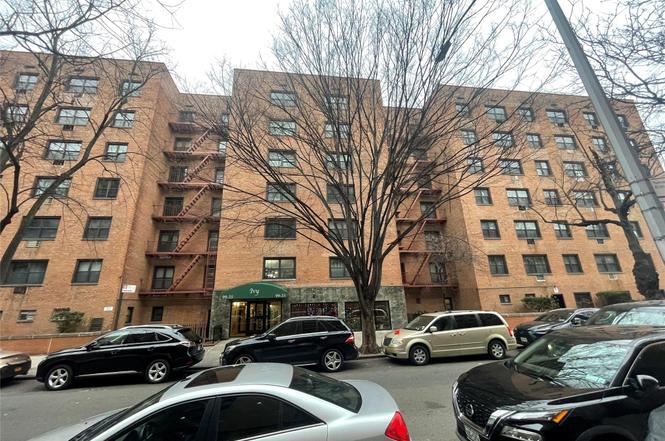
99-35 59 Ave Unit 5E · New York, NY
Flood risk 8/10 · Major
- FEMA flood zone
- X (unshaded)
- Chance of flooding over 30 yrs
- 0.78%
- Est. flood insurance / yr
- $507 – $1,088
Fire risk 1/10 · Minimal
- Est. fire insurance / yr
- $691 – $1,283
Heat risk 6/10 · Moderate
- Hot days now (above 99°F)
- 7 days/yr
- Hot days in 30 yrs
- 15 days/yr
Wind risk 6/10 · Moderate
- Chance of severe wind over 30 yrs
- 27.0%
Air-quality risk 5/10 · Moderate
- Unhealthy air days now
- 6 days/yr
- Unhealthy air days in 30 yrs
- 8 days/yr
Risk factors via First Street. Map © Google.
Why this score? — see what drove the C- grade
The composite is a weighted blend of 9 inputs, each scored 0–100. Each bar is that input's sub-score; the figure is the points it added to the 100-point composite (weight × sub-score).
- Cash flow +14.1/30.0
- Appreciation +8.7/10.0
- ARV discount +7.5/15.0
- Schools +5.0/10.0
- DSCR +4.3/10.0
- 1% rule +3.9/10.0
- Livability +3.8/5.0
- Rent growth +2.5/5.0
- Condition / age +2.5/5.0
$328,000
🖨 Deal sheet 📄 Offer letter ✓ Due diligence
Listing remarks
This move in condition and large junior four apartment has two good sized bedrooms. Eat in kitchen, living room and a full bath. Resident enjoy convenient building amenities, including elevators, on-site laundry, an outdoor sitting area and a live in superintendent. Easy access to public and private transportation, including major bus lines( Q23, Q58. Q59 Q60,Q72, Q88, QM10. QM11, QM2amd QM18) M & R subway lines, and closed Proximity to LaGuardia Airport and major highways 278 , 495 and Grand Central. Closed to supermarkets, Costco, shopping centers and recreational beauty of Flushing Meadows Corona Park.
Key facts
- Eat in kitchen
- Outdoor sitting area
- 75 garage spots
Tags
Property features AI
Finance
- HOA & community: Association managed by Kaled Management Corp
Exterior
- Parking: Garage; Parking lot; Waitlist for parking; 75 garage spaces (building total); 132 total parking spaces; Paid parking fee
- Security: Key card entry
- Utilities: Con Edison electric; Public sewer; Cable connected; Electricity connected; Natural gas connected; Sewer connected; Public trash collection; Water connected
- Home design: Stock cooperative; 7-story building; Entry level: 1
- Construction: Brick construction
- Exterior features: Brick construction; Not waterfront
Interior
- Kitchen: Gas oven; Gas range; Refrigerator; Exhaust fan
- Bedrooms: 5 total rooms (includes bedrooms and living areas)
- Flooring: Hardwood flooring
- Bathrooms: 1 full bathroom
- Heating & cooling: Baseboard heating; Wall/window air conditioning units
- Interior features: Eat-in kitchen; Elevator; Granite counters; Walk-in closet(s); Aluminum-frame windows; Pets allowed; Common finished full basement with walk-out access
- Laundry & utility: Laundry room
Neighborhood map
What this means for you Summary
Snapshot
- This is a 2-bed/1.0-bath condo listed at $328k.
Deal economics
- At list price, monthly cash flow is $-16 ($-187/yr) — negative.
- To cash-flow at today's rent, offer at most $326k (0.7% below list).
- To meet the 1% rule (rent ≥ 1% of price), the offer needs to be $293k (10.6% below list).
- Recommended offer: $289k (12.0% below list) — sets the bar for market timing.
- Cap rate 6.5% vs local median 2.6% in New York — top-decile yield for the area; either an underpriced asset or a hidden risk that comps aren't pricing in. Stress-test before assuming the spread holds.
Location & tenants
- Location reads 75/100 on livability (#268 in NY, #4,188 nationally) — a middle-class / working-renter tenant base. Strengths: amenities A+, commute A+, health & safety A; Watch: crime F, cost of living F.
- Market conditions: 243 active listings in the ZIP; 40 comparable units currently listed for rent nearby; rentals at typical pace (median 19d on market — plan ~3-4 weeks tenant-placement turnaround); 5,302 units permitted in Queens County in 2024 (4,918 in 5+ unit buildings).
- At $2,934/mo this rent would consume 49% of the median local household income ($72k/yr) (locally 6817% of renters already pay >50% of income on rent) — very limited rent-growth headroom before tenants either downsize or default.
Forward outlook
- In year one you build about $27k of equity ($2k loan paydown + $24k appreciation (7.4% local appreciation)).
- Queens County population projected at +16% by 2050 — long-run rental-demand tailwind backs the buy-and-hold thesis.
- At projected returns (7.4% appreciation + 3.0% rent growth), your $92k cash investment doubles in ~4 years — after that, you're playing with house money.
- By year 2, paydown + projected appreciation supports a ~$42k cash-out refi (75% LTV) — recoverable capital for the next deal without selling this one.
Negotiation context
- It's been on market 173 days — a 12% lower offer ($289k) is reasonable based on typical stale-listing flexibility.
- 2 sale attempts since 8y ago with the ask held roughly flat each time — persistent listings suggest the price (not the market) is what's stuck; bring a comps-based counter.
Risks & watch-outs
- Watch-outs: flood insurance adds $66/mo.
- Climate carrying-cost: severe flood risk; major wind risk, 27% chance of damaging wind over 30y; extreme-heat days projected 7→15/yr by 2055 (HVAC capex compounding) — expect insurance premiums to compound above CPI over the hold.
Questions for the listing agent
- What do current leases actually rent for vs. the listed asking? Can we see a recent rent roll and the last 12 months of T-12 income?
- It's been on market 173 days. Have you received any prior offers? Is the seller open to a 12% concession, seller financing, or rate buy-down credit?
- Built in 1962 — when were the roof, HVAC, electrical panel, plumbing, and water heater last replaced?
- What's the actual annual flood-insurance premium (NFIP or private), and is the property in a SFHA with mandatory coverage?
- Any open or pending special assessments — roof, HVAC, plumbing, elevator, façade? What's the per-unit balance and payoff schedule, and is the seller paying it off at close or rolling it to the buyer?
- Why hasn't it sold? Are there any deal-killer items the seller is aware of (foundation, flood, title, zoning, code violations)?
- Is there a deadline driving the sale (1031 exchange, divorce, estate, relocation)? That informs how much negotiation room exists.
- Schools are B-rated — typically a magnet for longer-tenancy family renters. What's the average tenant stay here, and is there a school-zone premium baked into asking?
- Crime grade is F in this area — have there been break-ins, vandalism, or insurance claims at this property in the last 3 years? What carrier currently insures it and at what premium?
- What's the average days-on-market for RENTAL listings here right now (not sales)? A rising rental-DOM trend means longer vacancies and softer asking-rent achievability than the comps imply.
- What's the recent tenant-quality profile in this submarket — average credit score on applications, eviction rate, late-payment / NSF rate, and stable-employment percentage? A property-management company in the area should have these aggregated.
- How much new apartment / multifamily construction is in the pipeline within 1–3 miles? Heavy new supply (>2% of stock underway) typically softens rents 12–24 months out; light construction supports rent growth.
Investment metrics
- 1% rule
- 0.89% ✗
- Cap rate
- 6.48%
- Cash-on-cash
- 0.66%
- DSCR
- 1.03
- GRM
- 9.3
CMA / ARV
No comps found within radius.
Projected returns pro-forma
7.4% appreciation · 3.0% rent growth · sell at horizon
- IRR
- 18.5%
- Equity multiple
- 2.33×
- Total profit
- $121,729
- Equity at exit
- $235,915
- IRR
- 17.6%
- Equity multiple
- 4.86×
- Total profit
- $354,127
- Equity at exit
- $456,166
Cash invested: $91,840 (down + closing). Projections, not guarantees.
Landlord ↔ Tenant lean methodology
- Overall (CITY)
- 0 Strongly Tenant-Friendly
- State New York
- 15 Strongly Tenant-Friendly · D+10
- County
- — inherits STATE
- City New York
- 0 Strongly Tenant-Friendly · D+34
ZIP-level market 11368
- Home prices YoY
- 2.7%
- Active inventory
- 243
- Price-to-rent
- 9.3×
Monthly cashflow live
- Estimated rent
- $2,934 high interval (Pro) →
- Mortgage (P&I)
- −$1,720
- Tax est. 1.5%
- −$410 /mo · $4,920/yr
- Insurance
- −$137
- Flood insurance flood zone
- −$66 /mo · $798/yr
- HOA
- −$0
- Vacancy / Maint / Mgmt
- −$616
- Net cashflow
- $-16
Break-even live
UW: 25.0% down · 7.5% · 30yr · 1.5% tax · 5.0% vac · 8.0% maint · 8.0% mgmt
Financing live
Cash to close
- Down payment
- $82,000
- Closing costs
- $9,840
- Reserves months
- —
- Total cash needed
- —
Loan-product check · same deal, 3 products live
Conventional
25% down · 7.5% · 30yr
- Down + closing
- —
- Monthly P&I
- —
- Monthly cashflow
- —
- DSCR
- —
- Eligible?
- —
Personal DTI + credit; lowest rate.
DSCR
20% down · 8.5% · 30yr
- Down + closing
- —
- Monthly P&I
- —
- Monthly cashflow
- —
- DSCR
- —
- Eligible?
- —
No personal income docs; deal must DSCR.
Hard money
10% down · 12.0% · 12mo
- Down + closing
- —
- Monthly P&I
- —
- Monthly cashflow
- —
- DSCR
- —
- Eligible?
- —
Short-term bridge; refi at stabilization.
Rent comps 40 comps
| Address | Beds | Baths | Sqft | Rent | $/sqft | DOM | Units | Dist |
|---|---|---|---|---|---|---|---|---|
| 102-45 62nd Rd Unit 7J Forest Hills, NY | 1.0 | 1.0 | 770 | $2,950 | $3.83 | 24d | 1 | 0.25mi |
| 6155 98th St Unit 8B Rego Park, NY | 1.0 | 1.0 | 700 | $2,500 | $3.57 | 4d | 1 | 0.26mi |
| 6145 98th St Rego Park, NY | 1.0–3.0 | 1.0 | 825 | $2,775 | $3.36 | 2d | 3 | 0.29mi |
| 6145 98th St Rego Park, NY | 1.0–3.0 | 1.0 | 825 | $2,850 | $3.45 | 24d | 3 | 0.29mi |
| 102-06 63rd Ave #2 Queens, NY | 2.0 | 1.0 | 1000 | $3,000 | $3.00 | 24d | 1 | 0.35mi |
| 54-01 108th St Unit 2R Flushing, NY | 2.0 | 1.0 | 1000 | $3,050 | $3.05 | 24d | 1 | 0.35mi |
| 9710 62nd Dr Unit 9F Rego Park, NY | 1.0 | 1.0 | 750 | $2,700 | $3.60 | 4d | 1 | 0.41mi |
| 6336 99th St Unit 5E Rego Park, NY | 2.0 | 2.5 | 1333 | $4,600 | $3.45 | 4d | 1 | 0.42mi |
| 94-30 60th Ave Apt 1H Queens, NY | 3.0 | 1.5 | 1200 | $3,200 | $2.67 | 24d | 1 | 0.45mi |
| 9707 63rd Rd Unit 15B Rego Park, NY | 1.0 | 1.0 | 700 | $2,300 | $3.29 | 2d | 1 | 0.46mi |
| 9941 64th Ave Rego Park, NY | 1.0–2.0 | 1.0 | 975 | $3,200 | $3.28 | 19d | 2 | 0.48mi |
| 4911 108th St Unit 4A Corona, NY | 3.0 | 2.0 | 1027 | $3,600 | $3.51 | 17d | 1 | 0.50mi |
| 9810 64th Ave Rego Park, NY | 1.0 | 1.0 | 825 | $2,125 | $2.58 | 17d | 2 | 0.53mi |
| 9810 64th Ave Unit 3A Rego Park, NY | 1.0 | 1.0 | 850 | $2,450 | $2.88 | 2d | 1 | 0.53mi |
| 6405 Yellowstone Blvd Flushing, NY | 1.0 | 1.0–1.5 | 920 | $3,075 | $3.34 | 24d | 2 | 0.53mi |
| 6405 Yellowstone Blvd Unit 403S Forest Hills, NY | 1.0 | 1.0 | 720 | $3,100 | $4.31 | 24d | 1 | 0.53mi |
| 9825 64th Rd Unit 8F Rego Park, NY | 2.0 | 1.0 | 850 | $2,400 | $2.82 | 1d | 1 | 0.55mi |
| 9725 64th Ave Rego Park, NY | 1.0 | 1.0 | 760 | $1,800 | $2.37 | 19d | 1 | 0.55mi |
| 61-20 Grand Central Pkwy Unit Bb706 Forest Hills, NY | 2.0 | 1.0 | 970 | $2,850 | $2.94 | 19d | 1 | 0.56mi |
| 10869 50th Ave Corona, NY | 3.0 | 1.0 | 912 | $3,300 | $3.62 | 24d | 1 | 0.57mi |
| 10525 65th Ave Unit 4F Forest Hills, NY | 2.0 | 1.0 | 980 | $3,998 | $4.08 | 15d | 1 | 0.61mi |
| 10523 65th Rd Forest Hills, NY | 2.0 | 2.0 | 760 | $3,200 | $4.21 | 24d | 1 | 0.65mi |
| 61-20 Grand Central Pkwy Unit A 106 Forest Hills, NY | 2.0 | 2.0 | 1300 | $3,100 | $2.38 | 19d | 1 | 0.67mi |
| 102-39 66th Ave Unit 1 Flushing, NY | 2.0 | 1.0 | 981 | $3,000 | $3.06 | 1d | 1 | 0.68mi |
| 6347 Booth St Unit 3C Rego Park, NY | 1.0 | 1.0 | 700 | $3,400 | $4.86 | 24d | 1 | 0.69mi |
| 97-12 65th Rd Apt 5D Rego Park, NY | 1.0 | 1.0 | 800 | $3,395 | $4.24 | 5d | 1 | 0.70mi |
| 10533 66th Ave Unit 3F Forest Hills, NY | 1.0 | 1.0 | 775 | $2,200 | $2.84 | 4d | 1 | 0.71mi |
| 10302 42nd Ave Unit 4D Corona, NY | 2.0 | 1.5 | 761 | $3,400 | $4.47 | 19d | 1 | 0.71mi |
| 98-81 Queens Blvd Unit 14K Rego Park, NY | 2.0 | 2.0 | 950 | $4,490 | $4.73 | 12d | 1 | 0.71mi |
| 98-81 Queens Blvd Unit 15E Rego Park, NY | 1.0 | 1.0 | 700 | $3,335 | $4.76 | 5d | 1 | 0.71mi |
| 110-55 64th Rd Unit 25 Forest Hills, NY | 2.0 | 2.0 | 1300 | $3,400 | $2.62 | 7d | 1 | 0.71mi |
| 10530 66th Ave Unit 3F Forest Hills, NY | 1.0 | 1.0 | 800 | $2,200 | $2.75 | 24d | 1 | 0.74mi |
| 9876 Queens Blvd Unit 3A Rego Park, NY | 1.0 | 1.0 | 820 | $2,900 | $3.54 | 24d | 1 | 0.75mi |
| 10210 66th Rd Unit 17B Forest Hills, NY | 2.0 | 1.0 | 1175 | $3,350 | $2.85 | 4d | 1 | 0.76mi |
| 11105 66th Ave Unit 2B Forest Hills, NY | 1.0 | 1.0 | 850 | $2,600 | $3.06 | 15d | 1 | 0.77mi |
| 10025 Queens Blvd Unit 3M Forest Hills, NY | 2.0 | 1.0 | 925 | $2,900 | $3.14 | 24d | 1 | 0.80mi |
| 102-45 67th Rd Forest Hills, NY | 1.0 | 1.0 | 700 | $2,350 | $3.36 | 19d | 1 | 0.82mi |
| 105-25 67th Rd Forest Hills, NY | 1.0 | 1.0 | 750 | $1,800 | $2.40 | 19d | 1 | 0.84mi |
| 60-24 Wetherole St Unit 3rd Fl Elmhurst, NY | 3.0 | 2.0 | 1000 | $3,400 | $3.40 | 3d | 1 | 0.85mi |
| 6620 Wetherole St Rego Park, NY | 1.0–2.0 | 1.0–2.0 | 700 | $3,300 | $4.71 | 24d | 2 | 0.89mi |
HOA detail condo
- Monthly dues
- $0 · $0/yr
- Assessments
- None detected in remarks — confirm with the listing agent.
Listing history 16 events
-
2026-06-18days on market $328,000 Active 173 DOM
-
2026-06-17days on market $328,000 Active 172 DOM
-
2026-06-15days on market $328,000 Active 170 DOM
-
2026-06-13days on market $328,000 Active 168 DOM
-
2026-06-10days on market $328,000 Active 164 DOM
-
2026-06-08days on market $328,000 Active 163 DOM
-
2026-06-04days on market $328,000 Active 159 DOM
-
2026-06-03days on market $328,000 Active 158 DOM
-
2026-06-01days on market $328,000 Active 156 DOM
-
2026-05-31days on market $328,000 Active 155 DOM
-
2026-04-29price $328,000
-
2025-12-26$330,000 Active
-
2018-05-04historical
-
2018-04-18price $280,000
-
2018-04-17price $305,000
-
2018-03-12$320,000 New
ⓘ Source: listings_history table (triggers on properties + properties_extension) + one-shot
backfill from property_details.listing_events for pre-trigger history.
Climate risk First Street
- Flood 8/10 Severe FEMA zone X (unshaded) · 78% chance over 30 yrs
- Wildfire 1/10 Low
- Heat 6/10 Major 7 d/yr ≥99°F today · 15 d/yr by 30 yrs out
- Wind 6/10 Major 27% chance of damaging wind over 30 yrs
- Air quality 5/10 Major 6 unhealthy d/yr today · 8 by 30 yrs out
Nearby sold comps map
Loading sold comps map…
Walkable amenities ~0.75 mi
Loading nearby amenities…
Taxation est. · year 1
- Rental income
- $35,204
- − Mortgage interest
- −$18,373
- − Property taxes
- −$4,920
- − Insurance
- −$2,438
- − Repairs & maintenance
- −$2,816
- − Management
- −$2,816
- − Depreciation
- −$9,542
- Taxable loss
- −$5,701
- Est. tax savings @ 24.0%
- +$1,368
- After-tax cash flow
- $1,181/yr
For passive investors: Depreciation is non-cash, so a rental often shows a tax loss while cash-flowing — sheltering income. Rental losses are passive: they offset passive income freely, and up to $25,000/yr can offset ordinary (W-2) income if you actively participate and your MAGI is under $100k (phasing out to $0 by $150k); unused losses carry forward. On sale, claimed depreciation is recaptured at up to 25%, and gains may owe capital-gains tax (a 1031 exchange can defer both). Figures are a year-1 estimate at your 24.0% rate — not tax advice; consult a CPA.
Schools (NCES district)
No district data.
Livability — New York
- Score
- 75/100
- State rank
- #268
- US rank
- #4188
Category grades
Schools grade is shown separately in the Schools card above.
Census & demographics
- Census place
- New York, NY
- County
- Queens County · 1,914,869 people
- City population
- 7,731,280
- Metro
- New York-Newark-Jersey City, NY-NJ-PA
- Population (ZIP)
- 105,716
- Household income
- $72,270
- Rent vs Own
- Severe rent burden
- 6817.0
Population outlook (Queens County) Hauer SSP2
- Today (2025)
- 2,546,320 people
- By 2030
- 2,643,059 · +3.8%
- By 2040
- 2,815,563 · +10.6%
- By 2050
- 2,944,423 · +15.6%
- By 2075
- 3,123,338 · +22.7%
- By 2100
- 3,098,688 · +21.7%
Race, ethnicity, and origin ACS 2023
- Neighborhood character
- Predominantly Hispanic (75%)
- Race & ethnicity
- Hispanic / Latino 75% Two or more races 14% Asian 12% Black 8% White 4% Native American 1%
- Hispanic origin (detail)
- Mexican 20% Puerto Rican 2% Dominican 14%
- Foreign-born
- 60% · Canada, China, Jamaica
- Languages at home
- 15% English-only · Spanish 70% Chinese 6% Other Indo-European 3%
Political lean MEDSL · Queens
- 2024 margin
- Strong D (+24.6) · D 62.3% · R 37.7%
- 2008→2024 swing
- -26.2pp toward R · 2008: 50.8pp · 2024: 24.6pp
- All cycles
- 2024: D+24.6 2020: D+45.2 2016: D+53.4 2012: D+58.5 2008: D+50.8
Not yet ingested
- Civics
- —
Market trends
- HPI YoY
- ▲ 7.40%
- Current HPI
- 282.8276
- Rent YoY
- —
- Metro
- New York-Newark-Jersey City, NY-NJ-PA
- State GDP YoY
- ▲ 2.60%
- F500 in state
- 92
Industry mix (Fortune 500 HQ in NY)
| Industry | F500 HQs | Revenue |
|---|---|---|
| Financial Services | 10 | $950B |
|
||
| Consumer Goods | 9 | $162B |
|
||
| Insurance | 4 | $225B |
|
||
| Telecommunications | 2 | $144B |
|
||
| Pharmaceuticals | 2 | $112B |
|
||
| Media / Entertainment | 2 | $69B |
|
||
Price history
+2.5% since first listed6 events — show timeline
- 2026-04-29 Price Changed $328,000 OneKey® MLS as Distributed by MLS Grid
- 2025-12-26 Listed $330,000 OneKey® MLS as Distributed by MLS Grid
- 2018-05-04 Listing Removed — OneKey® MLS as Distributed by MLS Grid
- 2018-04-18 Price Changed $280,000 OneKey® MLS as Distributed by MLS Grid
- 2018-04-17 Price Changed $305,000 OneKey® MLS as Distributed by MLS Grid
- 2018-03-12 Listed $320,000 OneKey® MLS as Distributed by MLS Grid
Cash-flow waterfall
monthlySold comps — $/sqft
last 12 mo · ≤1 miLoading sold comps…