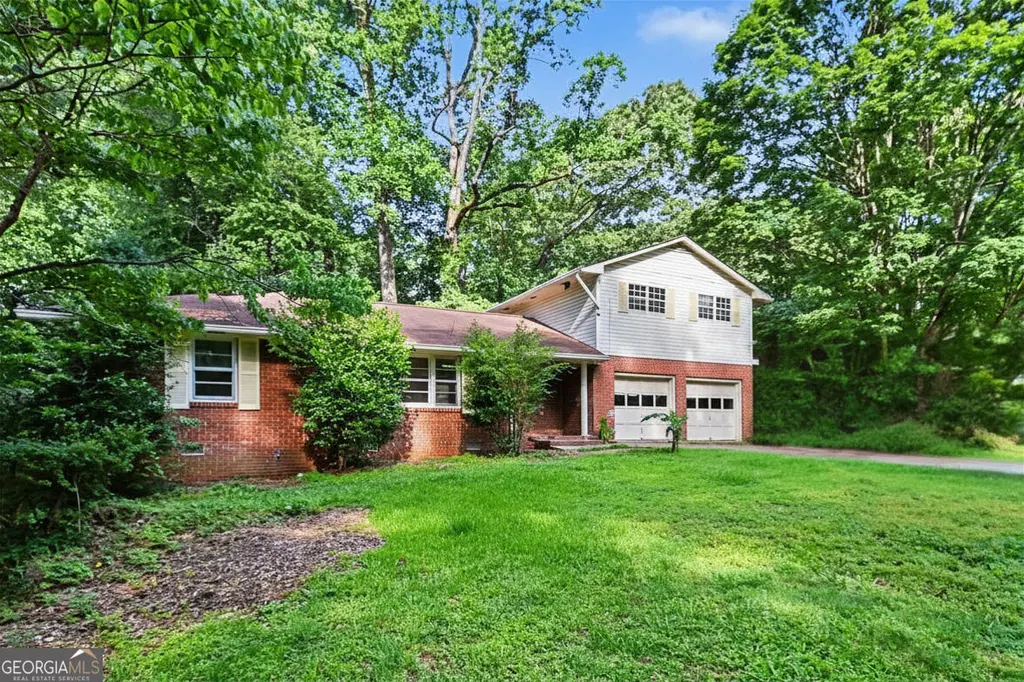
2240 Medfield Trl NE · Chamblee, GA
Flood risk 1/10 · Minimal
- FEMA flood zone
- X (unshaded)
- Chance of flooding over 30 yrs
- 0.0%
- Est. flood insurance / yr
- $507 – $1,088
Fire risk 3/10 · Minor
- Est. fire insurance / yr
- $963 – $1,789
Heat risk 5/10 · Moderate
- Hot days now (above 103°F)
- 7 days/yr
- Hot days in 30 yrs
- 17 days/yr
Wind risk 4/10 · Minor
- Chance of severe wind over 30 yrs
- 18.0%
Air-quality risk 5/10 · Moderate
- Unhealthy air days now
- 5 days/yr
- Unhealthy air days in 30 yrs
- 9 days/yr
Risk factors via First Street. Map © Google.
Why this score? — see what drove the C- grade
The composite is a weighted blend of 9 inputs, each scored 0–100. Each bar is that input's sub-score; the figure is the points it added to the 100-point composite (weight × sub-score).
- Cash flow +15.8/30.0
- ARV discount +15.0/15.0
- DSCR +4.9/10.0
- Livability +3.6/5.0
- 1% rule +3.3/10.0
- Rent growth +3.1/5.0
- Condition / age +2.5/5.0
- Schools +2.1/10.0
- Appreciation +0.0/10.0
$275,000
🖨 Deal sheet (PDF) 📄 Offer letter ✓ Due diligence
Listing remarks MLS
Opportunity is knocking with this investor special full of potential! Featuring 3 bedrooms, 2 bathrooms, an inviting floor-plan, and tons of natural light throughout, this home is ready for someone with vision to bring it back to life. Tucked away on a private, tree-lined lot with a spacious backyard, the setting alone makes this property worth a look. Yes, the home needs work... but with the right updates and personal touches, this could truly become something special. Whether you're an investor, flipper, or buyer looking to create your dream home, this is your chance to purchase well below market value and build instant equity. Opportunities like this don't come around often!
Key facts
- Spacious backyard
- 0.4 acre lot
- 2 garage spots
Tags
Property features AI
Exterior
- Parking: Attached garage (2 car); Two total parking spaces
- Utilities: Public water; Public sewer; Electricity available; Other utilities available
- Home design: Two levels
- Construction: Brick and other construction materials; Composition roof
- Exterior features: Private yard; Deck; Rear porch; Other exterior features
Interior
- Kitchen: Stained cabinets; Solid surface counters; Other kitchen features
- Bedrooms: Three main-level bedrooms
- Flooring: Carpet; Hardwood; Laminate
- Bathrooms: One full bathroom; One half bathroom (main level)
- Heating & cooling: Central heating; Central air conditioning
- Interior features: No common walls; Family room; Resale condition
- Laundry & utility: Laundry features available; Other appliances
Neighborhood map
What this means for you Summary
Snapshot
- This is a 3-bed/1.5-bath single-family listed at $275k.
Deal economics
- At list price, monthly cash flow is $125 ($1k/yr) — positive.
- The deal already cash-flows at list — no discount required.
- To meet the 1% rule (rent ≥ 1% of price), the offer needs to be $229k (16.7% below list).
- Recommended offer: $229k (16.7% below list) — sets the bar for 1% rule.
- Cap rate 6.8% vs local median 2.7% in Chamblee — top-decile yield for the area; either an underpriced asset or a hidden risk that comps aren't pricing in. Stress-test before assuming the spread holds.
Location & tenants
- Location reads 72/100 on livability (#62 in GA) — a middle-class / working-renter tenant base. Strengths: housing A+, employment A, commute A-; Watch: cost of living C-, crime F, amenities F.
- Dekalb County (suburban): math 19% / reading 28% proficiency, ranked #125 of 174 in GA (top 72%) — low school quality limits family demand, transient renter base, plan for 1-2y turnover; 68% free/reduced lunch — lower-income household profile, screen leases tightly.
- Zoned schools: Montclair Elementary School (math 3% / reading 5%, grade F, #1,202 of 1,228 statewide, top 98%, 654 students, 100% FRL); Sequoyah Middle School (math 8% / reading 16%, grade F, #417 of 470 statewide, top 90%, 1,763 students, 100% FRL); Cross Keys High School (reading 12%, 1,714 students, 73% FRL) — zoned schools average 91% FRL vs 68% district-wide (23 pts higher); higher-poverty schools than district average — tighter screening recommended.
- Zoned-school proficiency averages 8% at this address vs 24% district-wide (-16 pts) — the specific schools serving this property underperform the Dekalb County average; the district grade overstates school quality for this exact location.
- Market conditions: Rents rising (+2.3%/yr); 151 active listings in the ZIP; 40 comparable units currently listed for rent nearby; rentals at typical pace (median 15d on market — plan ~3-4 weeks tenant-placement turnaround); high-income renter base; 1,240 units permitted in DeKalb County in 2024 (385 in 5+ unit buildings).
Forward outlook
- Local home prices are declining (-3.0%/yr); year-one equity from $2k of loan paydown is wiped out by about $8k of value loss. Plan a longer hold.
- DeKalb County population projected at +28% by 2050 — long-run rental-demand tailwind backs the buy-and-hold thesis.
Negotiation context
- Only 3 days on market — expect competitive offers; lowballing is unlikely to land.
- 2 sale attempts with the ask held roughly flat each time — persistent listings suggest the price (not the market) is what's stuck; bring a comps-based counter.
Risks & watch-outs
- Watch-outs: built in 1956 — expect roof / HVAC / electrical / plumbing capex.
- Climate carrying-cost: extreme-heat days projected 7→17/yr by 2055 (HVAC capex compounding) — expect insurance premiums to compound above CPI over the hold.
Questions for the listing agent
- Built in 1956 — when were the roof, HVAC, electrical panel, plumbing, and water heater last replaced?
- Is there a deadline driving the sale (1031 exchange, divorce, estate, relocation)? That informs how much negotiation room exists.
- Schools are D-rated, which usually means shorter tenancies and higher turnover. Who's the typical renter profile here, and what's been the actual vacancy rate?
- Crime grade is F in this area — have there been break-ins, vandalism, or insurance claims at this property in the last 3 years? What carrier currently insures it and at what premium?
- What's the average days-on-market for RENTAL listings here right now (not sales)? A rising rental-DOM trend means longer vacancies and softer asking-rent achievability than the comps imply.
- What's the recent tenant-quality profile in this submarket — average credit score on applications, eviction rate, late-payment / NSF rate, and stable-employment percentage? A property-management company in the area should have these aggregated.
- How much new for-sale + rental construction is in the pipeline within 1–3 miles? Heavy new supply typically softens prices + rents 12–24 months out; constrained supply supports both.
Investment metrics
- 1% rule
- 0.83% ✗
- Cap rate
- 6.84%
- Cash-on-cash
- 1.95%
- DSCR
- 1.09
- GRM
- 10.0
CMA / ARV
- ARV (on-the-fly)
- $507,183
- Comps found
- 12
Show comp detail 12 sales within ~0.75 mi
| Address | Dist | Beds/Ba | Sqft | Sold | Price | $/sf | Match |
|---|---|---|---|---|---|---|---|
| 1955 Vance Dr NE | 0.15mi | 3/3.0 | 1,775 (+2%) | 3mo | $500,000 | $282 | 80 |
| 1962 Wellona Pl NE | 0.04mi | 3/1.5 | 1,554 (-10%) | 2mo | $455,000 | $293 | 79 |
| 2315 Tanglewood Cir NE | 0.28mi | 4/2.0 (+1) | 1,713 (-1%) | 4mo | $595,000 | $347 | 75 |
| 2072 Clairmont Ter NE | 0.33mi | 3/2.0 | 1,683 (-3%) | 6mo | $270,000 | $160 | 73 |
| 2226 Medfield Trl NE | 0.03mi | 3/1.5 | 1,512 (-13%) | 6mo | $305,000 | $202 | 73 |
| 2450 Wentworth Dr NE | 0.52mi | 3/2.0 | 1,750 (+1%) | 1mo | $400,000 | $229 | 71 |
| 2208 Medfield Trl NE | 0.08mi | 3/2.0 | 1,515 (-12%) | 3mo | $590,000 | $389 | 71 |
| 2099 Clairmont Ter NE | 0.28mi | 3/2.0 | 1,523 (-12%) | 4mo | $518,000 | $340 | 62 |
| 2002 Drew Valley Rd NE | 0.62mi | 3/3.0 | 1,775 (+2%) | 2mo | $575,000 | $324 | 59 |
| 1754 Wilmont Dr | 0.49mi | 3/2.0 | 1,538 (-11%) | 4mo | $560,000 | $364 | 53 |
| 2481 Rosecrest Pl NE | 0.59mi | 3/2.5 | 1,938 (+12%) | 3mo | $460,000 | $237 | 46 |
| 2255 Meadowvale Dr NE | 0.68mi | 4/3.0 (+1) | 1,835 (+6%) | 6mo | $465,000 | $253 | 42 |
Match score weights: distance 35% · size 25% · config 20% · recency 20%. Top-matched comps best support the ARV.
Projected returns pro-forma
-3.0% appreciation · 2.28% rent growth · sell at horizon
- IRR
- -14.0%
- Equity multiple
- 0.50×
- Total profit
- $-38,350
- Equity at exit
- $41,003
- IRR
- -6.3%
- Equity multiple
- 0.61×
- Total profit
- $-30,209
- Equity at exit
- $23,777
Cash invested: $77,000 (down + closing). Projections, not guarantees.
Landlord ↔ Tenant lean methodology
- Overall (STATE)
- 90 Strongly Landlord-Friendly
- State Georgia
- 90 Strongly Landlord-Friendly · R+3
- County
- — inherits STATE
- City
- — inherits STATE
ZIP-level market 30345
- Rents YoY
- 2.3%
- Active inventory
- 151
- Price-to-rent
- 10.0×
Monthly cashflow live
- Estimated rent
- $2,290 high interval (Pro) →
- Mortgage (P&I)
- −$1,442
- Tax from tax record
- −$128 /mo · $1,532/yr
- Insurance
- −$115
- HOA
- −$0
- Vacancy / Maint / Mgmt
- −$481
- Net cashflow
- $125
Break-even live
Sensitivity live
| Price | -10% $281 | -5% $203 | +0% $125 | +5% $47 | +10% $-31 |
|---|---|---|---|---|---|
| Rent | -10% $-56 | -5% $34 | +0% $125 | +5% $215 | +10% $306 |
| Rate | -1.0pp $263 | -0.5pp $195 | base $125 | +0.5pp $54 | +1.0pp $-19 |
UW: 25.0% down · 7.5% · 30yr · 1.5% tax · 5.0% vac · 8.0% maint · 8.0% mgmt
Financing live
Cash to close
- Down payment
- $68,750
- Closing costs
- $8,250
- Reserves months
- —
- Total cash needed
- —
Loan-product check · same deal, 3 products live
Conventional
25% down · 7.5% · 30yr
- Down + closing
- —
- Monthly P&I
- —
- Monthly cashflow
- —
- DSCR
- —
- Eligible?
- —
Personal DTI + credit; lowest rate.
DSCR
20% down · 8.5% · 30yr
- Down + closing
- —
- Monthly P&I
- —
- Monthly cashflow
- —
- DSCR
- —
- Eligible?
- —
No personal income docs; deal must DSCR.
Hard money
10% down · 12.0% · 12mo
- Down + closing
- —
- Monthly P&I
- —
- Monthly cashflow
- —
- DSCR
- —
- Eligible?
- —
Short-term bridge; refi at stabilization.
Rent comps 40 comps
| Address | Beds | Baths | Sqft | Rent | $/sqft | DOM | Units | Dist |
|---|---|---|---|---|---|---|---|---|
| 1984 McJenkin Dr NE Atlanta, GA | 3.0 | 2.5 | 1655 | $2,750 | $1.66 | 26d | 1 | 0.06mi |
| 2234 Clairmont Ter NE Atlanta, GA | 3.0 | 1.0 | 1056 | $2,200 | $2.08 | 45d | 1 | 0.20mi |
| 1740 Century Cir NE Atlanta, GA | 1.0–2.0 | 1.0–2.0 | 973 | $2,241 | $2.30 | 0d | 30 | 0.20mi |
| 2323 Tanglewood Cir NE Atlanta, GA | 3.0 | 2.0 | 1392 | $2,400 | $1.72 | 45d | 1 | 0.32mi |
| 1815 Hislop Ln #8 Atlanta, GA | 4.0 | 3.5 | 1600 | $3,200 | $2.00 | 26d | 1 | 0.38mi |
| 3180 Clairmont Rd NE Brookhaven, GA | 1.0–2.0 | 1.0–2.0 | 1040 | $1,773 | $1.70 | 3d | 13 | 0.45mi |
| 100 Windmont Dr NE Atlanta, GA | 1.0–2.0 | 1.0–2.0 | 880 | $1,800 | $2.05 | 1d | 15 | 0.46mi |
| 3078 Clairmont Rd NE Brookhaven, GA | 1.0–2.0 | 1.0–2.0 | 848 | $1,922 | $2.27 | 5d | 18 | 0.53mi |
| 2231 Allaire Ln NE Atlanta, GA | 3.0 | 2.0 | 1488 | $2,600 | $1.75 | 45d | 1 | 0.58mi |
| 2497 Wentworth Dr NE Atlanta, GA | 4.0 | 3.0 | 2003 | $2,995 | $1.50 | 0d | 1 | 0.59mi |
| 2924 Clairmont Rd Atlanta, GA | 1.0–2.0 | 1.0–2.0 | 1086 | $2,316 | $2.13 | 1d | 25 | 0.64mi |
| 3630 Buford Hwy NE Brookhaven, GA | 1.0–3.0 | 1.0–2.0 | 1275 | $2,112 | $1.66 | 3d | 2 | 0.73mi |
| 2910 Clairmont Rd Atlanta, GA | 1.0–2.0 | 1.0–2.0 | 1000 | $2,017 | $2.02 | 3d | 8 | 0.74mi |
| 3626 Buford Hwy NE Unit A3 Brookhaven, GA | 2.0 | 2.0 | 1117 | $1,600 | $1.43 | 26d | 1 | 0.75mi |
| 3547 Buford Hwy NE Brookhaven, GA | 1.0–3.0 | 1.0–2.0 | 1150 | $1,997 | $1.74 | 5d | 7 | 0.81mi |
| 2615 Oak Shadow Ln NE Atlanta, GA | 1.0–2.0 | 1.0–2.0 | 1125 | $1,964 | $1.75 | 3d | 10 | 0.88mi |
| 3070 Briarcliff Rd NE Atlanta, GA | 2.0 | 1.0–2.0 | 913 | $3,230 | $3.54 | 1d | 26 | 0.88mi |
| 3000 Briarcliff Rd NE Atlanta, GA | 1.0–3.0 | 1.0–2.0 | 1037 | $2,079 | $2.00 | 0d | 15 | 0.92mi |
| 1750 Briarwood Rd NE Brookhaven, GA | 2.0 | 2.0 | 1075 | $1,340 | $1.25 | 45d | 45 | 0.94mi |
| 2186 Hillview Dr NE Atlanta, GA | 3.0 | 2.5 | 2068 | $3,250 | $1.57 | 45d | 1 | 0.97mi |
| 3510 Buford Hwy Atlanta, GA | 1.0–3.0 | 1.0–2.0 | 1110 | $2,010 | $1.81 | 45d | 1 | 0.97mi |
| 2345 Peachwood Cir NE Atlanta, GA | 1.0–2.0 | 1.0–2.0 | 1039 | $2,042 | $1.96 | 3d | 29 | 0.99mi |
| 2160 Crestridge Trl NE Atlanta, GA | 3.0 | 2.5 | 2068 | $3,295 | $1.59 | 13d | 1 | 1.00mi |
| 1831 Briarcliff Cir Atlanta, GA | 2.0–3.0 | 2.0–2.5 | 1530 | $2,344 | $1.53 | 6d | 12 | 1.05mi |
| 1831 Briarcliff Cir Atlanta, GA | 3.0 | 2.0 | 1690 | $2,444 | $1.45 | 14d | 1 | 1.05mi |
| 2672 Warwick Cir NE Atlanta, GA | 3.0 | 2.0 | 1434 | $2,749 | $1.92 | 26d | 1 | 1.07mi |
| 2412 Peachwood Cir NE #3 Atlanta, GA | 2.0 | 1.5 | 1116 | $1,750 | $1.57 | 45d | 1 | 1.15mi |
| 2236 Plaster Rd NE Unit 2200D Atlanta, GA | 2.0 | 2.5 | 1250 | $1,779 | $1.42 | 26d | 1 | 1.19mi |
| 2236 Plaster Rd NE Unit 2206I Atlanta, GA | 2.0 | 2.0 | 1050 | $1,499 | $1.43 | 26d | 1 | 1.19mi |
| 2236 Plaster Rd NE Unit 2210H Atlanta, GA | 2.0 | 2.5 | 1250 | $1,879 | $1.50 | 26d | 1 | 1.19mi |
| 1466 Keys Crossing Dr NE Brookhaven, GA | 2.0 | 2.0 | 1064 | $2,000 | $1.88 | 45d | 1 | 1.23mi |
| 1424 Keys Crossing Dr NE Brookhaven, GA | 2.0 | 2.0 | 1054 | $1,999 | $1.90 | 45d | 1 | 1.23mi |
| 1468 Briarwood Rd NE Brookhaven, GA | 1.0–2.0 | 1.0–2.5 | 1341 | $2,500 | $1.86 | 45d | 2 | 1.26mi |
| 1468 Briarwood Rd NE #1104 Brookhaven, GA | 2.0 | 2.0 | 1392 | $2,075 | $1.49 | 26d | 1 | 1.27mi |
| 2623 Redding Rd NE Atlanta, GA | 2.0 | 1.5 | 1200 | $1,500 | $1.25 | 13d | 1 | 1.29mi |
| 2771 Skyland Dr NE Brookhaven, GA | 3.0 | 2.0 | 1350 | $2,527 | $1.87 | 5d | 1 | 1.31mi |
| 2500 Shallowford Rd Atlanta, GA | 3.0 | 1.0–2.0 | 905 | $1,991 | $2.20 | 0d | 37 | 1.40mi |
| 1482 Dresden Dr NE Brookhaven, GA | 2.0 | 1.0 | 1054 | $2,625 | $2.49 | 45d | 1 | 1.42mi |
| 1590 Northeast Expy Atlanta, GA | 1.0–3.0 | 1.0–2.0 | 1172 | $2,079 | $1.77 | 0d | 16 | 1.46mi |
| 2722 Frontier Ct Atlanta, GA | 3.0 | 2.0 | 1806 | $3,100 | $1.72 | 7d | 1 | 1.46mi |
Listing history 5 events
-
2026-06-10status $275,000 Pending 3 DOM
-
2026-06-09days on market $275,000 Active 3 DOM
-
2026-06-08days on market $275,000 Active 2 DOM
-
2026-06-07remarks 687-char remark
-
2026-06-07$275,000 Active 1 DOM
ⓘ Source: listings_history table (triggers on properties + properties_extension) + one-shot
backfill from property_details.listing_events for pre-trigger history.
Tax reassessment forecast GA · Resets to sale price
- Current annual tax
- $1,532 · $128/mo
- Projected year-2 tax
- $2,530 · $211/mo
- Expected delta
- +$998/yr (+$83/mo · 65.2%)
ⓘ Screening estimate from a state-policy table — verify with the county assessor before closing.
Climate risk First Street
- Flood 1/10 Low FEMA zone X (unshaded) · 0% chance over 30 yrs
- Wildfire 3/10 Moderate
- Heat 5/10 Major 7 d/yr ≥103°F today · 17 d/yr by 30 yrs out
- Wind 4/10 Moderate 18% chance of damaging wind over 30 yrs
- Air quality 5/10 Major 5 unhealthy d/yr today · 9 by 30 yrs out
Nearby sold comps map
Loading sold comps map…
Walkable amenities ~0.75 mi
Loading nearby amenities…
Taxation est. · year 1
- Rental income
- $27,483
- − Mortgage interest
- −$15,404
- − Property taxes
- −$1,532
- − Insurance
- −$1,375
- − Repairs & maintenance
- −$2,199
- − Management
- −$2,199
- − Depreciation
- −$8,000
- Taxable loss
- −$3,225
- Est. tax savings @ 24.0%
- +$774
- After-tax cash flow
- $2,273/yr
For passive investors: Depreciation is non-cash, so a rental often shows a tax loss while cash-flowing — sheltering income. Rental losses are passive: they offset passive income freely, and up to $25,000/yr can offset ordinary (W-2) income if you actively participate and your MAGI is under $100k (phasing out to $0 by $150k); unused losses carry forward. On sale, claimed depreciation is recaptured at up to 25%, and gains may owe capital-gains tax (a 1031 exchange can defer both). Figures are a year-1 estimate at your 24.0% rate — not tax advice; consult a CPA.
Schools (NCES district)
- District
- Dekalb County
- NCES district ID
- 1301740
- Math proficiency
- 19% ▼ -12.00%
- Reading proficiency
- 28% ▼ -7.00%
- Median HH income
- $51,448
- Composite
- 20.92/100
- National rank
- #8482
- State rank
- #125 of 174 in GA
Livability — Chamblee
- Score
- 72/100
- State rank
- #62
- US rank
- #5979
Category grades
Schools grade is shown separately in the Schools card above.
Census & demographics
- Census place
- Chamblee, GA
- County
- Dekalb County · 782,738 people
- City population
- 36,021
- Metro
- Atlanta-Sandy Springs-Alpharetta, GA
- Population (ZIP)
- 24,492
- Household income
- $112,054
- Rent vs Own
- Severe rent burden
- 1181.0
Population outlook (DeKalb County) Hauer SSP2
- Today (2025)
- 839,977 people
- By 2030
- 891,768 · +6.2%
- By 2040
- 988,894 · +17.7%
- By 2050
- 1,074,583 · +27.9%
- By 2075
- 1,245,026 · +48.2%
- By 2100
- 1,303,135 · +55.1%
Race, ethnicity, and origin ACS 2023
- Neighborhood character
- Diverse neighborhood (Simpson 0.70)
- Race & ethnicity
- White 45% Hispanic / Latino 25% Black 19% Two or more races 14% Asian 7%
- Hispanic origin (detail)
- Mexican 13%
- Common ancestry
- Romanian 3% Slovak 3% Italian 2%
- Foreign-born
- 27% · Canada, China, Jamaica
- Languages at home
- 66% English-only · Spanish 23% Other Indo-European 3% Chinese 2%
Political lean MEDSL · DeKalb
- 2024 margin
- Solid D (+64.8) · D 81.9% · R 17.1% · Other 1.0%
- 2008→2024 swing
- +6.1pp toward D · 2008: 58.6pp · 2024: 64.8pp
- All cycles
- 2024: D+64.8 2020: D+67.4 2016: D+64.8 2012: D+56.8 2008: D+58.6
Not yet ingested
- Civics
- —
Market trends
- HPI YoY
- ▼ -381.44%
- Current HPI
- 233.6127
- Rent YoY
- ▲ 2.28%
- Metro
- Atlanta-Sandy Springs-Alpharetta, GA
- State GDP YoY
- ▲ 2.66%
- F500 in state
- 28
Industry mix (Fortune 500 HQ in GA)
| Industry | F500 HQs | Revenue |
|---|---|---|
| Paper / Packaging | 2 | $29B |
|
||
| Retail | 1 | $160B |
|
||
| Transportation / Logistics | 1 | $91B |
|
||
| Airlines | 1 | $62B |
|
||
| Consumer Goods | 1 | $47B |
|
||
| Utilities | 1 | $25B |
|
||
Price history
+0.0% since first listed2 events — show timeline
- 2026-06-06 Listed $275,000 GAMLS
- 2026-06-06 Listed $275,000 FMLS
Property tax history
+2.7%/yrLatest (2025): $1,532 · +17.8% YoY. Source: county tax records.
Cash-flow waterfall
monthlySold comps — $/sqft
last 12 mo · ≤1 miLoading sold comps…