555 Lenox Ave Unit 1A · New York, NY
Flood risk 1/10 · Minimal
- FEMA flood zone
- X (unshaded)
- Chance of flooding over 30 yrs
- 0.0%
- Est. flood insurance / yr
- $507 – $1,088
Fire risk 1/10 · Minimal
- Est. fire insurance / yr
- $691 – $1,283
Heat risk 6/10 · Moderate
- Hot days now (above 99°F)
- 7 days/yr
- Hot days in 30 yrs
- 15 days/yr
Wind risk 6/10 · Moderate
- Chance of severe wind over 30 yrs
- 27.0%
Air-quality risk 4/10 · Minor
- Unhealthy air days now
- 5 days/yr
- Unhealthy air days in 30 yrs
- 6 days/yr
Risk factors via First Street. Map © Google.
Why this score? — see what drove the C- grade
The composite is a weighted blend of 9 inputs, each scored 0–100. Each bar is that input's sub-score; the figure is the points it added to the 100-point composite (weight × sub-score).
- Cash flow +12.4/30.0
- 1% rule +9.4/10.0
- ARV discount +7.5/15.0
- Appreciation +6.9/10.0
- Schools +5.0/10.0
- Livability +3.8/5.0
- DSCR +3.7/10.0
- Rent growth +2.5/5.0
- Condition / age +2.5/5.0
$499,999
🖨 Deal sheet 📄 Offer letter ✓ Due diligence
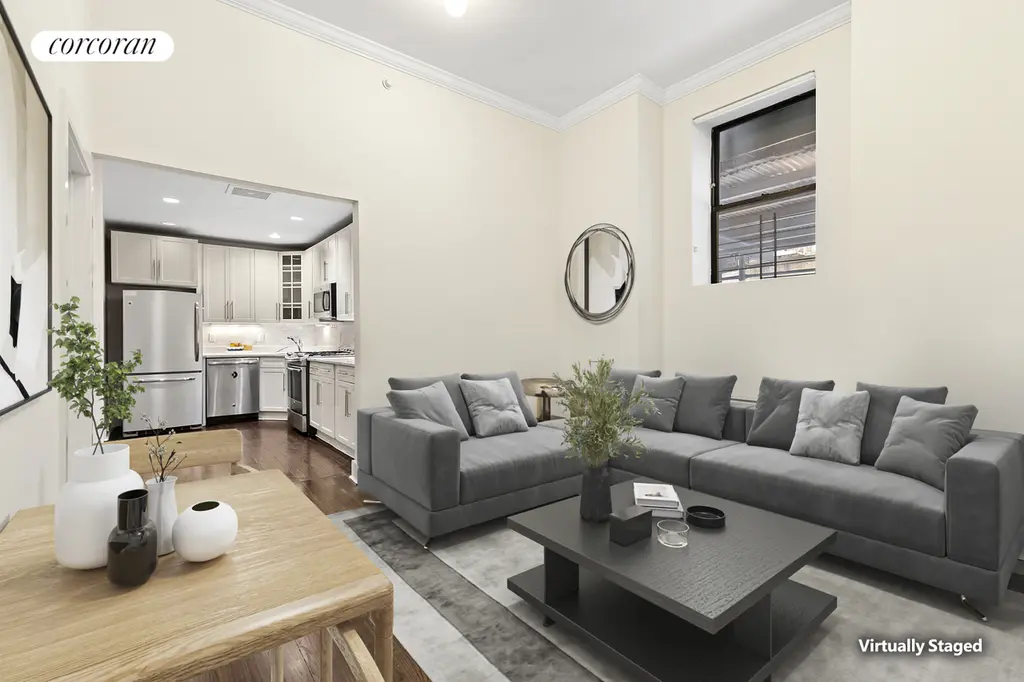
Listing remarks
Welcome to 555 Lenox Avenue #1A, a spacious 2 bedroom /2.5 bathroom duplex + bonus room + private outdoor space in the heart of Harlem! This home features: - On the upstairs level: 2 bedrooms + 2 bathrooms + living/dining room + kitchen - On the downstairs level: a huge approximately 500 square foot roomwith windows and outdoor access to use as you wish - plus another half bathroom - South-facing light (especially when the scaffolding comes down, scheduled for later this year), through high windows ensuring maximum light and privacy - Private outdoor space - Modern GE kitchen appliances - Dedicated and free storage unit and bike storage - Virtual doorman and package room Offered in pri
Key facts
- Bike storage
- $2,317 HOA
- Built 1910
Tags
Property features AI
Finance
- Other: Pets allowed in the building; Total of 32 units in the building
- Financial info: Association fee: $2,317 per month
- HOA & community: Monthly association fee
Exterior
- Home design: Condominium in a 6-story building; Entry on level 1; Building name: The Savoy West; Zoning: R7-2
- Construction: Elevator access; Bike storage
- Exterior features: Private outdoor space (over 60 sqft); Patio; Building roof deck; South exposure
Interior
- Kitchen: Dishwasher
- Bedrooms: Total of 4 rooms (includes bedrooms and living areas)
- Bathrooms: 2 full bathrooms; 1 half bathroom
- Interior features: High ceilings; Basement (other)
- Laundry & utility: In-unit washer hookup; Building laundry options
Neighborhood map
What this means for you Summary
Snapshot
- This is a 2-bed/2.5-bath condo listed at $500k.
Deal economics
- At list price, monthly cash flow is $-82 ($-986/yr) — negative.
- To cash-flow at today's rent, offer at most $488k (2.4% below list).
- Meets the 1% rule at list price ($7k rent vs $500k).
- Recommended offer: $440k (12.0% below list) — sets the bar for market timing.
- Cap rate 6.1% vs local median 2.6% in New York — top-decile yield for the area; either an underpriced asset or a hidden risk that comps aren't pricing in. Stress-test before assuming the spread holds.
Location & tenants
- Location reads 75/100 on livability (#268 in NY, #4,188 nationally) — a middle-class / working-renter tenant base. Strengths: amenities A+, commute A+, health & safety A; Watch: crime F, cost of living F.
- Market conditions: 24 active listings in the ZIP; 12 comparable units currently listed for rent nearby; rentals at typical pace (median 19d on market — plan ~3-4 weeks tenant-placement turnaround); 4,467 units permitted in New York County in 2024 (4,463 in 5+ unit buildings).
Forward outlook
- In year one you build about $22k of equity ($3k loan paydown + $19k appreciation (3.7% local appreciation)).
- New York County population projected at +21% by 2050 — long-run rental-demand tailwind backs the buy-and-hold thesis.
- At projected returns (3.7% appreciation + 3.0% rent growth), your $140k cash investment doubles in ~6 years — after that, you're playing with house money.
- By year 2, paydown + projected appreciation supports a ~$36k cash-out refi (75% LTV) — recoverable capital for the next deal without selling this one.
Negotiation context
- It's been on market 371 days — a 12% lower offer ($440k) is reasonable based on typical stale-listing flexibility.
- 5 sale attempts since 13y ago; this cycle's ask has dropped $50k (9%) from the opening price — seller is motivated, your offer sets the floor, not the list.
Risks & watch-outs
- Watch-outs: HOA is 32% of rent; built in 1910 — expect roof / HVAC / electrical / plumbing capex.
- Climate carrying-cost: major wind risk, 27% chance of damaging wind over 30y; extreme-heat days projected 7→15/yr by 2055 (HVAC capex compounding) — expect insurance premiums to compound above CPI over the hold.
Questions for the listing agent
- What do current leases actually rent for vs. the listed asking? Can we see a recent rent roll and the last 12 months of T-12 income?
- It's been on market 371 days. Have you received any prior offers? Is the seller open to a 12% concession, seller financing, or rate buy-down credit?
- Built in 1910 — when were the roof, HVAC, electrical panel, plumbing, and water heater last replaced?
- What does the HOA fee cover, when was the last increase, and are there any pending special assessments or reserve-fund shortfalls?
- Any open or pending special assessments — roof, HVAC, plumbing, elevator, façade? What's the per-unit balance and payoff schedule, and is the seller paying it off at close or rolling it to the buyer?
- Why hasn't it sold? Are there any deal-killer items the seller is aware of (foundation, flood, title, zoning, code violations)?
- Is there a deadline driving the sale (1031 exchange, divorce, estate, relocation)? That informs how much negotiation room exists.
- Schools are B-rated — typically a magnet for longer-tenancy family renters. What's the average tenant stay here, and is there a school-zone premium baked into asking?
- Crime grade is F in this area — have there been break-ins, vandalism, or insurance claims at this property in the last 3 years? What carrier currently insures it and at what premium?
- What's the average days-on-market for RENTAL listings here right now (not sales)? A rising rental-DOM trend means longer vacancies and softer asking-rent achievability than the comps imply.
- What's the recent tenant-quality profile in this submarket — average credit score on applications, eviction rate, late-payment / NSF rate, and stable-employment percentage? A property-management company in the area should have these aggregated.
- How much new apartment / multifamily construction is in the pipeline within 1–3 miles? Heavy new supply (>2% of stock underway) typically softens rents 12–24 months out; light construction supports rent growth.
Investment metrics
- 1% rule
- 1.44% ✓
- Cap rate
- 6.10%
- Cash-on-cash
- -0.70%
- DSCR
- 0.97
- GRM
- 5.8
CMA / ARV
No comps found within radius.
Projected returns pro-forma
3.74% appreciation · 3.0% rent growth · sell at horizon
- IRR
- 9.1%
- Equity multiple
- 1.55×
- Total profit
- $76,353
- Equity at exit
- $245,907
- IRR
- 11.3%
- Equity multiple
- 2.84×
- Total profit
- $257,557
- Equity at exit
- $396,253
Cash invested: $140,000 (down + closing). Projections, not guarantees.
Landlord ↔ Tenant lean methodology
- Overall (CITY)
- 0 Strongly Tenant-Friendly
- State New York
- 15 Strongly Tenant-Friendly · D+10
- County
- — inherits STATE
- City New York
- 0 Strongly Tenant-Friendly · D+34
ZIP-level market 10037
- Home prices YoY
- 2.3%
- Active inventory
- 24
- Price-to-rent
- 5.8×
Monthly cashflow live
- Estimated rent
- $7,203 high interval (Pro) →
- Mortgage (P&I)
- −$2,622
- Tax est. 1.5%
- −$625 /mo · $7,500/yr
- Insurance
- −$208
- HOA
- −$2,317
- Vacancy / Maint / Mgmt
- −$1,513
- Net cashflow
- $-82
Break-even live
UW: 25.0% down · 7.5% · 30yr · 1.5% tax · 5.0% vac · 8.0% maint · 8.0% mgmt
Financing live
Cash to close
- Down payment
- $125,000
- Closing costs
- $15,000
- Reserves months
- —
- Total cash needed
- —
Loan-product check · same deal, 3 products live
Conventional
25% down · 7.5% · 30yr
- Down + closing
- —
- Monthly P&I
- —
- Monthly cashflow
- —
- DSCR
- —
- Eligible?
- —
Personal DTI + credit; lowest rate.
DSCR
20% down · 8.5% · 30yr
- Down + closing
- —
- Monthly P&I
- —
- Monthly cashflow
- —
- DSCR
- —
- Eligible?
- —
No personal income docs; deal must DSCR.
Hard money
10% down · 12.0% · 12mo
- Down + closing
- —
- Monthly P&I
- —
- Monthly cashflow
- —
- DSCR
- —
- Eligible?
- —
Short-term bridge; refi at stabilization.
Rent comps 12 comps
| Address | Beds | Baths | Sqft | Rent | $/sqft | DOM | Units | Dist |
|---|---|---|---|---|---|---|---|---|
| 114 W 131st St Apt 2 New York, NY | 3.0 | 2.0 | 2000 | $6,750 | $3.38 | 24d | 1 | 0.35mi |
| 114 W 131st St Apt 2 New York, NY | 3.0 | 2.0 | 2000 | $6,150 | $3.08 | 18d | 1 | 0.35mi |
| 12 W 127th St Unit 1 New York, NY | 3.0 | 3.5 | 1899 | $8,999 | $4.74 | 24d | 1 | 0.58mi |
| 2413 3rd Ave Bronx, NY | 1.0–3.0 | 1.0–2.0 | 857 | $3,948 | $4.60 | 11d | 23 | 0.67mi |
| 52 Convent Ave Unit 30 New York, NY | 3.0 | 2.0 | 1300 | $7,500 | $5.77 | 24d | 1 | 0.70mi |
| 5 Lincoln Ave Bronx, NY | 1.0–3.0 | 1.0–2.5 | 1011 | $5,134 | $5.08 | 2d | 183 | 0.77mi |
| 241 Lenox Ave #1 New York, NY | 1.0 | 1.0 | 1175 | $8,000 | $6.81 | 19d | 1 | 0.78mi |
| 543 W 122nd St Unit 27C New York, NY | 2.0 | 2.0 | 1313 | $10,995 | $8.37 | 10d | 1 | 1.08mi |
| 543 W 122nd St New York, NY | 2.0 | 1.0–2.0 | 1057 | $10,995 | $10.40 | 2d | 7 | 1.08mi |
| 61 Malcolm X Blvd New York, NY | 2.0 | 2.0 | 1300 | $4,795 | $3.69 | 24d | 1 | 1.23mi |
| 1280 5th Ave Unit 15G New York, NY | 3.0 | 3.0 | 1640 | $10,500 | $6.40 | 19d | 1 | 1.44mi |
| 1 Morningside Dr New York, NY | 3.0 | 1.0–2.0 | 1655 | $8,145 | $4.92 | 1d | 1 | 1.47mi |
HOA detail condo
- Monthly dues
- $2,317 · $27,804/yr
- Likely covers
- doorman
- Assessments
- None detected in remarks — confirm with the listing agent.
Listing history 17 events
-
2026-06-18days on market $499,999 Active 371 DOM
-
2026-06-17days on market $499,999 Active 370 DOM
-
2026-06-15days on market $499,999 Active 368 DOM
-
2026-06-13days on market $499,999 Active 366 DOM
-
2026-06-10days on market $499,999 Active 362 DOM
-
2026-06-08days on market $499,999 Active 361 DOM
-
2026-06-03days on market $499,999 Active 356 DOM
-
2026-06-01days on market $499,999 Active 354 DOM
-
2026-05-31days on market $499,999 Active 353 DOM
-
2025-09-17price $499,999
-
2025-06-12$550,000 Active
-
2025-04-05price $550,000
-
2025-01-08price $599,000
-
2013-11-25$549,000
-
2013-11-25$549,000
-
2013-11-25$549,000
-
2013-11-25$549,000
ⓘ Source: listings_history table (triggers on properties + properties_extension) + one-shot
backfill from property_details.listing_events for pre-trigger history.
Climate risk First Street
- Flood 1/10 Low FEMA zone X (unshaded) · 0% chance over 30 yrs
- Wildfire 1/10 Low
- Heat 6/10 Major 7 d/yr ≥99°F today · 15 d/yr by 30 yrs out
- Wind 6/10 Major 27% chance of damaging wind over 30 yrs
- Air quality 4/10 Moderate 5 unhealthy d/yr today · 6 by 30 yrs out
Nearby sold comps map
Loading sold comps map…
Walkable amenities ~0.75 mi
Loading nearby amenities…
Taxation est. · year 1
- Rental income
- $86,434
- − Mortgage interest
- −$28,008
- − Property taxes
- −$7,500
- − Insurance
- −$2,500
- − Repairs & maintenance
- −$6,915
- − Management
- −$6,915
- − HOA
- −$27,804
- − Depreciation
- −$14,545
- Taxable loss
- −$7,753
- Est. tax savings @ 24.0%
- +$1,861
- After-tax cash flow
- $875/yr
For passive investors: Depreciation is non-cash, so a rental often shows a tax loss while cash-flowing — sheltering income. Rental losses are passive: they offset passive income freely, and up to $25,000/yr can offset ordinary (W-2) income if you actively participate and your MAGI is under $100k (phasing out to $0 by $150k); unused losses carry forward. On sale, claimed depreciation is recaptured at up to 25%, and gains may owe capital-gains tax (a 1031 exchange can defer both). Figures are a year-1 estimate at your 24.0% rate — not tax advice; consult a CPA.
Schools (NCES district)
No district data.
Livability — New York
- Score
- 75/100
- State rank
- #268
- US rank
- #4188
Category grades
Schools grade is shown separately in the Schools card above.
Census & demographics
- Census place
- New York, NY
- City population
- 7,731,280
- Population (ZIP)
- 18,333
Population outlook (New York County) Hauer SSP2
- Today (2025)
- 1,825,725 people
- By 2030
- 1,904,611 · +4.3%
- By 2040
- 2,052,719 · +12.4%
- By 2050
- 2,206,601 · +20.9%
- By 2075
- 2,509,427 · +37.4%
- By 2100
- 2,702,933 · +48.0%
Race, ethnicity, and origin ACS 2023
- Neighborhood character
- Diverse neighborhood (Simpson 0.58)
- Race & ethnicity
- Black 60% Hispanic / Latino 21% Two or more races 11% White 11% Asian 4%
- Hispanic origin (detail)
- Mexican 1% Puerto Rican 6% Dominican 9%
- Common ancestry
- Scotch-Irish 1% Hispanic 1% Russian 1%
- Foreign-born
- 16% · Canada, China, Jamaica
- Languages at home
- 74% English-only · Spanish 15% French/Haitian/Cajun 2% Arabic 2%
Political lean MEDSL · New York
- 2024 margin
- Solid D (+64.8) · D 82.4% · R 17.6%
- 2008→2024 swing
- -7.4pp toward R · 2008: 72.2pp · 2024: 64.8pp
- All cycles
- 2024: D+64.8 2020: D+74.5 2016: D+77.2 2012: D+69.6 2008: D+72.2
Not yet ingested
- Civics
- —
Market trends
- HPI YoY
- ▲ 3.74%
- Current HPI
- 166.9692
- Rent YoY
- —
- Metro
- —
- State GDP YoY
- ▲ 2.60%
- F500 in state
- 92
Industry mix (Fortune 500 HQ in NY)
| Industry | F500 HQs | Revenue |
|---|---|---|
| Financial Services | 10 | $950B |
|
||
| Consumer Goods | 9 | $162B |
|
||
| Insurance | 4 | $225B |
|
||
| Telecommunications | 2 | $144B |
|
||
| Pharmaceuticals | 2 | $112B |
|
||
| Media / Entertainment | 2 | $69B |
|
||
Price history
-8.9% since first listed8 events — show timeline
- 2025-09-17 Price Changed $499,999 RLS at REBNY
- 2025-06-12 Listed $550,000 RLS at REBNY
- 2025-04-05 Price Changed $550,000 RLS at REBNY
- 2025-01-08 Price Changed $599,000 RLS at REBNY
- 2013-11-25 Listed $549,000 RLS at REBNY
- 2013-11-25 Listed $549,000 RLS at REBNY
- 2013-11-25 Listed $549,000 RLS at REBNY
- 2013-11-25 Listed $549,000 RLS at REBNY
Cash-flow waterfall
monthlySold comps — $/sqft
last 12 mo · ≤1 miLoading sold comps…