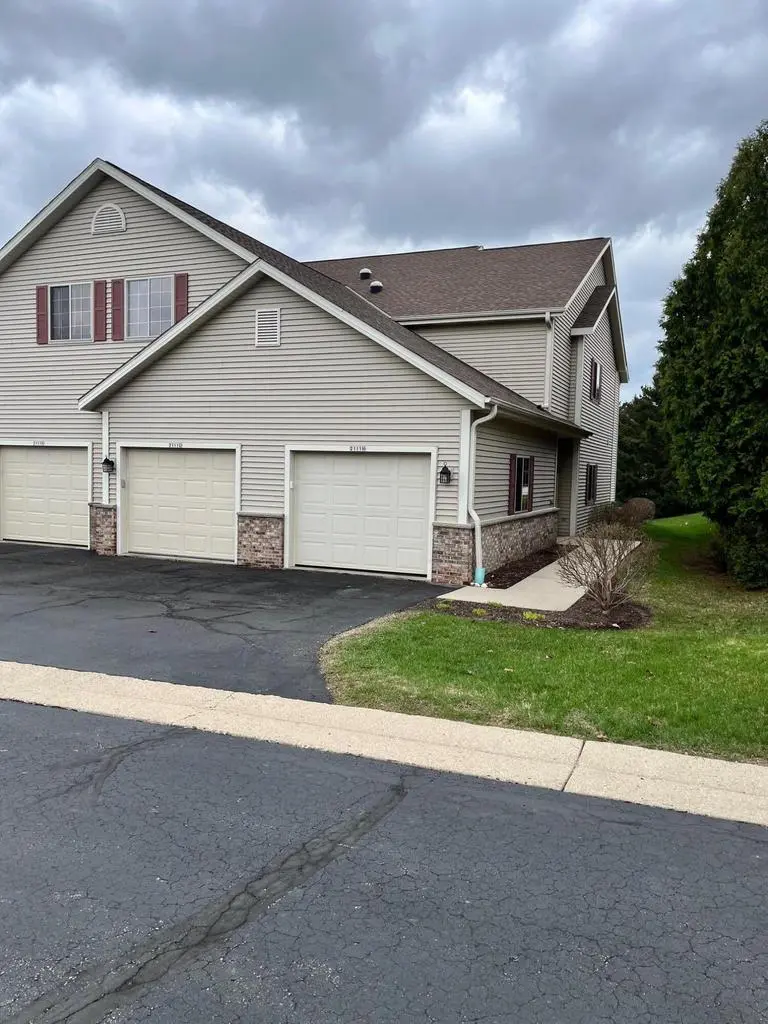
2112 Pine Ridge Ct Unit H · Grafton, WI
Flood risk 1/10 · Minimal
- FEMA flood zone
- X (unshaded)
- Chance of flooding over 30 yrs
- 0.0%
- Est. flood insurance / yr
- $507 – $1,088
Fire risk 2/10 · Minimal
- Est. fire insurance / yr
- $636 – $1,182
Heat risk 2/10 · Minimal
- Hot days now (above 97°F)
- 7 days/yr
- Hot days in 30 yrs
- 13 days/yr
Wind risk 2/10 · Minimal
- Chance of severe wind over 30 yrs
- —
Air-quality risk 2/10 · Minimal
- Unhealthy air days now
- 1 days/yr
- Unhealthy air days in 30 yrs
- 1 days/yr
Risk factors via First Street. Map © Google.
Why this score? — see what drove the D- grade
The composite is a weighted blend of 9 inputs, each scored 0–100. Each bar is that input's sub-score; the figure is the points it added to the 100-point composite (weight × sub-score).
- ARV discount +13.2/15.0
- Cash flow +7.5/30.0
- Schools +6.0/10.0
- Livability +3.8/5.0
- 1% rule +2.5/10.0
- Rent growth +2.5/5.0
- Condition / age +2.5/5.0
- DSCR +1.6/10.0
- Appreciation +0.0/10.0
$324,900
🖨 Deal sheet 📄 Offer letter ✓ Due diligence
Listing remarks MLS
Hard to find popular Pine Ridge Condo. This is the larger upper unit 1622 SF with 3rd bedroom (could be a den) 2 full bathsand walk in closets. Living room features a gas fireplace and walkout to a balcony deck, 1 car garage has direct stairway access to the 2nd floor unit. Project amenities include outdoor pool, hot tub/spa, clubhouse/party room. Move in immediately.
Key facts
- Outdoor pool
- Pine ridge condo
- Hot tub
Tags
Neighborhood map
What this means for you Summary
Snapshot
- This is a 3-bed/4.0-bath condo listed at $325k.
Deal economics
- At list price, monthly cash flow is $-401 ($-5k/yr) — negative.
- To cash-flow at today's rent, offer at most $254k (21.8% below list).
- To meet the 1% rule (rent ≥ 1% of price), the offer needs to be $245k (24.6% below list).
- Recommended offer: $245k (24.6% below list) — sets the bar for 1% rule.
- Cap rate 4.8% vs local median 1.1% in Grafton — top-decile yield for the area; either an underpriced asset or a hidden risk that comps aren't pricing in. Stress-test before assuming the spread holds.
Location & tenants
- Location reads 75/100 on livability (#145 in WI, #3,879 nationally) — a middle-class / working-renter tenant base. Strengths: schools A+, crime A+, employment A+; Watch: amenities F, commute F, health & safety F.
- Cedarburg School District (suburban): math 71% / reading 64% proficiency, ranked #4 of 342 in WI (top 1%) — acceptable for families but not a draw, mixed tenant base, ~2y average lease; only 7% free/reduced lunch — higher-income household profile.
- Market conditions: 140 active listings in the ZIP; 4 comparable units currently listed for rent nearby; rentals lingering (median 44d on market — plan ~5-8 weeks vacancy on turnover, expect pricing pressure); 50% of comp listings sitting > 30 days — soft ceiling on asking rent; solid renter incomes; 575 units permitted in Ozaukee County in 2024 (280 in 5+ unit buildings).
- This rent runs 32% of the median local income ($92k/yr) — at the standard rent-burdened threshold; future hikes will face affordability resistance.
Forward outlook
- Local home prices are declining (-3.0%/yr); year-one equity from $2k of loan paydown is wiped out by about $10k of value loss. Plan a longer hold.
- Ozaukee County population projected at +3% by 2050 — modest demand growth; plan on rents tracking national, not racing it.
Negotiation context
- It's been on market 18 days — a 2% lower offer ($320k) is reasonable based on typical stale-listing flexibility.
- 4 sale attempts since 13y ago with the ask held roughly flat each time — persistent listings suggest the price (not the market) is what's stuck; bring a comps-based counter.
- Current owner paid $179k; list at $325k implies a 82% gain — meaningful room to come down on a strong offer.
Questions for the listing agent
- What do current leases actually rent for vs. the listed asking? Can we see a recent rent roll and the last 12 months of T-12 income?
- What does the HOA fee cover, when was the last increase, and are there any pending special assessments or reserve-fund shortfalls?
- Any open or pending special assessments — roof, HVAC, plumbing, elevator, façade? What's the per-unit balance and payoff schedule, and is the seller paying it off at close or rolling it to the buyer?
- Is there a deadline driving the sale (1031 exchange, divorce, estate, relocation)? That informs how much negotiation room exists.
- Schools are A-rated — typically a magnet for longer-tenancy family renters. What's the average tenant stay here, and is there a school-zone premium baked into asking?
- The area grade is low — what's the realistic commute time and amenity access for the typical tenant pool here? Any planned neighborhood developments (good or bad) we should know about?
- What's the average days-on-market for RENTAL listings here right now (not sales)? A rising rental-DOM trend means longer vacancies and softer asking-rent achievability than the comps imply.
- What's the recent tenant-quality profile in this submarket — average credit score on applications, eviction rate, late-payment / NSF rate, and stable-employment percentage? A property-management company in the area should have these aggregated.
- How much new apartment / multifamily construction is in the pipeline within 1–3 miles? Heavy new supply (>2% of stock underway) typically softens rents 12–24 months out; light construction supports rent growth.
Investment metrics
- 1% rule
- 0.75% ✗
- Cap rate
- 4.81%
- Cash-on-cash
- -5.28%
- DSCR
- 0.76
- GRM
- 11.1
CMA / ARV
- ARV (median comp)
- $372,007
- List price
- $324,900
- Delta
- -12.66%
- Verdict
- UNDERPRICED
- Comps
- 1 within 2.0 mi
Projected returns pro-forma
-3.0% appreciation · 3.0% rent growth · sell at horizon
- IRR
- -25.3%
- Equity multiple
- 0.14×
- Total profit
- $-78,071
- Equity at exit
- $48,444
- IRR
- -21.3%
- Equity multiple
- -0.10×
- Total profit
- $-100,464
- Equity at exit
- $28,091
Cash invested: $90,972 (down + closing). Projections, not guarantees.
Landlord ↔ Tenant lean methodology
- Overall (STATE)
- 73 Landlord-Friendly
- State Wisconsin
- 73 Landlord-Friendly · R+2
- County
- — inherits STATE
- City
- — inherits STATE
ZIP-level market 53024
- Active inventory
- 140
- Price-to-rent
- 11.1×
Monthly cashflow live
- Estimated rent
- $2,449 medium interval (Pro) →
- Mortgage (P&I)
- −$1,704
- Tax from tax record
- −$266 /mo · $3,193/yr
- Insurance
- −$135
- HOA
- −$230
- Vacancy / Maint / Mgmt
- −$514
- Net cashflow
- $-401
Break-even live
UW: 25.0% down · 7.5% · 30yr · 1.5% tax · 5.0% vac · 8.0% maint · 8.0% mgmt
Financing live
Cash to close
- Down payment
- $81,225
- Closing costs
- $9,747
- Reserves months
- —
- Total cash needed
- —
Loan-product check · same deal, 3 products live
Conventional
25% down · 7.5% · 30yr
- Down + closing
- —
- Monthly P&I
- —
- Monthly cashflow
- —
- DSCR
- —
- Eligible?
- —
Personal DTI + credit; lowest rate.
DSCR
20% down · 8.5% · 30yr
- Down + closing
- —
- Monthly P&I
- —
- Monthly cashflow
- —
- DSCR
- —
- Eligible?
- —
No personal income docs; deal must DSCR.
Hard money
10% down · 12.0% · 12mo
- Down + closing
- —
- Monthly P&I
- —
- Monthly cashflow
- —
- DSCR
- —
- Eligible?
- —
Short-term bridge; refi at stabilization.
Rent comps 4 comps
| Address | Beds | Baths | Sqft | Rent | $/sqft | DOM | Units | Dist |
|---|---|---|---|---|---|---|---|---|
| 201 W Oak St Grafton, WI | 3.0 | 2.5 | 1700 | $2,395 | $1.41 | 44d | 1 | 0.14mi |
| 5465 Cedar Ct Unit 3 Cedarburg, WI | 2.0 | 1.5 | 1400 | $2,350 | $1.68 | 44d | 1 | 0.58mi |
| Hanover Ave Cedarburg, WI | 1.0–2.0 | 1.0–2.0 | 1155 | $2,580 | $2.23 | 2d | 6 | 1.24mi |
| W62N438 Hanover Ave Cedarburg, WI | 3.0–4.0 | 2.0–3.0 | 1973 | $3,560 | $1.80 | 2d | 4 | 1.31mi |
HOA detail condo
- Monthly dues
- $230 · $2,760/yr
- Likely covers
- gaspool
- Assessments
- None detected in remarks — confirm with the listing agent.
Listing history 12 events
-
2026-05-09status Pending 370-char remark
Show marketing remark (370 chars)
Hard to find popular Pine Ridge Condo. This is the larger upper unit 1622 SF with 3rd bedroom (could be a den) 2 full bathsand walk in closets. Living room features a gas fireplace and walkout to a balcony deck, 1 car garage has direct stairway access to the 2nd floor unit. Project amenities include outdoor pool, hot tub/spa, clubhouse/party room. Move in immediately.
-
2026-04-16$324,900 Active 370-char remark
Show marketing remark (370 chars)
Hard to find popular Pine Ridge Condo. This is the larger upper unit 1622 SF with 3rd bedroom (could be a den) 2 full bathsand walk in closets. Living room features a gas fireplace and walkout to a balcony deck, 1 car garage has direct stairway access to the 2nd floor unit. Project amenities include outdoor pool, hot tub/spa, clubhouse/party room. Move in immediately.
-
2018-10-23soldstatus $179,000
-
2017-05-31soldstatus $170,000
-
2017-05-26soldstatus $170,000 Sold 479-char remark
Show marketing remark (479 chars)
Rare 3 bedroom 2 full bath End Unit for sale in model condition. Home features a open concept vaulted living room with cornered gas F. P. connected to a gourmet kitchen with a raised snackbar and attached dining room. Nice size bedrooms including the master w/ a full bath & the 3rd bedroom thats 22 x 12. Has a covered porch patio area. Accented solar lighting in LR. 1 car attached garage. Relax and enjoy the clubhouse, exercise room, pool and hot tub! Serene setting
-
2017-04-16historical Contingent 479-char remark
Show marketing remark (479 chars)
Rare 3 bedroom 2 full bath End Unit for sale in model condition. Home features a open concept vaulted living room with cornered gas F. P. connected to a gourmet kitchen with a raised snackbar and attached dining room. Nice size bedrooms including the master w/ a full bath & the 3rd bedroom thats 22 x 12. Has a covered porch patio area. Accented solar lighting in LR. 1 car attached garage. Relax and enjoy the clubhouse, exercise room, pool and hot tub! Serene setting
-
2017-04-11$179,900 Active 479-char remark
Show marketing remark (479 chars)
Rare 3 bedroom 2 full bath End Unit for sale in model condition. Home features a open concept vaulted living room with cornered gas F. P. connected to a gourmet kitchen with a raised snackbar and attached dining room. Nice size bedrooms including the master w/ a full bath & the 3rd bedroom thats 22 x 12. Has a covered porch patio area. Accented solar lighting in LR. 1 car attached garage. Relax and enjoy the clubhouse, exercise room, pool and hot tub! Serene setting
-
2013-07-12historical
-
2013-07-12$159,000
-
2013-07-12$164,900
-
2013-07-12historical
-
2011-09-28soldstatus $130,000
ⓘ Source: listings_history table (triggers on properties + properties_extension) + one-shot
backfill from property_details.listing_events for pre-trigger history.
Tax reassessment forecast WI · Partial reset (capped growth)
- Current annual tax
- $3,193 · $266/mo
- Projected year-2 tax
- $4,602 · $383/mo
- Expected delta
- +$1,409/yr (+$117/mo · 44.1%)
ⓘ Screening estimate from a state-policy table — verify with the county assessor before closing.
Climate risk First Street
- Flood 1/10 Low FEMA zone X (unshaded) · 0% chance over 30 yrs
- Wildfire 2/10 Low
- Heat 2/10 Low 7 d/yr ≥97°F today · 13 d/yr by 30 yrs out
- Wind 2/10 Low
- Air quality 2/10 Low 1 unhealthy d/yr today · 1 by 30 yrs out
Nearby sold comps map
Loading sold comps map…
Walkable amenities ~0.75 mi
Loading nearby amenities…
Taxation est. · year 1
- Rental income
- $29,387
- − Mortgage interest
- −$18,199
- − Property taxes
- −$3,193
- − Insurance
- −$1,624
- − Repairs & maintenance
- −$2,351
- − Management
- −$2,351
- − HOA
- −$2,760
- − Depreciation
- −$9,452
- Taxable loss
- −$10,543
- Est. tax savings @ 24.0%
- +$2,530
- After-tax cash flow
- $-2,277/yr
For passive investors: Depreciation is non-cash, so a rental often shows a tax loss while cash-flowing — sheltering income. Rental losses are passive: they offset passive income freely, and up to $25,000/yr can offset ordinary (W-2) income if you actively participate and your MAGI is under $100k (phasing out to $0 by $150k); unused losses carry forward. On sale, claimed depreciation is recaptured at up to 25%, and gains may owe capital-gains tax (a 1031 exchange can defer both). Figures are a year-1 estimate at your 24.0% rate — not tax advice; consult a CPA.
Schools (NCES district)
- District
- Cedarburg School District
- NCES district ID
- 5502460
- Math proficiency
- 71% ▲ 4.00%
- Reading proficiency
- 64% ▼ -2.00%
- Median HH income
- $80,718
- Composite
- 60.27/100
- National rank
- #856
- State rank
- #4 of 342 in WI
Livability — Grafton
- Score
- 75/100
- State rank
- #145
- US rank
- #3879
Category grades
Schools grade is shown separately in the Schools card above.
Census & demographics
- Census place
- Grafton, WI
- County
- Ozaukee County · 64,110 people
- City population
- 18,982
- Metro
- Milwaukee-Waukesha, WI
- Population (ZIP)
- 18,982
- Household income
- $92,390
- Rent vs Own
- Severe rent burden
- 393.0
Population outlook (Ozaukee County) Hauer SSP2
- Today (2025)
- 91,557 people
- By 2030
- 92,993 · +1.6%
- By 2040
- 94,492 · +3.2%
- By 2050
- 94,539 · +3.3%
- By 2075
- 98,061 · +7.1%
- By 2100
- 93,682 · +2.3%
Race, ethnicity, and origin ACS 2023
- Neighborhood character
- Predominantly White (91%)
- Race & ethnicity
- White 91% Two or more races 5% Hispanic / Latino 3% Black 2% Asian 1%
- Common ancestry
- Romanian 11% Portuguese 4% Lithuanian 3%
- Foreign-born
- 4% · Canada
- Languages at home
- 95% English-only · Russian/Polish/Slavic 1% Spanish 1% German/W. Germanic 1%
Political lean MEDSL · Ozaukee
- 2024 margin
- R (+10.5) · D 44.1% · R 54.6% · Other 1.3%
- 2008→2024 swing
- +11.2pp toward D · 2008: -21.7pp · 2024: -10.5pp
- All cycles
- 2024: R+10.5 2020: R+12.0 2016: R+19.3 2012: R+30.4 2008: R+21.7
Not yet ingested
- Civics
- —
Market trends
- HPI YoY
- ▼ -138.38%
- Current HPI
- 178.6048
- Rent YoY
- —
- Metro
- Milwaukee-Waukesha, WI
- State GDP YoY
- ▲ 2.10%
- F500 in state
- 20
Industry mix (Fortune 500 HQ in WI)
| Industry | F500 HQs | Revenue |
|---|---|---|
| Industrial Machinery | 4 | $23B |
|
||
| Industrial Technology | 2 | $36B |
|
||
| Insurance | 1 | $36B |
|
||
| Professional Services | 1 | $19B |
|
||
| Utilities | 1 | $9B |
|
||
| Consumer Goods | 1 | $3B |
|
||
Price history
+149.9% since first listed12 events — show timeline
- 2026-05-09 Pending — METROMLS
- 2026-04-16 Listed $324,900 METROMLS
- 2018-10-23 Sold (Public Records) $179,000 Public Records
- 2017-05-31 Sold (Public Records) $170,000 Public Records
- 2017-05-26 Sold (MLS) $170,000 METROMLS
- 2017-04-16 Contingent — METROMLS
- 2017-04-11 Listed $179,900 METROMLS
- 2013-07-12 Listed $159,000 METROMLS
- 2013-07-12 Listing Removed — METROMLS
- 2013-07-12 Listing Removed — METROMLS
- 2013-07-12 Listed $164,900 METROMLS
- 2011-09-28 Sold (Public Records) $130,000 Public Records
Property tax history
+3.0%/yrLatest (2025): $3,193 · +9.2% YoY. Source: county tax records.
Cash-flow waterfall
monthlySold comps — $/sqft
last 12 mo · ≤1 miLoading sold comps…