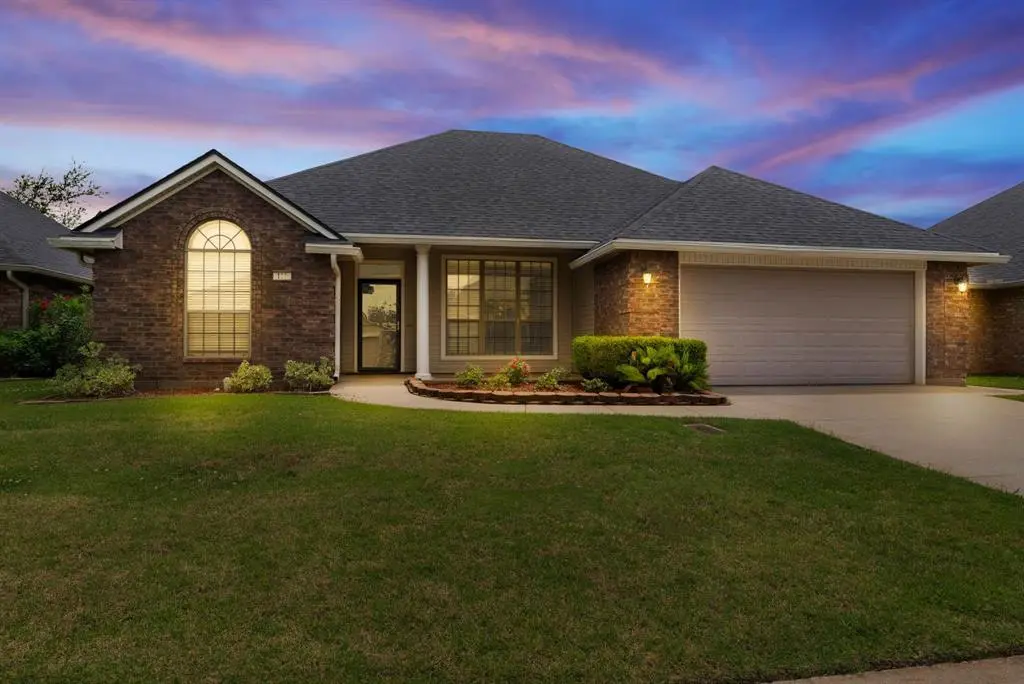
111 Rachel Ln · Bossier City, LA
Flood risk 1/10 · Minimal
- FEMA flood zone
- X (unshaded)
- Chance of flooding over 30 yrs
- 0.0%
- Est. flood insurance / yr
- $507 – $1,088
Fire risk 3/10 · Minor
- Est. fire insurance / yr
- $1,269 – $2,357
Heat risk 7/10 · Major
- Hot days now (above 110°F)
- 7 days/yr
- Hot days in 30 yrs
- 23 days/yr
Wind risk 6/10 · Moderate
- Chance of severe wind over 30 yrs
- 67.0%
Air-quality risk 2/10 · Minimal
- Unhealthy air days now
- 1 days/yr
- Unhealthy air days in 30 yrs
- 1 days/yr
Risk factors via First Street. Map © Google.
Why this score? — see what drove the D- grade
The composite is a weighted blend of 9 inputs, each scored 0–100. Each bar is that input's sub-score; the figure is the points it added to the 100-point composite (weight × sub-score).
- ARV discount +14.1/15.0
- Cash flow +7.3/30.0
- Rent growth +4.1/5.0
- Schools +3.8/10.0
- Livability +3.6/5.0
- Condition / age +2.5/5.0
- 1% rule +2.4/10.0
- DSCR +1.5/10.0
- Appreciation +0.0/10.0
$264,900
🖨 Deal sheet 📄 Offer letter ✓ Due diligence
Listing remarks
Welcome home to comfort, convenience, and carefree living! This beautifully maintained 2-bedroom, 2-bath handicap-accessible home is located in a desirable gated adult community designed for easy living and an active lifestyle. Inside, you’ll find fresh paint, new carpet, and a newer roof, making this home truly move-in ready. The spacious layout features accessibility-friendly touches for added comfort and peace of mind. Enjoy low-maintenance living with an HOA that covers front lawn care, flower bed maintenance, irrigation, and trash pickup, so you can spend more time enjoying the community’s wonderful amenities. Residents have access to a clubhouse with planned activities, sc
Key facts
- Handicap accessible
- 5,881 sq ft lot
- 2 garage spots
Tags
Property features AI
Finance
- Other: Possession at closing/funding
- Financial info: No second mortgage
- HOA & community: Mandatory HOA (Willow Lake HOA); HOA fees $435 quarterly; HOA covers front yard maintenance, grounds maintenance, and full use of facilities
Exterior
- Parking: Attached garage with 2 covered spaces
- Utilities: City water; City sewer; Asphalt streets
- Home design: Single-family residence; One story; Preowned (built in 2005); Shingle roof; Deed restrictions; Subdivision: Willow Lake
- Construction: Built in 2005
- Exterior features: Less than 0.5 acre lot; Curbs; Private road; Accessible approach with ramp and accessible doors
Interior
- Kitchen: Dishwasher; Disposal; Eat-in kitchen with breakfast bar
- Bedrooms: 2 bedrooms (primary bedroom on main level with linen closet, separate shower, and walk-in closet)
- Flooring: Carpet; Laminate; Vinyl
- Bathrooms: 2 full bathrooms
- Heating & cooling: Central heating (natural gas); Central electric air conditioning
- Interior features: Open floorplan; High-speed internet available; Walk-in closets; One living area; One dining area; Room count of 4
- Laundry & utility: Washer/dryer not specified
Neighborhood map
What this means for you Summary
Snapshot
- This is a 2-bed/2.0-bath single-family listed at $265k.
Deal economics
- At list price, monthly cash flow is $-354 ($-4k/yr) — negative.
- To cash-flow at today's rent, offer at most $202k (23.6% below list).
- To meet the 1% rule (rent ≥ 1% of price), the offer needs to be $195k (26.3% below list).
- Recommended offer: $195k (26.3% below list) — sets the bar for 1% rule.
Location & tenants
- Location reads 71/100 on livability (#47 in LA) — a middle-class / working-renter tenant base. Strengths: commute A+, cost of living A+, housing A+; Watch: employment D+, crime F, amenities F.
- Bossier Parish (urban): math 40% / reading 47% proficiency, ranked #17 of 98 in LA (top 17%) — families likely to look elsewhere, expect single-tenant / working-renter base with shorter leases.
- Zoned schools: Bossier Elementary School (math 8% / reading 17%, grade F, #550 of 646 statewide, top 88%, 222 students, 93% FRL) — zoned schools average 93% FRL vs 41% district-wide (52 pts higher); higher-poverty schools than district average — tighter screening recommended.
- Zoned-school proficiency averages 12% at this address vs 44% district-wide (-31 pts) — the specific schools serving this property underperform the Bossier Parish average; the district grade overstates school quality for this exact location.
- Market conditions: Rents rising fast (+6.6%/yr); 421 active listings in the ZIP; 10 comparable units currently listed for rent nearby; rentals at typical pace (median 22d on market — plan ~3-4 weeks tenant-placement turnaround); 716 units permitted in Bossier Parish in 2024 (0 in 5+ unit buildings).
- This rent runs 36% of the median local income ($65k/yr) — at the standard rent-burdened threshold; future hikes will face affordability resistance.
Forward outlook
- Local home prices are declining (-3.0%/yr); year-one equity from $2k of loan paydown is wiped out by about $8k of value loss. Plan a longer hold.
- Bossier County population projected at +28% by 2050 — long-run rental-demand tailwind backs the buy-and-hold thesis.
Negotiation context
- It's been on market 35 days — a 3% lower offer ($257k) is reasonable based on typical stale-listing flexibility.
- 2 sale attempts with the ask held roughly flat each time — persistent listings suggest the price (not the market) is what's stuck; bring a comps-based counter.
- Current owner paid $198k; 34% above their basis — modest negotiation headroom, anchor on the comps not their cost.
Risks & watch-outs
- Climate carrying-cost: major wind risk, 67% chance of damaging wind over 30y; extreme-heat days projected 7→23/yr by 2055 (HVAC capex compounding) — expect insurance premiums to compound above CPI over the hold.
Questions for the listing agent
- What do current leases actually rent for vs. the listed asking? Can we see a recent rent roll and the last 12 months of T-12 income?
- It's been on market 35 days. Have you received any prior offers? Is the seller open to a 26% concession, seller financing, or rate buy-down credit?
- What does the HOA fee cover, when was the last increase, and are there any pending special assessments or reserve-fund shortfalls?
- Is there a deadline driving the sale (1031 exchange, divorce, estate, relocation)? That informs how much negotiation room exists.
- Schools are B-rated — typically a magnet for longer-tenancy family renters. What's the average tenant stay here, and is there a school-zone premium baked into asking?
- Crime grade is F in this area — have there been break-ins, vandalism, or insurance claims at this property in the last 3 years? What carrier currently insures it and at what premium?
- The area grade is low — what's the realistic commute time and amenity access for the typical tenant pool here? Any planned neighborhood developments (good or bad) we should know about?
- What's the average days-on-market for RENTAL listings here right now (not sales)? A rising rental-DOM trend means longer vacancies and softer asking-rent achievability than the comps imply.
- What's the recent tenant-quality profile in this submarket — average credit score on applications, eviction rate, late-payment / NSF rate, and stable-employment percentage? A property-management company in the area should have these aggregated.
- How much new for-sale + rental construction is in the pipeline within 1–3 miles? Heavy new supply typically softens prices + rents 12–24 months out; constrained supply supports both.
Investment metrics
- 1% rule
- 0.74% ✗
- Cap rate
- 4.69%
- Cash-on-cash
- -5.73%
- DSCR
- 0.75
- GRM
- 11.3
CMA / ARV
- ARV (median comp)
- $310,617
- List price
- $264,900
- Delta
- -14.72%
- Verdict
- UNDERPRICED
- Comps
- 20 within 1.0 mi
Show comp detail 12 sales within ~0.75 mi
| Address | Dist | Beds/Ba | Sqft | Sold | Price | $/sf | Match |
|---|---|---|---|---|---|---|---|
| 606 Perfect Pl | 0.04mi | 3/2.5 (+1) | 1,676 (-2%) | 2mo | $265,000 | $158 | 86 |
| 116 Willow Lake Blvd | 0.13mi | 3/2.0 (+1) | 1,872 (+10%) | 3mo | $279,500 | $149 | 70 |
| 350 Hendry Dr | 0.42mi | 3/2.0 (+1) | 1,656 (-3%) | 6mo | $249,900 | $151 | 66 |
| 722 Mahogany Ln | 0.53mi | 3/2.0 (+1) | 1,685 (-1%) | 4mo | $265,470 | $158 | 65 |
| 714 Crozier Dr | 0.45mi | 3/2.0 (+1) | 1,848 (+8%) | 1mo | $279,999 | $152 | 59 |
| 209 Norwell Ln | 0.44mi | 3/2.0 (+1) | 1,848 (+8%) | 3mo | $300,000 | $162 | 58 |
| 721 Mahogany Ln | 0.53mi | 3/2.0 (+1) | 1,561 (-8%) | 6mo | $258,525 | $166 | 52 |
| 785 Crozier Dr | 0.45mi | 3/2.0 (+1) | 1,892 (+11%) | 6mo | $299,999 | $159 | 50 |
| 314 Hendry Dr | 0.50mi | 3/2.0 (+1) | 1,925 (+13%) | 6mo | $299,004 | $155 | 45 |
| 723 Mahogany Ln | 0.52mi | 3/2.0 (+1) | 1,925 (+13%) | 6mo | $288,493 | $150 | 44 |
| 321 Hendry Dr | 0.47mi | 3/2.0 (+1) | 1,953 (+15%) | 5mo | $280,634 | $144 | 44 |
| 3070 Dublin Way | 0.74mi | 3/2.0 (+1) | 1,549 (-9%) | 5mo | $284,900 | $184 | 41 |
Match score weights: distance 35% · size 25% · config 20% · recency 20%. Top-matched comps best support the ARV.
Projected returns pro-forma
-3.0% appreciation · 6.56% rent growth · sell at horizon
- IRR
- -22.0%
- Equity multiple
- 0.22×
- Total profit
- $-58,166
- Equity at exit
- $39,497
- IRR
- -8.9%
- Equity multiple
- 0.36×
- Total profit
- $-47,418
- Equity at exit
- $22,904
Cash invested: $74,172 (down + closing). Projections, not guarantees.
Landlord ↔ Tenant lean methodology
- Overall (STATE)
- 90 Strongly Landlord-Friendly
- State Louisiana
- 90 Strongly Landlord-Friendly · R+12
- County
- — inherits STATE
- City
- — inherits STATE
ZIP-level market 71111
- Home prices YoY
- -34.8%
- Rents YoY
- 6.6%
- Active inventory
- 421
- Price-to-rent
- 11.3×
Monthly cashflow live
- Estimated rent
- $1,953 high interval (Pro) →
- Mortgage (P&I)
- −$1,389
- Tax from tax record
- −$252 /mo · $3,030/yr
- Insurance
- −$110
- HOA
- −$145
- Vacancy / Maint / Mgmt
- −$410
- Net cashflow
- $-354
Break-even live
UW: 25.0% down · 7.5% · 30yr · 1.5% tax · 5.0% vac · 8.0% maint · 8.0% mgmt
Financing live
Cash to close
- Down payment
- $66,225
- Closing costs
- $7,947
- Reserves months
- —
- Total cash needed
- —
Loan-product check · same deal, 3 products live
Conventional
25% down · 7.5% · 30yr
- Down + closing
- —
- Monthly P&I
- —
- Monthly cashflow
- —
- DSCR
- —
- Eligible?
- —
Personal DTI + credit; lowest rate.
DSCR
20% down · 8.5% · 30yr
- Down + closing
- —
- Monthly P&I
- —
- Monthly cashflow
- —
- DSCR
- —
- Eligible?
- —
No personal income docs; deal must DSCR.
Hard money
10% down · 12.0% · 12mo
- Down + closing
- —
- Monthly P&I
- —
- Monthly cashflow
- —
- DSCR
- —
- Eligible?
- —
Short-term bridge; refi at stabilization.
Rent comps 10 comps
| Address | Beds | Baths | Sqft | Rent | $/sqft | DOM | Units | Dist |
|---|---|---|---|---|---|---|---|---|
| 3055 Vanceville Rd Bossier City, LA | 2.0–3.0 | 2.0 | 1112 | $1,875 | $1.69 | 14d | 6 | 0.17mi |
| 3283 Grand Lake Dr Bossier City, LA | 3.0 | 2.0 | 1302 | $1,950 | $1.50 | 21d | 1 | 0.67mi |
| 606 Acacia Dr Bossier City, LA | 3.0 | 2.0 | 1765 | $2,200 | $1.25 | 21d | 1 | 0.75mi |
| 3348 Grand Lake Dr Bossier City, LA | 3.0 | 2.0 | 1800 | $2,100 | $1.17 | 21d | 1 | 0.85mi |
| 90 Kingston Xing Bossier City, LA | 1.0–3.0 | 1.0–2.0 | 1150 | $1,820 | $1.58 | 14d | 14 | 0.89mi |
| 3461 Grand Cane Ln Bossier City, LA | 3.0 | 2.0 | 1297 | $2,100 | $1.62 | 14d | 1 | 0.91mi |
| 2353 Tallgrass Cir Bossier City, LA | 3.0 | 2.0 | 2007 | $2,350 | $1.17 | 21d | 1 | 1.01mi |
| 814 Abita Chase Bossier City, LA | 3.0 | 2.0 | 1881 | $2,300 | $1.22 | 14d | 1 | 1.36mi |
| 619 Labarre Ln Bossier City, LA | 3.0 | 2.0 | 1987 | $2,400 | $1.21 | 21d | 1 | 1.46mi |
| 3303 Colonial Dr Bossier City, LA | 3.0 | 2.0 | 1716 | $2,200 | $1.28 | 44d | 1 | 1.47mi |
HOA detail
- Monthly dues
- $145 · $1,740/yr
- Likely covers
- trashlandscapingsecurity
Listing history 19 events
-
2026-06-18days on market $264,900 Active 35 DOM
-
2026-06-17days on market $264,900 Active 34 DOM
-
2026-06-16days on market $264,900 Active 33 DOM
-
2026-06-15days on market $264,900 Active 32 DOM
-
2026-06-14days on market $264,900 Active 30 DOM
-
2026-06-13days on market $264,900 Active 29 DOM
-
2026-06-10days on market $264,900 Active 27 DOM
-
2026-06-09days on market $264,900 Active 26 DOM
-
2026-06-08days on market $264,900 Active 25 DOM
-
2026-06-07days on market $264,900 Active 24 DOM
-
2026-06-02days on market $264,900 Active 19 DOM
-
2026-06-01days on market $264,900 Active 18 DOM
-
2026-05-31days on market $264,900 Active 17 DOM
-
2026-05-30days on market $264,900 Active 16 DOM
-
2026-05-14$264,900 Active 978-char remark
-
2026-05-11historical
-
2025-05-23$274,900 Active
-
2019-01-24soldstatus $198,000
-
2018-11-28soldstatus $198,000
ⓘ Source: listings_history table (triggers on properties + properties_extension) + one-shot
backfill from property_details.listing_events for pre-trigger history.
Tax reassessment forecast LA · Resets to sale price
- Current annual tax
- $3,030 · $252/mo
- Projected year-2 tax
- $3,030 · $252/mo
- Expected delta
- $0/yr ($0/mo · 0.0%)
ⓘ Screening estimate from a state-policy table — verify with the county assessor before closing.
Climate risk First Street
- Flood 1/10 Low FEMA zone X (unshaded) · 0% chance over 30 yrs
- Wildfire 3/10 Moderate
- Heat 7/10 Severe 7 d/yr ≥110°F today · 23 d/yr by 30 yrs out
- Wind 6/10 Major 67% chance of damaging wind over 30 yrs
- Air quality 2/10 Low 1 unhealthy d/yr today · 1 by 30 yrs out
Nearby sold comps map
Loading sold comps map…
Walkable amenities ~0.75 mi
Loading nearby amenities…
Taxation est. · year 1
- Rental income
- $23,436
- − Mortgage interest
- −$14,839
- − Property taxes
- −$3,030
- − Insurance
- −$1,324
- − Repairs & maintenance
- −$1,875
- − Management
- −$1,875
- − HOA
- −$1,740
- − Depreciation
- −$7,706
- Taxable loss
- −$8,953
- Est. tax savings @ 24.0%
- +$2,149
- After-tax cash flow
- $-2,101/yr
For passive investors: Depreciation is non-cash, so a rental often shows a tax loss while cash-flowing — sheltering income. Rental losses are passive: they offset passive income freely, and up to $25,000/yr can offset ordinary (W-2) income if you actively participate and your MAGI is under $100k (phasing out to $0 by $150k); unused losses carry forward. On sale, claimed depreciation is recaptured at up to 25%, and gains may owe capital-gains tax (a 1031 exchange can defer both). Figures are a year-1 estimate at your 24.0% rate — not tax advice; consult a CPA.
Schools (NCES district)
- District
- Bossier Parish
- NCES district ID
- 2200270
- Math proficiency
- 40% ▼ -32.00%
- Reading proficiency
- 47% ▼ -28.00%
- Median HH income
- $51,326
- Composite
- 37.5/100
- National rank
- #4402
- State rank
- #17 of 98 in LA
Livability — Bossier City
- Score
- 71/100
- State rank
- #47
- US rank
- #7044
Category grades
Schools grade is shown separately in the Schools card above.
Census & demographics
- County
- Bossier Parish · 98,704 people
- City population
- 91,925
- Metro
- Shreveport-Bossier City, LA
- Population (ZIP)
- 43,925
- Household income
- $65,292
- Rent vs Own
- Severe rent burden
- 1942.0
Population outlook (Bossier County) Hauer SSP2
- Today (2025)
- 143,247 people
- By 2030
- 151,802 · +6.0%
- By 2040
- 168,194 · +17.4%
- By 2050
- 183,533 · +28.1%
- By 2075
- 217,009 · +51.5%
- By 2100
- 230,091 · +60.6%
Race, ethnicity, and origin ACS 2023
- Neighborhood character
- Diverse neighborhood (Simpson 0.60)
- Race & ethnicity
- White 56% Black 29% Hispanic / Latino 9% Two or more races 8% Asian 3%
- Hispanic origin (detail)
- Mexican 5%
- Common ancestry
- Lithuanian 2% Iranian 1% Slovak 1%
- Foreign-born
- 5% · Canada, Vietnam
- Languages at home
- 90% English-only · Spanish 7% Vietnamese 1% French/Haitian/Cajun 1%
Political lean MEDSL · Bossier
- 2024 margin
- Solid R (+43.3) · D 27.7% · R 71.0% · Other 1.3%
- 2008→2024 swing
- +0.3pp no change · 2008: -43.7pp · 2024: -43.3pp
- All cycles
- 2024: R+43.3 2020: R+41.0 2016: R+45.8 2012: R+45.4 2008: R+43.7
Not yet ingested
- Civics
- —
Market trends
- HPI YoY
- ▼ -79.78%
- Current HPI
- 149.4336
- Rent YoY
- ▲ 6.56%
- Metro
- Shreveport-Bossier City, LA
- State GDP YoY
- ▲ 3.29%
- F500 in state
- 10
Industry mix (Fortune 500 HQ in LA)
| Industry | F500 HQs | Revenue |
|---|---|---|
| Telecommunications | 2 | $23B |
|
||
| Utilities | 1 | $12B |
|
||
| Wholesale / Distribution | 1 | $5B |
|
||
| Advertising | 1 | $2B |
|
||
Price history
+33.8% since first listed5 events — show timeline
- 2026-05-14 Listed $264,900 NTREIS
- 2026-05-11 Listing Removed — NTREIS
- 2025-05-23 Listed $274,900 NTREIS
- 2019-01-24 Sold (Public Records) $198,000 Public Records
- 2018-11-28 Sold (Public Records) $198,000 Public Records
Property tax history
+9.1%/yrLatest (2025): $3,030 · -1.0% YoY. Source: county tax records.
Cash-flow waterfall
monthlySold comps — $/sqft
last 12 mo · ≤1 miLoading sold comps…