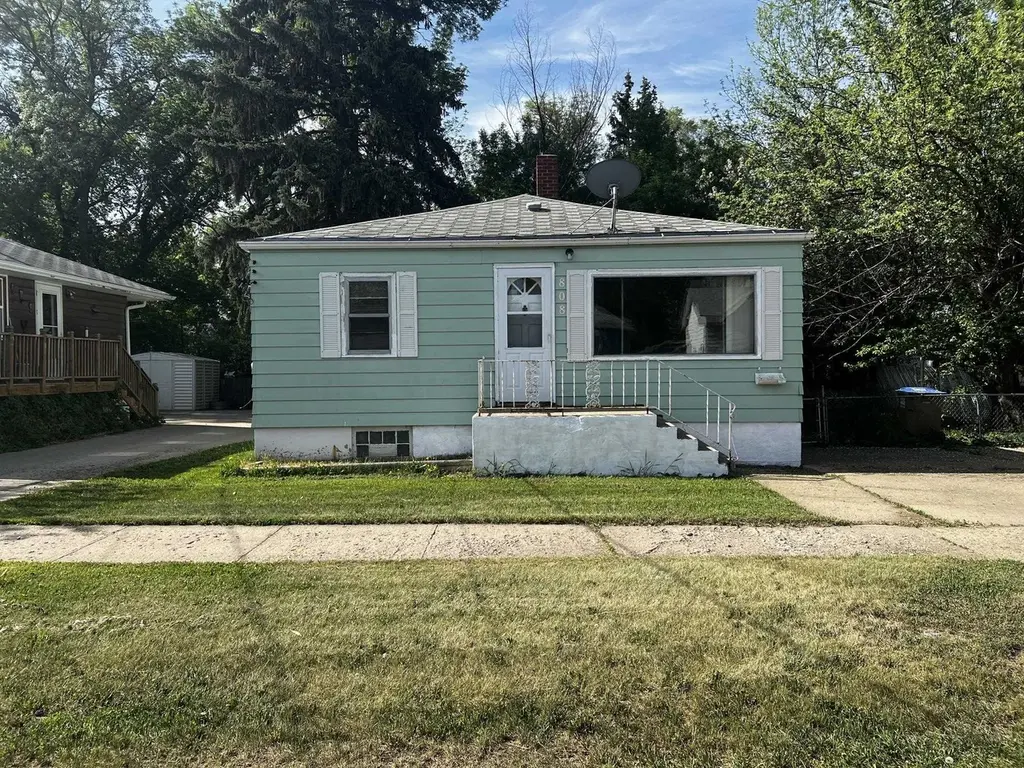
808 6th Ave NE · Minot, ND
Flood risk 1/10 · Minimal
- FEMA flood zone
- X (shaded)
- Chance of flooding over 30 yrs
- 0.0%
- Est. flood insurance / yr
- $507 – $1,088
Fire risk 2/10 · Minimal
- Est. fire insurance / yr
- $1,289 – $2,393
Heat risk 2/10 · Minimal
- Hot days now (above 95°F)
- 7 days/yr
- Hot days in 30 yrs
- 12 days/yr
Wind risk 1/10 · Minimal
- Chance of severe wind over 30 yrs
- —
Air-quality risk 5/10 · Moderate
- Unhealthy air days now
- 7 days/yr
- Unhealthy air days in 30 yrs
- 7 days/yr
Risk factors via First Street. Map © Google.
Why this score? — see what drove the C grade
The composite is a weighted blend of 9 inputs, each scored 0–100. Each bar is that input's sub-score; the figure is the points it added to the 100-point composite (weight × sub-score).
- Cash flow +18.6/30.0
- ARV discount +15.0/15.0
- DSCR +5.9/10.0
- 1% rule +4.3/10.0
- Rent growth +3.9/5.0
- Schools +3.8/10.0
- Livability +3.8/5.0
- Condition / age +2.5/5.0
- Appreciation +0.0/10.0
$127,900
🖨 Deal sheet 📄 Offer letter ✓ Due diligence
Key facts
- Functional kitchen
- Metal shed
- Fenced yard
Tags
Property features AI
Exterior
- Parking: Concrete parking
- Utilities: Public water; Public sewer
- Home design: Single-family residence; Single story
- Construction: Below-grade finished area (basement): 810; R1 zoning
- Exterior features: Shed(s)
Interior
- Kitchen: Gas oven; Gas range; Range; Oven; Refrigerator
- Heating & cooling: Forced air heating; Natural gas heating
- Interior features: Partially finished basement
Neighborhood map
What this means for you Summary
Snapshot
- This is a 2-bed/2.0-bath single-family listed at $128k.
Deal economics
- At list price, monthly cash flow is $125 ($1k/yr) — positive.
- The deal already cash-flows at list — no discount required.
- To meet the 1% rule (rent ≥ 1% of price), the offer needs to be $119k (7.2% below list).
- Recommended offer: $119k (7.2% below list) — sets the bar for 1% rule.
- Cap rate 7.5% vs local median 2.4% in Minot — top-decile yield for the area; either an underpriced asset or a hidden risk that comps aren't pricing in. Stress-test before assuming the spread holds.
Location & tenants
- Location reads 75/100 on livability (#21 in ND, #3,953 nationally) — a middle-class / working-renter tenant base. Strengths: cost of living A+, housing A+, health & safety A+; Watch: amenities F, commute F.
- Minot 1 (town): math 41% / reading 46% proficiency, ranked #24 of 53 in ND (top 45%) — families likely to look elsewhere, expect single-tenant / working-renter base with shorter leases.
- Market conditions: Rents rising fast (+5.7%/yr); 146 active listings in the ZIP; solid renter incomes; 123 units permitted in Ward County in 2024 (0 in 5+ unit buildings).
- This rent is only 17% of the median local income ($83k/yr) — well below the 30% rent-burden line; pricing power to push rent on renewal without tenant pushback.
Forward outlook
- Local home prices are declining (-3.0%/yr); year-one equity from $884 of loan paydown is wiped out by about $4k of value loss. Plan a longer hold.
- Ward County population projected at +76% by 2050 — long-run rental-demand tailwind backs the buy-and-hold thesis.
Negotiation context
- It's been on market 22 days — a 2% lower offer ($126k) is reasonable based on typical stale-listing flexibility.
Risks & watch-outs
- Watch-outs: built in 1951 — expect roof / HVAC / electrical / plumbing capex.
Questions for the listing agent
- Built in 1951 — when were the roof, HVAC, electrical panel, plumbing, and water heater last replaced?
- Is there a deadline driving the sale (1031 exchange, divorce, estate, relocation)? That informs how much negotiation room exists.
- What's the average days-on-market for RENTAL listings here right now (not sales)? A rising rental-DOM trend means longer vacancies and softer asking-rent achievability than the comps imply.
- What's the recent tenant-quality profile in this submarket — average credit score on applications, eviction rate, late-payment / NSF rate, and stable-employment percentage? A property-management company in the area should have these aggregated.
- How much new for-sale + rental construction is in the pipeline within 1–3 miles? Heavy new supply typically softens prices + rents 12–24 months out; constrained supply supports both.
Investment metrics
- 1% rule
- 0.93% ✗
- Cap rate
- 7.46%
- Cash-on-cash
- 4.18%
- DSCR
- 1.19
- GRM
- 9.0
CMA / ARV
- ARV (on-the-fly)
- $158,510
- Comps found
- 2
Show comp detail 2 sales within ~0.75 mi
| Address | Dist | Beds/Ba | Sqft | Sold | Price | $/sf | Match |
|---|---|---|---|---|---|---|---|
| 400 NE 10th Ave | 0.38mi | 1/2.0 (-1) | 1,176 (-3%) | 8mo | $78,000 | $66 | 66 |
| 1502 SE 1st Ave | 0.66mi | 2/1.0 | 1,256 (+4%) | 14mo | $164,650 | $131 | 47 |
Match score weights: distance 35% · size 25% · config 20% · recency 20%. Top-matched comps best support the ARV.
Projected returns pro-forma
-3.0% appreciation · 5.74% rent growth · sell at horizon
- IRR
- -6.9%
- Equity multiple
- 0.74×
- Total profit
- $-9,441
- Equity at exit
- $19,070
- IRR
- 5.6%
- Equity multiple
- 1.46×
- Total profit
- $16,504
- Equity at exit
- $11,058
Cash invested: $35,812 (down + closing). Projections, not guarantees.
Landlord ↔ Tenant lean methodology
- Overall (STATE)
- 82 Strongly Landlord-Friendly
- State North Dakota
- 82 Strongly Landlord-Friendly · R+20
- County
- — inherits STATE
- City
- — inherits STATE
ZIP-level market 58703
- Rents YoY
- 5.7%
- Active inventory
- 146
- Price-to-rent
- 9.0×
Monthly cashflow live
- Estimated rent
- $1,187 medium interval (Pro) →
- Mortgage (P&I)
- −$671
- Tax from tax record
- −$89 /mo · $1,068/yr
- Insurance
- −$53
- HOA
- −$0
- Vacancy / Maint / Mgmt
- −$249
- Net cashflow
- $125
Break-even live
UW: 25.0% down · 7.5% · 30yr · 1.5% tax · 5.0% vac · 8.0% maint · 8.0% mgmt
Financing live
Cash to close
- Down payment
- $31,975
- Closing costs
- $3,837
- Reserves months
- —
- Total cash needed
- —
Loan-product check · same deal, 3 products live
Conventional
25% down · 7.5% · 30yr
- Down + closing
- —
- Monthly P&I
- —
- Monthly cashflow
- —
- DSCR
- —
- Eligible?
- —
Personal DTI + credit; lowest rate.
DSCR
20% down · 8.5% · 30yr
- Down + closing
- —
- Monthly P&I
- —
- Monthly cashflow
- —
- DSCR
- —
- Eligible?
- —
No personal income docs; deal must DSCR.
Hard money
10% down · 12.0% · 12mo
- Down + closing
- —
- Monthly P&I
- —
- Monthly cashflow
- —
- DSCR
- —
- Eligible?
- —
Short-term bridge; refi at stabilization.
Listing history 16 events
-
2026-06-19days on market $127,900 Active 22 DOM
-
2026-06-18days on market $127,900 Active 21 DOM
-
2026-06-17price $127,900 Active 20 DOM
-
2026-06-17days on market $139,900 Active 20 DOM
-
2026-06-16days on market $139,900 Active 19 DOM
-
2026-06-15days on market $139,900 Active 18 DOM
-
2026-06-14days on market $139,900 Active 16 DOM
-
2026-06-12days on market $139,900 Active 15 DOM
-
2026-06-09days on market $139,900 Active 12 DOM
-
2026-06-08days on market $139,900 Active 11 DOM
-
2026-06-07days on market $139,900 Active 10 DOM
-
2026-06-02days on market $139,900 Active 5 DOM
-
2026-06-01days on market $139,900 Active 4 DOM
-
2026-05-31days on market $139,900 Active 3 DOM
-
2026-05-30days on market $139,900 Active 2 DOM
-
2026-05-28$139,900 Active
ⓘ Source: listings_history table (triggers on properties + properties_extension) + one-shot
backfill from property_details.listing_events for pre-trigger history.
Tax reassessment forecast ND · Resets to sale price
- Current annual tax
- $1,068 · $89/mo
- Projected year-2 tax
- $1,253 · $104/mo
- Expected delta
- +$185/yr (+$15/mo · 17.3%)
ⓘ Screening estimate from a state-policy table — verify with the county assessor before closing.
Climate risk First Street
- Flood 1/10 Low FEMA zone X (shaded) · 0% chance over 30 yrs
- Wildfire 2/10 Low
- Heat 2/10 Low 7 d/yr ≥95°F today · 12 d/yr by 30 yrs out
- Wind 1/10 Low
- Air quality 5/10 Major 7 unhealthy d/yr today · 7 by 30 yrs out
Nearby sold comps map
Loading sold comps map…
Walkable amenities ~0.75 mi
Loading nearby amenities…
Taxation est. · year 1
- Rental income
- $14,245
- − Mortgage interest
- −$7,164
- − Property taxes
- −$1,068
- − Insurance
- −$640
- − Repairs & maintenance
- −$1,140
- − Management
- −$1,140
- − Depreciation
- −$3,721
- Taxable loss
- −$627
- Est. tax savings @ 24.0%
- +$150
- After-tax cash flow
- $1,648/yr
For passive investors: Depreciation is non-cash, so a rental often shows a tax loss while cash-flowing — sheltering income. Rental losses are passive: they offset passive income freely, and up to $25,000/yr can offset ordinary (W-2) income if you actively participate and your MAGI is under $100k (phasing out to $0 by $150k); unused losses carry forward. On sale, claimed depreciation is recaptured at up to 25%, and gains may owe capital-gains tax (a 1031 exchange can defer both). Figures are a year-1 estimate at your 24.0% rate — not tax advice; consult a CPA.
Schools (NCES district)
- District
- Minot 1
- NCES district ID
- 3813030
- Math proficiency
- 41% ▼ -4.00%
- Reading proficiency
- 46% ▼ -1.00%
- Median HH income
- $54,224
- Composite
- 37.79/100
- National rank
- #4341
- State rank
- #24 of 53 in ND
Livability — Minot
- Score
- 75/100
- State rank
- #21
- US rank
- #3953
Category grades
Schools grade is shown separately in the Schools card above.
Census & demographics
- Census place
- Minot, ND
- County
- Ward County · 55,225 people
- City population
- 55,225
- Metro
- Minot, ND
- Population (ZIP)
- 22,139
- Household income
- $82,728
- Rent vs Own
- Severe rent burden
- 543.0
Population outlook (Ward County) Hauer SSP2
- Today (2025)
- 92,683 people
- By 2030
- 104,825 · +13.1%
- By 2040
- 131,945 · +42.4%
- By 2050
- 163,134 · +76.0%
- By 2075
- 256,561 · +176.8%
- By 2100
- 354,426 · +282.4%
Race, ethnicity, and origin ACS 2023
- Neighborhood character
- Predominantly White (79%)
- Race & ethnicity
- White 79% Hispanic / Latino 9% Two or more races 8% Black 6% Asian 1%
- Hispanic origin (detail)
- Mexican 5% Puerto Rican 1%
- Common ancestry
- Portuguese 20% Lithuanian 3% Scottish 2%
- Foreign-born
- 3% · Canada
- Languages at home
- 96% English-only · Spanish 2%
Political lean MEDSL · Ward
- 2024 margin
- Solid R (+47.4) · D 25.5% · R 72.8% · Other 1.7%
- 2008→2024 swing
- -28.2pp toward R · 2008: -19.2pp · 2024: -47.4pp
- All cycles
- 2024: R+47.4 2020: R+44.9 2016: R+47.7 2012: R+30.8 2008: R+19.2
Not yet ingested
- Civics
- —
Market trends
- HPI YoY
- ▼ -203.01%
- Current HPI
- 138.9083
- Rent YoY
- ▲ 5.74%
- Metro
- Minot, ND
- State GDP YoY
- ▲ 2.09%
- F500 in state
- 2
Industry mix (Fortune 500 HQ in ND)
| Industry | F500 HQs | Revenue |
|---|---|---|
| Utilities / Construction | 1 | $6B |
|
||
Price history
1 event — show timeline
- 2026-05-28 Listed $139,900 MMLS
Property tax history
+3.0%/yrLatest (2025): $1,068 · -8.6% YoY. Source: county tax records.
Cash-flow waterfall
monthlySold comps — $/sqft
last 12 mo · ≤1 miLoading sold comps…