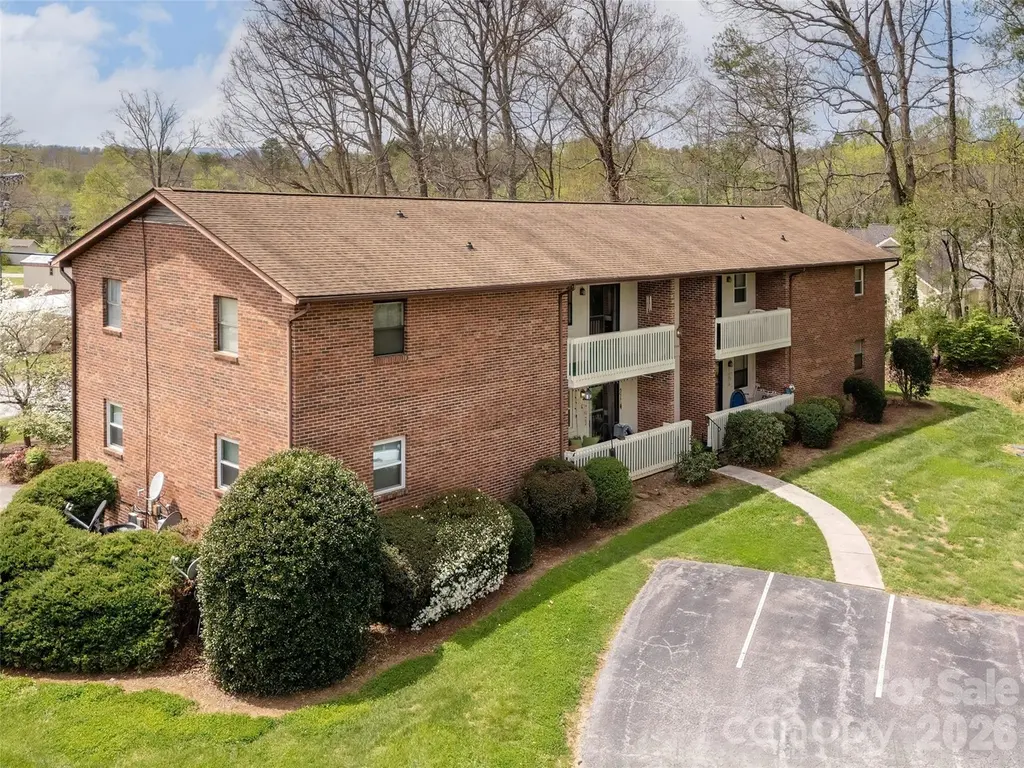
103 Oakwood Pl #4 · Mountain Home, NC
Flood risk 1/10 · Minimal
- FEMA flood zone
- X (unshaded)
- Chance of flooding over 30 yrs
- 0.0%
- Est. flood insurance / yr
- $473 – $860
Fire risk 2/10 · Minimal
- Est. fire insurance / yr
- $906 – $1,684
Heat risk 4/10 · Minor
- Hot days now (above 98°F)
- 8 days/yr
- Hot days in 30 yrs
- 21 days/yr
Wind risk 2/10 · Minimal
- Chance of severe wind over 30 yrs
- —
Air-quality risk 3/10 · Minor
- Unhealthy air days now
- 2 days/yr
- Unhealthy air days in 30 yrs
- 3 days/yr
Risk factors via First Street. Map © Google.
Why this score? — see what drove the C- grade
The composite is a weighted blend of 9 inputs, each scored 0–100. Each bar is that input's sub-score; the figure is the points it added to the 100-point composite (weight × sub-score).
- Cash flow +18.1/30.0
- ARV discount +7.5/15.0
- 1% rule +6.1/10.0
- DSCR +5.7/10.0
- Schools +4.2/10.0
- Rent growth +3.4/5.0
- Livability +3.0/5.0
- Condition / age +2.5/5.0
- Appreciation +0.0/10.0
$195,000
🖨 Deal sheet 📄 Offer letter ✓ Due diligence
Listing remarks
Enjoy a peaceful, low-maintenance lifestyle in the quiet Brookside Manor 55+ community, known for its spacious, well-kept grounds and serene atmosphere. This move-in ready condo offers both privacy and comfort, with wooded surroundings off the deck and mountain views out the rear windows. Inside, the home features an airy layout with notably large living spaces, including a generous living room, dining area, and a roomy kitchen with ample cabinetry and workspace. The primary bedroom includes a private bath and plenty of closet space, while two additional bedrooms provide flexibility for guests, hobbies, or a home office. The freshly painted interior provides updated colors and clean, well-m
Key facts
- Wooded surroundings
- Airy layout
- Ample cabinetry
Tags
Property features AI
Finance
- Other: Publicly maintained paved/asphalt roads
- HOA & community: HOA present (mandatory dues); Monthly association fee of $350; Association: Brookside Manor Retirement Community; Community is 55+ / senior community; Pets allowed conditionally (cats OK)
Exterior
- Parking: Attached garage with garage door opener (garage faces rear); 1 garage space; 1 open parking space; Additional parking space(s)
- Utilities: City water; Septic system installed
- Home design: Residential condominium; Site-built construction; Brick exterior; One story; Basement foundation; R2 zoning
- Construction: Site-built construction; Brick full exterior; Basement foundation
- Exterior features: Covered balcony; End unit with private, wooded setting and views; Green area
Interior
- Kitchen: Dishwasher; Garbage disposal; Electric oven; Electric range; Microwave; Refrigerator
- Bedrooms: 3 bedrooms (all on the main level)
- Flooring: Carpet; Vinyl; Wood
- Bathrooms: 2 full bathrooms (main level)
- Heating & cooling: Central heating (forced air, electric); Central air with heat pump; Ceiling fans
- Interior features: Insulated windows; Basement with exterior and interior entry, basement garage door, walk-out access and storage space; 6 total rooms; Entry level is 2
- Laundry & utility: Washer and dryer included; Laundry closet in hall on main level
Neighborhood map
What this means for you Summary
Snapshot
- This is a 3-bed/2.0-bath condo listed at $195k.
Deal economics
- At list price, monthly cash flow is $171 ($2k/yr) — positive.
- The deal already cash-flows at list — no discount required.
- Meets the 1% rule at list price ($2k rent vs $195k).
- Recommended offer: $183k (6.0% below list) — sets the bar for market timing.
- Cap rate 7.3% vs local median 2.7% in Mountain Home — top-decile yield for the area; either an underpriced asset or a hidden risk that comps aren't pricing in. Stress-test before assuming the spread holds.
Location & tenants
- Location reads 59/100 on livability (#550 in NC) — a working-class tenant base; expect higher turnover. Strengths: cost of living A, housing A, crime B+; Watch: employment C-, amenities F, commute F.
- Henderson County Schools (suburban): math 48% / reading 52% proficiency, ranked #64 of 178 in NC (top 36%) — acceptable for families but not a draw, mixed tenant base, ~2y average lease.
- Zoned schools: Clear Creek Elementary (math 39% / reading 44%, grade F, #673 of 1,410 statewide, top 48%, 484 students, 70% FRL); North Henderson High (math 72% / reading 58%, grade B, #161 of 535 statewide, top 30%, 1,146 students, 61% FRL) — zoned schools average 66% FRL vs 46% district-wide (19 pts higher); higher-poverty schools than district average — tighter screening recommended.
- Market conditions: Rents rising (+3.6%/yr); 364 active listings in the ZIP; 2 comparable units currently listed for rent nearby; 1,534 units permitted in Henderson County in 2024 (558 in 5+ unit buildings).
- At $2,174/mo this rent would consume 47% of the median local household income ($56k/yr) (locally 1420% of renters already pay >50% of income on rent) — very limited rent-growth headroom before tenants either downsize or default.
Forward outlook
- Local home prices are declining (-3.0%/yr); year-one equity from $1k of loan paydown is wiped out by about $6k of value loss. Plan a longer hold.
- Henderson County population projected at +20% by 2050 — long-run rental-demand tailwind backs the buy-and-hold thesis.
Negotiation context
- It's been on market 78 days — a 6% lower offer ($183k) is reasonable based on typical stale-listing flexibility.
- 6 sale attempts since 7y ago with the ask held roughly flat each time — persistent listings suggest the price (not the market) is what's stuck; bring a comps-based counter.
- Current owner paid $150k; 30% above their basis — modest negotiation headroom, anchor on the comps not their cost.
Questions for the listing agent
- It's been on market 78 days. Have you received any prior offers? Is the seller open to a 6% concession, seller financing, or rate buy-down credit?
- What does the HOA fee cover, when was the last increase, and are there any pending special assessments or reserve-fund shortfalls?
- Any open or pending special assessments — roof, HVAC, plumbing, elevator, façade? What's the per-unit balance and payoff schedule, and is the seller paying it off at close or rolling it to the buyer?
- Why hasn't it sold? Are there any deal-killer items the seller is aware of (foundation, flood, title, zoning, code violations)?
- Is there a deadline driving the sale (1031 exchange, divorce, estate, relocation)? That informs how much negotiation room exists.
- Schools are F-rated, which usually means shorter tenancies and higher turnover. Who's the typical renter profile here, and what's been the actual vacancy rate?
- What's the average days-on-market for RENTAL listings here right now (not sales)? A rising rental-DOM trend means longer vacancies and softer asking-rent achievability than the comps imply.
- What's the recent tenant-quality profile in this submarket — average credit score on applications, eviction rate, late-payment / NSF rate, and stable-employment percentage? A property-management company in the area should have these aggregated.
- How much new apartment / multifamily construction is in the pipeline within 1–3 miles? Heavy new supply (>2% of stock underway) typically softens rents 12–24 months out; light construction supports rent growth.
Investment metrics
- 1% rule
- 1.11% ✓
- Cap rate
- 7.34%
- Cash-on-cash
- 3.76%
- DSCR
- 1.17
- GRM
- 7.5
CMA / ARV
No comps found within radius.
Projected returns pro-forma
-3.0% appreciation · 3.63% rent growth · sell at horizon
- IRR
- -9.5%
- Equity multiple
- 0.65×
- Total profit
- $-19,174
- Equity at exit
- $29,075
- IRR
- 0.9%
- Equity multiple
- 1.07×
- Total profit
- $3,710
- Equity at exit
- $16,860
Cash invested: $54,600 (down + closing). Projections, not guarantees.
Landlord ↔ Tenant lean methodology
- Overall (STATE)
- 85 Strongly Landlord-Friendly
- State North Carolina
- 85 Strongly Landlord-Friendly · R+3
- County
- — inherits STATE
- City
- — inherits STATE
ZIP-level market 28792
- Rents YoY
- 3.6%
- Active inventory
- 364
- Price-to-rent
- 7.5×
Monthly cashflow live
- Estimated rent
- $2,174 medium interval (Pro) →
- Mortgage (P&I)
- −$1,023
- Tax from tax record
- −$93 /mo · $1,110/yr
- Insurance
- −$81
- HOA
- −$350
- Vacancy / Maint / Mgmt
- −$456
- Net cashflow
- $171
Break-even live
UW: 25.0% down · 7.5% · 30yr · 1.5% tax · 5.0% vac · 8.0% maint · 8.0% mgmt
Financing live
Cash to close
- Down payment
- $48,750
- Closing costs
- $5,850
- Reserves months
- —
- Total cash needed
- —
Loan-product check · same deal, 3 products live
Conventional
25% down · 7.5% · 30yr
- Down + closing
- —
- Monthly P&I
- —
- Monthly cashflow
- —
- DSCR
- —
- Eligible?
- —
Personal DTI + credit; lowest rate.
DSCR
20% down · 8.5% · 30yr
- Down + closing
- —
- Monthly P&I
- —
- Monthly cashflow
- —
- DSCR
- —
- Eligible?
- —
No personal income docs; deal must DSCR.
Hard money
10% down · 12.0% · 12mo
- Down + closing
- —
- Monthly P&I
- —
- Monthly cashflow
- —
- DSCR
- —
- Eligible?
- —
Short-term bridge; refi at stabilization.
Rent comps 2 comps
| Address | Beds | Baths | Sqft | Rent | $/sqft | DOM | Units | Dist |
|---|---|---|---|---|---|---|---|---|
| 2168 Howard Gap Rd Apt 10 Hendersonville, NC | 2.0 | 1.5 | 1200 | $1,495 | $1.25 | 23d | 1 | 0.68mi |
| 48 N Rowe Rd Hendersonville, NC | 3.0 | 2.0 | 1550 | $2,495 | $1.61 | 13d | 1 | 0.80mi |
HOA detail condo
- Monthly dues
- $350 · $4,200/yr
- Likely covers
- landscaping
- Assessments
- None detected in remarks — confirm with the listing agent.
Listing history 31 events
-
2026-06-18days on market $195,000 Active 78 DOM
-
2026-06-17days on market $195,000 Active 77 DOM
-
2026-06-16days on market $195,000 Active 76 DOM
-
2026-06-15days on market $195,000 Active 75 DOM
-
2026-06-14days on market $195,000 Active 73 DOM
-
2026-06-13days on market $195,000 Active 72 DOM
-
2026-06-10days on market $195,000 Active 70 DOM
-
2026-06-09days on market $195,000 Active 69 DOM
-
2026-06-08days on market $195,000 Active 68 DOM
-
2026-06-07days on market $195,000 Active 67 DOM
-
2026-06-05days on market $195,000 Active 64 DOM
-
2026-06-03days on market $195,000 Active 63 DOM
-
2026-06-02days on market $195,000 Active 62 DOM
-
2026-06-01days on market $195,000 Active 61 DOM
-
2026-05-31days on market $195,000 Active 60 DOM
-
2026-05-30days on market $195,000 Active 59 DOM
-
2026-04-01$195,000 Active
-
2025-10-13status Active
-
2025-10-06price $209,000
-
2025-05-09$215,000 Active
-
2024-06-18$219,000 Active
-
2024-06-17historical
-
2019-08-30soldstatus $149,900 Closed
-
2019-08-30soldstatus $150,000
-
2019-07-22historical Under Contract - Show
-
2019-07-16status Active
-
2019-07-16historical Under Contract - Show
-
2019-07-08$149,900 Active
-
2009-06-11soldstatus $92,000
-
2006-09-13soldstatus $98,000
-
2006-02-17soldstatus $90,000
ⓘ Source: listings_history table (triggers on properties + properties_extension) + one-shot
backfill from property_details.listing_events for pre-trigger history.
Tax reassessment forecast NC · Resets to sale price
- Current annual tax
- $1,110 · $93/mo
- Projected year-2 tax
- $1,599 · $133/mo
- Expected delta
- +$489/yr (+$41/mo · 44.1%)
ⓘ Screening estimate from a state-policy table — verify with the county assessor before closing.
Climate risk First Street
- Flood 1/10 Low FEMA zone X (unshaded) · 0% chance over 30 yrs
- Wildfire 2/10 Low
- Heat 4/10 Moderate 8 d/yr ≥98°F today · 21 d/yr by 30 yrs out
- Wind 2/10 Low
- Air quality 3/10 Moderate 2 unhealthy d/yr today · 3 by 30 yrs out
Nearby sold comps map
Loading sold comps map…
Walkable amenities ~0.75 mi
Loading nearby amenities…
Taxation est. · year 1
- Rental income
- $26,085
- − Mortgage interest
- −$10,923
- − Property taxes
- −$1,110
- − Insurance
- −$975
- − Repairs & maintenance
- −$2,087
- − Management
- −$2,087
- − HOA
- −$4,200
- − Depreciation
- −$5,673
- Taxable loss
- −$970
- Est. tax savings @ 24.0%
- +$233
- After-tax cash flow
- $2,283/yr
For passive investors: Depreciation is non-cash, so a rental often shows a tax loss while cash-flowing — sheltering income. Rental losses are passive: they offset passive income freely, and up to $25,000/yr can offset ordinary (W-2) income if you actively participate and your MAGI is under $100k (phasing out to $0 by $150k); unused losses carry forward. On sale, claimed depreciation is recaptured at up to 25%, and gains may owe capital-gains tax (a 1031 exchange can defer both). Figures are a year-1 estimate at your 24.0% rate — not tax advice; consult a CPA.
Schools (NCES district)
- District
- Henderson County Schools
- NCES district ID
- 3702100
- Math proficiency
- 48% ▼ -2.00%
- Reading proficiency
- 52% ▼ -2.00%
- Median HH income
- $47,101
- Composite
- 42.5/100
- National rank
- #3206
- State rank
- #64 of 178 in NC
Livability — Mountain Home
- Score
- 59/100
- State rank
- #550
- US rank
- #20251
Category grades
Schools grade is shown separately in the Schools card above.
Census & demographics
- County
- Henderson County · 78,587 people
- City population
- 43
- Metro
- Asheville, NC
- Population (ZIP)
- 36,645
- Household income
- $55,522
- Rent vs Own
- Severe rent burden
- 1420.0
Population outlook (Henderson County) Hauer SSP2
- Today (2025)
- 124,075 people
- By 2030
- 129,690 · +4.5%
- By 2040
- 139,898 · +12.8%
- By 2050
- 148,298 · +19.5%
- By 2075
- 163,980 · +32.2%
- By 2100
- 166,962 · +34.6%
Race, ethnicity, and origin ACS 2023
- Neighborhood character
- Predominantly White (72%)
- Race & ethnicity
- White 72% Hispanic / Latino 20% Two or more races 8% Black 4% Native American 1%
- Hispanic origin (detail)
- Mexican 15% Puerto Rican 1%
- Common ancestry
- Slovak 3% Serbian 2% Lithuanian 2%
- Foreign-born
- 10% · Canada, Jamaica
- Languages at home
- 82% English-only · Spanish 16%
Political lean MEDSL · Henderson
- 2024 margin
- R (+14.6) · D 42.1% · R 56.7% · Other 1.1%
- 2008→2024 swing
- +6.5pp toward D · 2008: -21.0pp · 2024: -14.6pp
- All cycles
- 2024: R+14.6 2020: R+18.8 2016: R+27.9 2012: R+27.6 2008: R+21.0
Not yet ingested
- Civics
- —
Market trends
- HPI YoY
- ▼ -174.29%
- Current HPI
- 214.0215
- Rent YoY
- ▲ 3.63%
- Metro
- Asheville, NC
- State GDP YoY
- ▲ 3.28%
- F500 in state
- 26
Industry mix (Fortune 500 HQ in NC)
| Industry | F500 HQs | Revenue |
|---|---|---|
| Financial Services | 2 | $213B |
|
||
| Retail | 2 | $95B |
|
||
| Industrial Conglomerate | 1 | $38B |
|
||
| Metals / Steel | 1 | $35B |
|
||
| Utilities | 1 | $30B |
|
||
| Industrial Machinery | 1 | $19B |
|
||
Price history
+116.7% since first listed15 events — show timeline
- 2026-04-01 Listed $195,000 CANOPYMLS as Distributed by MLS Grid
- 2025-10-13 Relisted — CANOPYMLS as Distributed by MLS Grid
- 2025-10-06 Price Changed $209,000 CANOPYMLS as Distributed by MLS Grid
- 2025-05-09 Listed $215,000 CANOPYMLS as Distributed by MLS Grid
- 2024-06-18 Listed $219,000 CANOPYMLS as Distributed by MLS Grid
- 2024-06-17 Coming Soon — CANOPYMLS as Distributed by MLS Grid
- 2019-08-30 Sold (Public Records) $150,000 Public Records
- 2019-08-30 Sold (MLS) $149,900 CANOPYMLS as Distributed by MLS Grid
- 2019-07-22 Contingent — CANOPYMLS as Distributed by MLS Grid
- 2019-07-16 Relisted — CANOPYMLS as Distributed by MLS Grid
- 2019-07-16 Contingent — CANOPYMLS as Distributed by MLS Grid
- 2019-07-08 Listed $149,900 CANOPYMLS as Distributed by MLS Grid
- 2009-06-11 Sold (Public Records) $92,000 Public Records
- 2006-09-13 Sold (Public Records) $98,000 Public Records
- 2006-02-17 Sold (Public Records) $90,000 Public Records
Property tax history
+5.6%/yrLatest (2025): $1,110 · +0.0% YoY. Source: county tax records.
Cash-flow waterfall
monthlySold comps — $/sqft
last 12 mo · ≤1 miLoading sold comps…