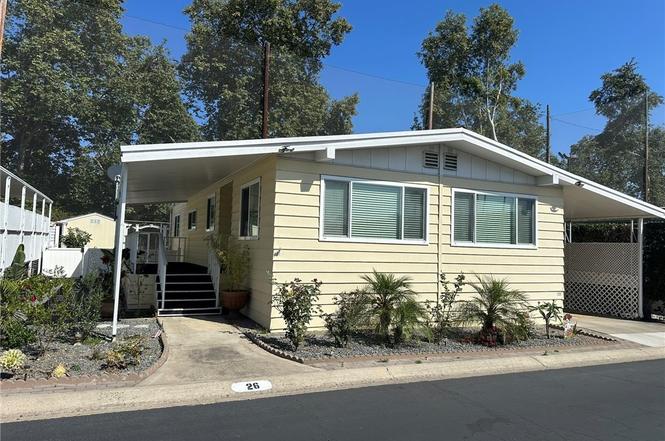
24921 Muirlands #26 · Lake Forest, CA
Flood risk 1/10 · Minimal
- FEMA flood zone
- X (unshaded)
- Chance of flooding over 30 yrs
- 0.0%
- Est. flood insurance / yr
- $507 – $1,088
Fire risk 1/10 · Minimal
- Est. fire insurance / yr
- $659 – $1,223
Heat risk 5/10 · Moderate
- Hot days now (above 91°F)
- 7 days/yr
- Hot days in 30 yrs
- 22 days/yr
Wind risk 1/10 · Minimal
- Chance of severe wind over 30 yrs
- —
Air-quality risk 4/10 · Minor
- Unhealthy air days now
- 4 days/yr
- Unhealthy air days in 30 yrs
- 5 days/yr
Risk factors via First Street. Map © Google.
Why this score? — see what drove the C+ grade
The composite is a weighted blend of 9 inputs, each scored 0–100. Each bar is that input's sub-score; the figure is the points it added to the 100-point composite (weight × sub-score).
- Cash flow +29.5/30.0
- DSCR +10.0/10.0
- 1% rule +8.3/10.0
- Schools +5.6/10.0
- Livability +3.2/5.0
- Rent growth +3.1/5.0
- Condition / age +2.5/5.0
- ARV discount +0.0/15.0
- Appreciation +0.0/10.0
$249,000
🖨 Deal sheet 📄 Offer letter ✓ Due diligence
Listing remarks MLS
Senior park space rent is $1,341/Mo. GOLF COURSE VIEW. . Backs to golf course with patio, deck and fenced in yard, great for entertaining or just chill out and watch the golfers. New roof, EQ. Bracing, Laminate flooring, great room, the kitchen has a range, microwave hood, farmhouse sink and composite countertops. 2 bedroom 2 bath, 1344 S. F. The yard has a raised bed planter an orange & apricot tree and a Tuff Shed.
Key facts
- Laminated flooring
- Large closet
- Large living room
Tags
Property features AI
Finance
- Other: Park name: El Toro Estates; Manager approval required for sale
- Financial info: Land lease
- HOA & community: Senior community; Community amenities include card room, gym/exercise room, pool, clubhouse, banquet facilities, and spa; Street lighting
Exterior
- Parking: Covered carport (2 spaces)
- Utilities: Public sewer; Natural gas connected; Sewer connected
- Home design: Single-story; Entry at main level; Mobile home (24' x 60') — mobile home remains; Has a view
- Construction: Vinyl and chain link fencing
- Exterior features: Covered front porch; Community pool; Close to clubhouse; One shed on the property
Interior
- Kitchen: Gas range; Dishwasher
- Bedrooms: All bedrooms on one level
- Flooring: Laminated flooring
- Bathrooms: 1 full bathroom; 1 three-quarter bathroom; Bathtub; Double sinks in master bath
- Heating & cooling: Central furnace heating; Central cooling
- Interior features: Ceiling fan; Double pane windows; Community spa
- Laundry & utility: Laundry in an individual room
Neighborhood map
What this means for you Summary
Snapshot
- This is a 2-bed/2.0-bath manufactured listed at $249k.
Deal economics
- At list price, monthly cash flow is $891 ($11k/yr) — positive.
- The deal already cash-flows at list — no discount required.
- Meets the 1% rule at list price ($3k rent vs $249k).
- Cap rate 10.6% vs local median 2.1% in Lake Forest — top-decile yield for the area; either an underpriced asset or a hidden risk that comps aren't pricing in. Stress-test before assuming the spread holds.
Location & tenants
- Location reads 65/100 on livability (#387 in CA) — a middle-class / working-renter tenant base. Strengths: crime A+, employment A+, housing B; Watch: commute C-, amenities F, cost of living F.
- Saddleback Valley Unified (suburban): math 51% / reading 73% proficiency, ranked #67 of 517 in CA (top 13%) — acceptable for families but not a draw, mixed tenant base, ~2y average lease.
- Market conditions: Rents rising (+2.5%/yr); 205 active listings in the ZIP; 40 comparable units currently listed for rent nearby; rentals at typical pace (median 25d on market — plan ~3-4 weeks tenant-placement turnaround); high-income renter base; 6,974 units permitted in Orange County in 2024 (3,839 in 5+ unit buildings).
- This rent runs 32% of the median local income ($126k/yr) — at the standard rent-burdened threshold; future hikes will face affordability resistance.
Forward outlook
- Local home prices are declining (-3.0%/yr); year-one equity from $2k of loan paydown is wiped out by about $7k of value loss. Plan a longer hold.
- Orange County population projected at +14% by 2050 — modest demand growth; plan on rents tracking national, not racing it.
- At projected returns (-3.0% appreciation + 2.5% rent growth), your $70k cash investment doubles in ~9 years — after that, you're playing with house money.
Negotiation context
- Only 10 days on market — expect competitive offers; lowballing is unlikely to land.
- 5 sale attempts since 18y ago with the ask held roughly flat each time — persistent listings suggest the price (not the market) is what's stuck; bring a comps-based counter.
- Current owner paid $129k; list at $249k implies a 93% gain — meaningful room to come down on a strong offer.
Risks & watch-outs
- Climate carrying-cost: extreme-heat days projected 7→22/yr by 2055 (HVAC capex compounding) — expect insurance premiums to compound above CPI over the hold.
Questions for the listing agent
- Built in 1974 — when were the roof, HVAC, electrical panel, plumbing, and water heater last replaced?
- Is there a deadline driving the sale (1031 exchange, divorce, estate, relocation)? That informs how much negotiation room exists.
- Schools are B-rated — typically a magnet for longer-tenancy family renters. What's the average tenant stay here, and is there a school-zone premium baked into asking?
- What's the average days-on-market for RENTAL listings here right now (not sales)? A rising rental-DOM trend means longer vacancies and softer asking-rent achievability than the comps imply.
- What's the recent tenant-quality profile in this submarket — average credit score on applications, eviction rate, late-payment / NSF rate, and stable-employment percentage? A property-management company in the area should have these aggregated.
- How much new for-sale + rental construction is in the pipeline within 1–3 miles? Heavy new supply typically softens prices + rents 12–24 months out; constrained supply supports both.
Investment metrics
- 1% rule
- 1.33% ✓
- Cap rate
- 10.59%
- Cash-on-cash
- 15.33%
- DSCR
- 1.68
- GRM
- 6.3
CMA / ARV
- ARV (on-the-fly)
- $172,032
- Comps found
- 12
Show comp detail 12 sales within ~0.75 mi
| Address | Dist | Beds/Ba | Sqft | Sold | Price | $/sf | Match |
|---|---|---|---|---|---|---|---|
| 24921 Muirlands Blvd #28 | 0.00mi | 2/2.0 | 1,440 (+7%) | 1mo | $170,000 | $118 | 87 |
| 24921 Muirlands Blvd #11 | 0.07mi | 2/2.0 | 1,344 (0%) | 14mo | $149,900 | $112 | 85 |
| 24921 Muirlands Blvd #209 | 0.07mi | 2/2.0 | 1,440 (+7%) | 1mo | $152,500 | $106 | 84 |
| 24921 Muirlands Blvd #265 | 0.07mi | 2/2.0 | 1,440 (+7%) | 2mo | $185,000 | $128 | 83 |
| 24921 Muirlands #13 | 0.07mi | 2/2.0 | 1,440 (+7%) | 4mo | $175,000 | $122 | 82 |
| 24921 Muirlands Blvd Spc 114 | 0.00mi | 2/2.0 | 1,440 (+7%) | 10mo | $207,000 | $144 | 80 |
| 24921 Muirlands Blvd #23 | 0.07mi | 2/2.0 | 1,488 (+11%) | 2mo | $199,000 | $134 | 77 |
| 24921 Muirlands Blvd #113 | 0.00mi | 2/2.0 | 1,440 (+7%) | 13mo | $205,000 | $142 | 77 |
| 24921 Muirlands Blvd #303 | 0.07mi | 2/2.0 | 1,440 (+7%) | 12mo | $240,000 | $167 | 75 |
| 24921 Muirlands Blvd #270 | 0.07mi | 2/2.0 | 1,440 (+7%) | 13mo | $159,000 | $110 | 74 |
| 24921 Muirlands Blvd #140 | 0.07mi | 2/2.0 | 1,444 (+7%) | 13mo | $155,000 | $107 | 73 |
| 24701 Raymond Way #39 | 0.50mi | 2/2.0 | 1,440 (+7%) | 5mo | $202,500 | $141 | 61 |
Match score weights: distance 35% · size 25% · config 20% · recency 20%. Top-matched comps best support the ARV.
Projected returns pro-forma
-3.0% appreciation · 2.51% rent growth · sell at horizon
- IRR
- 5.5%
- Equity multiple
- 1.21×
- Total profit
- $14,812
- Equity at exit
- $37,127
- IRR
- 14.5%
- Equity multiple
- 2.14×
- Total profit
- $79,563
- Equity at exit
- $21,529
Cash invested: $69,720 (down + closing). Projections, not guarantees.
Landlord ↔ Tenant lean methodology
- Overall (STATE)
- 18 Strongly Tenant-Friendly
- State California
- 18 Strongly Tenant-Friendly · D+13
- County
- — inherits STATE
- City
- — inherits STATE
ZIP-level market 92630
- Rents YoY
- 2.5%
- Active inventory
- 205
- Price-to-rent
- 6.3×
Monthly cashflow live
- Estimated rent
- $3,306 high interval (Pro) →
- Mortgage (P&I)
- −$1,306
- Tax est. 1.5%
- −$311 /mo · $3,735/yr
- Insurance
- −$104
- HOA
- −$0
- Vacancy / Maint / Mgmt
- −$694
- Net cashflow
- $891
Break-even live
UW: 25.0% down · 7.5% · 30yr · 1.5% tax · 5.0% vac · 8.0% maint · 8.0% mgmt
Financing live
Cash to close
- Down payment
- $62,250
- Closing costs
- $7,470
- Reserves months
- —
- Total cash needed
- —
Loan-product check · same deal, 3 products live
Conventional
25% down · 7.5% · 30yr
- Down + closing
- —
- Monthly P&I
- —
- Monthly cashflow
- —
- DSCR
- —
- Eligible?
- —
Personal DTI + credit; lowest rate.
DSCR
20% down · 8.5% · 30yr
- Down + closing
- —
- Monthly P&I
- —
- Monthly cashflow
- —
- DSCR
- —
- Eligible?
- —
No personal income docs; deal must DSCR.
Hard money
10% down · 12.0% · 12mo
- Down + closing
- —
- Monthly P&I
- —
- Monthly cashflow
- —
- DSCR
- —
- Eligible?
- —
Short-term bridge; refi at stabilization.
Rent comps 40 comps
| Address | Beds | Baths | Sqft | Rent | $/sqft | DOM | Units | Dist |
|---|---|---|---|---|---|---|---|---|
| 23250 Orange Ave Lake Forest, CA | 2.0 | 2.0 | 947 | $2,995 | $3.16 | 24d | 1 | 0.19mi |
| 25092 Farthing St Lake Forest, CA | 1.0–2.0 | 1.0–2.0 | 881 | $3,303 | $3.75 | 3d | 5 | 0.54mi |
| 6 Quinn Way Mission Viejo, CA | 3.0 | 3.5 | 1716 | $4,100 | $2.39 | 20d | 1 | 0.63mi |
| 62 Aliso Ridge Loop Mission Viejo, CA | 2.0 | 2.5 | 1560 | $3,795 | $2.43 | 24d | 1 | 0.64mi |
| 23151 Los Alisos Blvd Mission Viejo, CA | 1.0–3.0 | 1.0–2.0 | 1091 | $2,654 | $2.43 | 2d | 1 | 0.78mi |
| 24621 Overlake Dr Lake Forest, CA | 3.0 | 2.0 | 1677 | $4,350 | $2.59 | 24d | 1 | 0.90mi |
| 24391 Avenida de la Carlota Laguna Hills, CA | 1.0–2.0 | 1.0–2.0 | 957 | $3,965 | $4.14 | 1d | 18 | 1.04mi |
| 26075 Las Flores Unit b Mission Viejo, CA | 2.0 | 1.5 | 989 | $3,200 | $3.24 | 15d | 1 | 1.05mi |
| 22835 Islamare Ln Lake Forest, CA | 3.0 | 2.5 | 1860 | $6,600 | $3.55 | 12d | 1 | 1.06mi |
| 24246 Swiftriver Ct Lake Forest, CA | 1.0 | 1.5 | 905 | $2,750 | $3.04 | 24d | 1 | 1.09mi |
| 24241 Swiftriver Ct Lake Forest, CA | 1.0 | 1.5 | 905 | $2,850 | $3.15 | 43d | 1 | 1.09mi |
| 26037 Via Pera Unit K4 Mission Viejo, CA | 2.0 | 1.0 | 932 | $3,387 | $3.63 | 43d | 1 | 1.10mi |
| 22892 Plainview Cir Lake Forest, CA | 3.0 | 2.0 | 1836 | $5,400 | $2.94 | 43d | 1 | 1.15mi |
| 22602 Cottonwood Cir Lake Forest, CA | 3.0 | 2.0 | 1301 | $4,250 | $3.27 | 43d | 1 | 1.16mi |
| 26191 Sanz Unit D Mission Viejo, CA | 2.0 | 2.5 | 1000 | $3,250 | $3.25 | 20d | 1 | 1.18mi |
| 24555 Los Alisos Blvd Laguna Hills, CA | 2.0 | 2.0 | 1007 | $3,356 | $3.33 | 43d | 1 | 1.20mi |
| 24555 Los Alisos Blvd Laguna Hills, CA | 2.0 | 2.0 | 1014 | $3,250 | $3.21 | 15d | 1 | 1.20mi |
| 23333 Ridge Route Dr Lake Forest, CA | 1.0–2.0 | 1.0–2.0 | 892 | $3,100 | $3.47 | 2d | 9 | 1.24mi |
| 132 Avenida Majorca Unit B Laguna Woods, CA | 2.0 | 1.0 | 995 | $2,400 | $2.41 | 6d | 1 | 1.29mi |
| 158 Avenida Majorca Unit D Laguna Woods, CA | 2.0 | 1.0 | 1300 | $3,200 | $2.46 | 43d | 1 | 1.31mi |
| 22700 Lake Forest Dr Lake Forest, CA | 1.0–3.0 | 1.0–2.0 | 1008 | $3,248 | $3.22 | 4d | 1 | 1.32mi |
| 24151 El Tiradore Cir Mission Viejo, CA | 1.0 | 1.0 | 1050 | $2,550 | $2.43 | 4d | 1 | 1.33mi |
| 169 Avenida Majorca Unit B Laguna Woods, CA | 3.0 | 1.0 | 1200 | $1,400 | $1.17 | 43d | 1 | 1.36mi |
| 170 Avenida Majorca Unit D Laguna Woods, CA | 2.0 | 1.0 | 1000 | $2,500 | $2.50 | 24d | 1 | 1.37mi |
| 25885 Trabuco Rd #98 Lake Forest, CA | 2.0 | 1.5 | 1190 | $3,300 | $2.77 | 11d | 1 | 1.39mi |
| 24299 Paseo De Valencia Laguna Woods, CA | 2.0 | 2.0 | 1347 | $3,770 | $2.80 | 22d | 7 | 1.41mi |
| 205 Avenida Majorca Unit A Laguna Woods, CA | 2.0 | 2.0 | 1278 | $3,600 | $2.82 | 43d | 1 | 1.42mi |
| 254 Calle Aragon Unit D Laguna Woods, CA | 2.0 | 2.0 | 1009 | $3,000 | $2.97 | 17d | 1 | 1.43mi |
| 2022 Via Mariposa E Unit B Laguna Woods, CA | 2.0 | 2.0 | 1325 | $3,200 | $2.42 | 18d | 1 | 1.43mi |
| 74 Calle Aragon Unit A Laguna Woods, CA | 2.0 | 1.0 | 950 | $2,700 | $2.84 | 24d | 1 | 1.44mi |
| 2369 Via Mariposa E Unit 3H Laguna Woods, CA | 3.0 | 3.0 | 1663 | $3,750 | $2.25 | 43d | 1 | 1.45mi |
| 2369 Via Mariposa E Unit 1B Laguna Woods, CA | 2.0 | 2.0 | 1340 | $2,950 | $2.20 | 43d | 1 | 1.45mi |
| 2269 Via Puerta Unit N Laguna Woods, CA | 2.0 | 2.0 | 1057 | $2,700 | $2.55 | 18d | 1 | 1.45mi |
| 969 Calle Aragon Unit 1B Laguna Woods, CA | 2.0 | 2.0 | 1195 | $2,900 | $2.43 | 24d | 1 | 1.46mi |
| 25885 Trabuco Rd #235 Lake Forest, CA | 2.0 | 1.5 | 1190 | $2,980 | $2.50 | 24d | 1 | 1.46mi |
| 221 Avenida Majorca Unit D Laguna Woods, CA | 2.0 | 2.0 | 1438 | $3,200 | $2.23 | 24d | 1 | 1.46mi |
| 224 Avenida Majorca Unit B Laguna Woods, CA | 2.0 | 2.0 | 1009 | $2,600 | $2.58 | 43d | 1 | 1.46mi |
| 2022 Via Mariposa E Unit D Laguna Woods, CA | 2.0 | 2.0 | 1305 | $4,000 | $3.07 | 43d | 1 | 1.47mi |
| 2293 Via Puerta Unit O Laguna Woods, CA | 2.0 | 2.0 | 1057 | $3,100 | $2.93 | 18d | 1 | 1.48mi |
| 29 Calle Aragon Unit Q Laguna Woods, CA | 2.0 | 2.0 | 1040 | $3,100 | $2.98 | 43d | 1 | 1.49mi |
Listing history 7 events
-
2026-06-18days on market $249,000 Active 10 DOM
-
2026-06-17days on market $249,000 Active 9 DOM
-
2026-06-16days on market $249,000 Active 8 DOM
-
2026-06-15days on market $249,000 Active 7 DOM
-
2026-06-13days on market $249,000 Active 5 DOM
-
2026-06-13remarks 699-char remark
-
2026-06-13$249,000 Active 4 DOM
ⓘ Source: listings_history table (triggers on properties + properties_extension) + one-shot
backfill from property_details.listing_events for pre-trigger history.
Climate risk First Street
- Flood 1/10 Low FEMA zone X (unshaded) · 0% chance over 30 yrs
- Wildfire 1/10 Low
- Heat 5/10 Major 7 d/yr ≥91°F today · 22 d/yr by 30 yrs out
- Wind 1/10 Low
- Air quality 4/10 Moderate 4 unhealthy d/yr today · 5 by 30 yrs out
Nearby sold comps map
Loading sold comps map…
Walkable amenities ~0.75 mi
Loading nearby amenities…
Taxation est. · year 1
- Rental income
- $39,669
- − Mortgage interest
- −$13,948
- − Property taxes
- −$3,735
- − Insurance
- −$1,245
- − Repairs & maintenance
- −$3,174
- − Management
- −$3,174
- − Depreciation
- −$7,244
- Taxable income
- $7,150
- Est. tax owed @ 24.0%
- −$1,716
- After-tax cash flow
- $8,973/yr
For passive investors: Depreciation is non-cash, so a rental often shows a tax loss while cash-flowing — sheltering income. Rental losses are passive: they offset passive income freely, and up to $25,000/yr can offset ordinary (W-2) income if you actively participate and your MAGI is under $100k (phasing out to $0 by $150k); unused losses carry forward. On sale, claimed depreciation is recaptured at up to 25%, and gains may owe capital-gains tax (a 1031 exchange can defer both). Figures are a year-1 estimate at your 24.0% rate — not tax advice; consult a CPA.
Schools (NCES district)
- District
- Saddleback Valley Unified
- NCES district ID
- 0633860
- Math proficiency
- 51% ▼ -2.00%
- Reading proficiency
- 73% ▲ 9.00%
- Median HH income
- $85,577
- Composite
- 56.05/100
- National rank
- #1185
- State rank
- #67 of 517 in CA
Livability — Lake Forest
- Score
- 65/100
- State rank
- #387
- US rank
- #13130
Category grades
Schools grade is shown separately in the Schools card above.
Census & demographics
- Census place
- Lake Forest, CA
- County
- Orange County · 3,096,323 people
- City population
- 80,019
- Metro
- Los Angeles-Long Beach-Anaheim, CA
- Population (ZIP)
- 67,152
- Household income
- $125,853
- Rent vs Own
- Severe rent burden
- 2412.0
Population outlook (Orange County) Hauer SSP2
- Today (2025)
- 3,477,456 people
- By 2030
- 3,613,117 · +3.9%
- By 2040
- 3,835,945 · +10.3%
- By 2050
- 3,968,736 · +14.1%
- By 2075
- 4,097,053 · +17.8%
- By 2100
- 3,903,633 · +12.3%
Race, ethnicity, and origin ACS 2023
- Neighborhood character
- Diverse neighborhood (Simpson 0.67)
- Race & ethnicity
- White 47% Hispanic / Latino 27% Asian 19% Two or more races 16% Black 2% Native American 1%
- Hispanic origin (detail)
- Mexican 21%
- Common ancestry
- Slovak 2% Lithuanian 2% Romanian 2%
- Foreign-born
- 28% · Canada, China, Vietnam
- Languages at home
- 62% English-only · Spanish 18% Chinese 4% Other Indo-European 4%
Political lean MEDSL · Orange
- 2024 margin
- Toss-up / Even · D 49.7% · R 47.1% · Other 3.2%
- 2008→2024 swing
- +5.2pp toward D · 2008: -2.6pp · 2024: 2.6pp
- All cycles
- 2024: D+2.6 2020: D+9.0 2016: D+7.7 2012: R+8.3 2008: R+2.6
Not yet ingested
- Civics
- —
Market trends
- HPI YoY
- ▼ -866.99%
- Current HPI
- 436.6189
- Rent YoY
- ▲ 2.51%
- Metro
- Los Angeles-Long Beach-Anaheim, CA
- State GDP YoY
- ▲ 3.21%
- F500 in state
- 116
Industry mix (Fortune 500 HQ in CA)
| Industry | F500 HQs | Revenue |
|---|---|---|
| Technology | 27 | $1,492B |
|
||
| Financial Services | 3 | $174B |
|
||
| Retail | 3 | $44B |
|
||
| Insurance | 3 | $26B |
|
||
| Media / Entertainment | 2 | $115B |
|
||
| Pharmaceuticals / Biotech | 2 | $62B |
|
||
Price history
+330.1% since first listed14 events — show timeline
- 2026-06-08 Listed $249,000 CRMLS
- 2021-12-07 Sold (MLS) $129,000 CRMLS
- 2021-11-05 Contingent — CRMLS
- 2021-10-26 Listed $129,000 CRMLS
- 2013-03-11 Sold (MLS) $38,000 CRMLS
- 2013-01-25 Pending — CRMLS
- 2013-01-15 Listed $50,000 CRMLS
- 2012-05-24 Listing Removed — CRMLS
- 2012-04-03 Listed $72,000 CRMLS
- 2010-08-08 Listing Removed — CRMLS
- 2010-03-16 Price Changed $39,900 CRMLS
- 2009-12-04 Price Changed $49,900 CRMLS
- 2009-11-20 Price Changed $53,000 CRMLS
- 2008-11-24 Listed $57,900 CRMLS
Property tax history
+10.6%/yrLatest (2025): $81 · -0.1% YoY. Source: county tax records.
Cash-flow waterfall
monthlySold comps — $/sqft
last 12 mo · ≤1 miLoading sold comps…