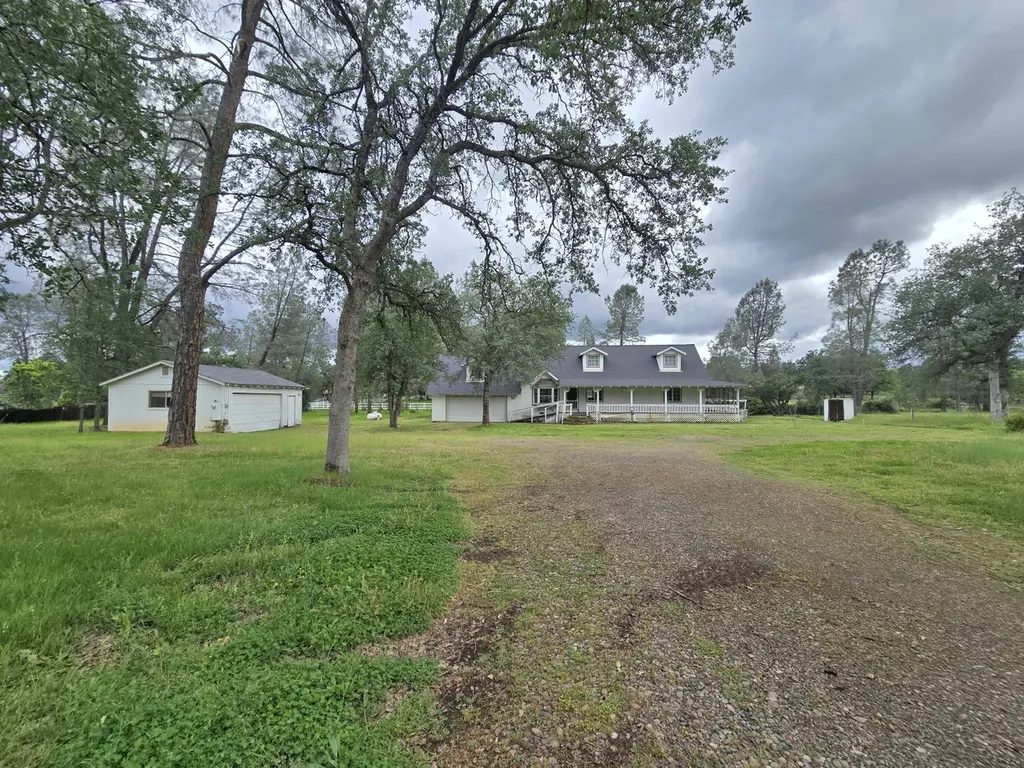
16041 Setting Sun Dr · Happy Valley, CA
Flood risk 1/10 · Minimal
- FEMA flood zone
- X (unshaded)
- Chance of flooding over 30 yrs
- 0.0%
- Est. flood insurance / yr
- $507 – $1,088
Fire risk 10/10 · Severe
- Est. fire insurance / yr
- $659 – $1,223
Heat risk 8/10 · Major
- Hot days now (above 104°F)
- 7 days/yr
- Hot days in 30 yrs
- 16 days/yr
Wind risk 1/10 · Minimal
- Chance of severe wind over 30 yrs
- —
Air-quality risk 10/10 · Severe
- Unhealthy air days now
- 35 days/yr
- Unhealthy air days in 30 yrs
- 38 days/yr
Risk factors via First Street. Map © Google.
Why this score? — see what drove the D+ grade
The composite is a weighted blend of 9 inputs, each scored 0–100. Each bar is that input's sub-score; the figure is the points it added to the 100-point composite (weight × sub-score).
- ARV discount +15.0/15.0
- Cash flow +14.9/30.0
- DSCR +4.6/10.0
- 1% rule +3.5/10.0
- Rent growth +2.5/5.0
- Livability +2.5/5.0
- Condition / age +2.5/5.0
- Schools +2.1/10.0
- Appreciation +0.0/10.0
$190,000
🖨 Deal sheet (PDF) 📄 Offer letter ✓ Due diligence
Listing remarks
This comfortable ranch-style home features practical single-story living with well-appointed rooms. The functional layout creates seamless transitions throughout, ideal for daily life and entertaining. This country home features two comfortable bedrooms and two full bathrooms, providing convenient living for its next owners. The single-level design offers easy accessibility throughout the residence. The property showcases excellent curb appeal and sits back off the road in a tranquil, park-like setting. Both attached and detached garage spaces provide versatile storage and vehicle protection options. The home's position creates a sense of privacy while maintaining accessibility. Located in
Key facts
- Functional layout
- Versatile storage
- Single story living
Tags
Neighborhood map
What this means for you Summary
Snapshot
- This is a 2-bed/2.0-bath single-family listed at $190k.
Deal economics
- At list price, monthly cash flow is $55 ($665/yr) — positive.
- The deal already cash-flows at list — no discount required.
- To meet the 1% rule (rent ≥ 1% of price), the offer needs to be $162k (14.9% below list).
- Recommended offer: $162k (14.9% below list) — sets the bar for 1% rule.
- Cap rate 6.6% vs local median 3.4% in Happy Valley — top-decile yield for the area; either an underpriced asset or a hidden risk that comps aren't pricing in. Stress-test before assuming the spread holds.
Location & tenants
- Location reads: area grade D — affects rentability + tenant quality, not the cash-flow math above.
- Happy Valley Union Elementary (rural): math 22% / reading 26% proficiency, ranked #414 of 517 in CA (top 80%) — low school quality limits family demand, transient renter base, plan for 1-2y turnover.
- Zoned schools: Happy Valley Primary (math 34% / reading 44%, grade F, #621 of 1,571 statewide, top 42%, 228 students, 65% FRL); Happy Valley Elementary (math 20% / reading 24%, grade F, #388 of 498 statewide, top 80%, 247 students, 62% FRL).
- Market conditions: 231 active listings in the ZIP; 246 units permitted in Shasta County in 2024 (0 in 5+ unit buildings).
- This rent runs 32% of the median local income ($61k/yr) — at the standard rent-burdened threshold; future hikes will face affordability resistance.
Forward outlook
- Local home prices are declining (-3.0%/yr); year-one equity from $1k of loan paydown is wiped out by about $6k of value loss. Plan a longer hold.
- Shasta County population projected to shrink 9% by 2050 — rents likely to lag national; underwrite the cash flow, not the appreciation.
Negotiation context
- Only 5 days on market — expect competitive offers; lowballing is unlikely to land.
- Current owner paid $46k; list at $190k implies a 313% gain — meaningful room to come down on a strong offer.
Risks & watch-outs
- Climate carrying-cost: severe wildfire risk; extreme-heat days projected 7→16/yr by 2055 (HVAC capex compounding) — expect insurance premiums to compound above CPI over the hold.
Questions for the listing agent
- Is there a deadline driving the sale (1031 exchange, divorce, estate, relocation)? That informs how much negotiation room exists.
- The area grade is low — what's the realistic commute time and amenity access for the typical tenant pool here? Any planned neighborhood developments (good or bad) we should know about?
- What's the average days-on-market for RENTAL listings here right now (not sales)? A rising rental-DOM trend means longer vacancies and softer asking-rent achievability than the comps imply.
- What's the recent tenant-quality profile in this submarket — average credit score on applications, eviction rate, late-payment / NSF rate, and stable-employment percentage? A property-management company in the area should have these aggregated.
- How much new for-sale + rental construction is in the pipeline within 1–3 miles? Heavy new supply typically softens prices + rents 12–24 months out; constrained supply supports both.
Investment metrics
- 1% rule
- 0.85% ✗
- Cap rate
- 6.64%
- Cash-on-cash
- 1.25%
- DSCR
- 1.06
- GRM
- 9.8
CMA / ARV
- ARV (on-the-fly)
- $342,240
- Comps found
- 4
Show comp detail 4 sales within ~0.75 mi
| Address | Dist | Beds/Ba | Sqft | Sold | Price | $/sf | Match |
|---|---|---|---|---|---|---|---|
| 16298 Acero Dr | 0.49mi | 3/2.0 (+1) | 1,144 (+4%) | 2mo | $339,500 | $297 | 64 |
| 6791 Whispering Canyon Dr | 0.08mi | 3/2.0 (+1) | 1,242 (+12%) | 10mo | $385,000 | $310 | 62 |
| 6655 Oak | 0.51mi | 3/2.0 (+1) | 1,207 (+9%) | 3mo | $328,000 | $272 | 53 |
| 6564 Whispering Canyon Dr | 0.31mi | 3/2.0 (+1) | 1,200 (+9%) | 17mo | $385,000 | $321 | 52 |
Match score weights: distance 35% · size 25% · config 20% · recency 20%. Top-matched comps best support the ARV.
Projected returns pro-forma
-3.0% appreciation · 3.0% rent growth · sell at horizon
- IRR
- -14.3%
- Equity multiple
- 0.49×
- Total profit
- $-27,289
- Equity at exit
- $28,330
- IRR
- -5.6%
- Equity multiple
- 0.64×
- Total profit
- $-19,344
- Equity at exit
- $16,428
Cash invested: $53,200 (down + closing). Projections, not guarantees.
Landlord ↔ Tenant lean methodology
- Overall (STATE)
- 18 Strongly Tenant-Friendly
- State California
- 18 Strongly Tenant-Friendly · D+13
- County
- — inherits STATE
- City
- — inherits STATE
ZIP-level market 96007
- Active inventory
- 231
- Price-to-rent
- 9.8×
Monthly cashflow live
- Estimated rent
- $1,617 medium interval (Pro) →
- Mortgage (P&I)
- −$996
- Tax from tax record
- −$146 /mo · $1,756/yr
- Insurance
- −$79
- HOA
- −$0
- Vacancy / Maint / Mgmt
- −$340
- Net cashflow
- $55
Break-even live
Sensitivity live
| Price | -10% $163 | -5% $109 | +0% $55 | +5% $2 | +10% $-52 |
|---|---|---|---|---|---|
| Rent | -10% $-72 | -5% $-8 | +0% $55 | +5% $119 | +10% $183 |
| Rate | -1.0pp $151 | -0.5pp $104 | base $55 | +0.5pp $6 | +1.0pp $-44 |
UW: 25.0% down · 7.5% · 30yr · 1.5% tax · 5.0% vac · 8.0% maint · 8.0% mgmt
Financing live
Cash to close
- Down payment
- $47,500
- Closing costs
- $5,700
- Reserves months
- —
- Total cash needed
- —
Loan-product check · same deal, 3 products live
Conventional
25% down · 7.5% · 30yr
- Down + closing
- —
- Monthly P&I
- —
- Monthly cashflow
- —
- DSCR
- —
- Eligible?
- —
Personal DTI + credit; lowest rate.
DSCR
20% down · 8.5% · 30yr
- Down + closing
- —
- Monthly P&I
- —
- Monthly cashflow
- —
- DSCR
- —
- Eligible?
- —
No personal income docs; deal must DSCR.
Hard money
10% down · 12.0% · 12mo
- Down + closing
- —
- Monthly P&I
- —
- Monthly cashflow
- —
- DSCR
- —
- Eligible?
- —
Short-term bridge; refi at stabilization.
Listing history 4 events
-
2026-04-20status Pending
-
2026-04-20historical Active Under Contract
-
2026-04-16$190,000 Active
-
1994-08-03soldstatus $46,000
ⓘ Source: listings_history table (triggers on properties + properties_extension) + one-shot
backfill from property_details.listing_events for pre-trigger history.
Tax reassessment forecast CA · Resets to sale price
- Current annual tax
- $1,756 · $146/mo
- Projected year-2 tax
- $1,756 · $146/mo
- Expected delta
- $0/yr ($0/mo · 0.0%)
ⓘ Screening estimate from a state-policy table — verify with the county assessor before closing.
Climate risk First Street
- Flood 1/10 Low FEMA zone X (unshaded) · 0% chance over 30 yrs
- Wildfire 10/10 Extreme
- Heat 8/10 Severe 7 d/yr ≥104°F today · 16 d/yr by 30 yrs out
- Wind 1/10 Low
- Air quality 10/10 Extreme 35 unhealthy d/yr today · 38 by 30 yrs out
Nearby sold comps map
Loading sold comps map…
Walkable amenities ~0.75 mi
Loading nearby amenities…
Taxation est. · year 1
- Rental income
- $19,402
- − Mortgage interest
- −$10,643
- − Property taxes
- −$1,756
- − Insurance
- −$950
- − Repairs & maintenance
- −$1,552
- − Management
- −$1,552
- − Depreciation
- −$5,527
- Taxable loss
- −$2,578
- Est. tax savings @ 24.0%
- +$619
- After-tax cash flow
- $1,284/yr
For passive investors: Depreciation is non-cash, so a rental often shows a tax loss while cash-flowing — sheltering income. Rental losses are passive: they offset passive income freely, and up to $25,000/yr can offset ordinary (W-2) income if you actively participate and your MAGI is under $100k (phasing out to $0 by $150k); unused losses carry forward. On sale, claimed depreciation is recaptured at up to 25%, and gains may owe capital-gains tax (a 1031 exchange can defer both). Figures are a year-1 estimate at your 24.0% rate — not tax advice; consult a CPA.
Schools (NCES district)
- District
- Happy Valley Union Elementary
- NCES district ID
- 0616570
- Math proficiency
- 22% ▼ -8.00%
- Reading proficiency
- 26% ▼ -13.00%
- Median HH income
- $51,093
- Composite
- 21.32/100
- National rank
- #8375
- State rank
- #414 of 517 in CA
Livability — Happy Valley
No livability data for this city. (Only ~50 U.S. cities are tracked.)
Census & demographics
- Census place
- Happy Valley, CA
- County
- Shasta County · 147,641 people
- Metro
- Redding, CA
- Population (ZIP)
- 24,768
- Household income
- $61,357
- Rent vs Own
- Severe rent burden
- 758.0
Population outlook (Shasta County) Hauer SSP2
- Today (2025)
- 179,231 people
- By 2030
- 176,953 · -1.3%
- By 2040
- 169,982 · -5.2%
- By 2050
- 162,547 · -9.3%
- By 2075
- 145,649 · -18.7%
- By 2100
- 123,025 · -31.4%
Race, ethnicity, and origin ACS 2023
- Neighborhood character
- Predominantly White (74%)
- Race & ethnicity
- White 74% Hispanic / Latino 15% Two or more races 12% Asian 3% Native American 2%
- Hispanic origin (detail)
- Mexican 11%
- Common ancestry
- Italian 6% Portuguese 2% Lithuanian 2%
- Foreign-born
- 6% · Canada, China, Vietnam
- Languages at home
- 90% English-only · Spanish 8% Other Indo-European 1% Chinese 1%
Political lean MEDSL · Shasta
- 2024 margin
- Solid R (+36.5) · D 30.5% · R 67.0% · Other 2.5%
- 2008→2024 swing
- -10.7pp toward R · 2008: -25.8pp · 2024: -36.5pp
- All cycles
- 2024: R+36.5 2020: R+33.1 2016: R+37.4 2012: R+30.3 2008: R+25.8
Not yet ingested
- Civics
- —
Market trends
- HPI YoY
- ▼ -191.70%
- Current HPI
- 179.6613
- Rent YoY
- —
- Metro
- Redding, CA
- State GDP YoY
- ▲ 3.21%
- F500 in state
- 116
Industry mix (Fortune 500 HQ in CA)
| Industry | F500 HQs | Revenue |
|---|---|---|
| Technology | 27 | $1,492B |
|
||
| Financial Services | 3 | $174B |
|
||
| Retail | 3 | $44B |
|
||
| Insurance | 3 | $26B |
|
||
| Media / Entertainment | 2 | $115B |
|
||
| Pharmaceuticals / Biotech | 2 | $62B |
|
||
Price history
+313.0% since first listed4 events — show timeline
- 2026-04-20 Pending — SAOR
- 2026-04-20 Contingent — SAOR
- 2026-04-16 Listed $190,000 SAOR
- 1994-08-03 Sold (Public Records) $46,000 Public Records
Property tax history
+1.8%/yrLatest (2025): $1,756 · +1.5% YoY. Source: county tax records.
Cash-flow waterfall
monthlySold comps — $/sqft
last 12 mo · ≤1 miLoading sold comps…