555 Pierce St #1320 · Albany, CA
Flood risk 1/10 · Minimal
- FEMA flood zone
- X (unshaded)
- Chance of flooding over 30 yrs
- 0.0%
- Est. flood insurance / yr
- $507 – $1,088
Fire risk 1/10 · Minimal
- Est. fire insurance / yr
- $659 – $1,223
Heat risk 3/10 · Minor
- Hot days now (above 82°F)
- 6 days/yr
- Hot days in 30 yrs
- 12 days/yr
Wind risk 1/10 · Minimal
- Chance of severe wind over 30 yrs
- —
Air-quality risk 9/10 · Severe
- Unhealthy air days now
- 16 days/yr
- Unhealthy air days in 30 yrs
- 16 days/yr
Risk factors via First Street. Map © Google.
Why this score? — see what drove the D grade
The composite is a weighted blend of 9 inputs, each scored 0–100. Each bar is that input's sub-score; the figure is the points it added to the 100-point composite (weight × sub-score).
- ARV discount +15.0/15.0
- Schools +7.6/10.0
- Cash flow +4.6/30.0
- 1% rule +4.4/10.0
- Livability +4.0/5.0
- Rent growth +2.9/5.0
- Condition / age +2.5/5.0
- DSCR +0.0/10.0
- Appreciation +0.0/10.0
$290,000
🖨 Deal sheet 📄 Offer letter ✓ Due diligence
Listing remarks MLS
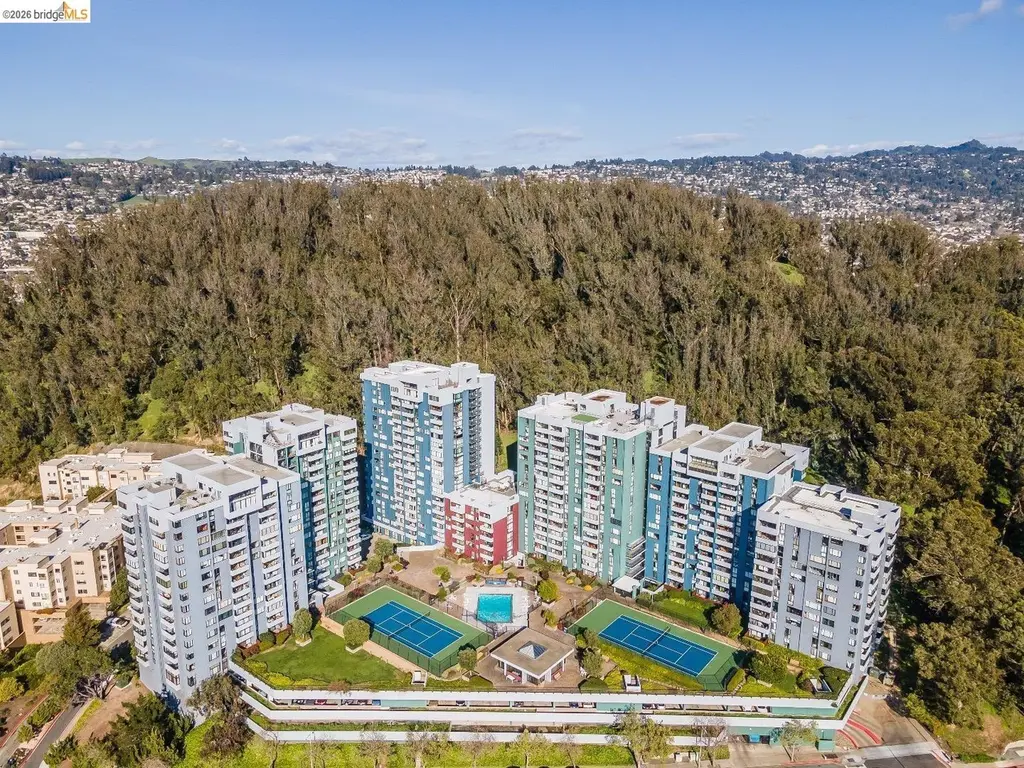
Discover a rare opportunity to own this 1-bedroom, 2-bathroom condo with a possible 2nd bedroom or Den in Albany’s desirable Gateview Community. Breathtaking views with Pool, sauna, and jacuzzi for year-round relaxation Tennis court and a well-equipped gym 24-hour security. Some photos have been virtually staged. Don't be SHY...Make this Condo GREAT AGAIN!
Key facts
- Breathtaking views
- Tennis court
- Sauna
Tags
Neighborhood map
What this means for you Summary
Snapshot
- This is a 1-bed/2.0-bath condo listed at $290k.
Deal economics
- At list price, monthly cash flow is $-730 ($-9k/yr) — negative.
- To cash-flow at today's rent, offer at most $161k (44.5% below list).
- To meet the 1% rule (rent ≥ 1% of price), the offer needs to be $273k (5.8% below list).
- Recommended offer: $161k (44.5% below list) — sets the bar for cash-flow.
- Cap rate 3.3% vs local median 1.1% in Albany — top-decile yield for the area; either an underpriced asset or a hidden risk that comps aren't pricing in. Stress-test before assuming the spread holds.
Location & tenants
- Location reads 80/100 on livability (#52 in CA, #1,953 nationally) — a professional / high-income tenant draw. Strengths: schools A+, commute A+, employment A+; Watch: cost of living F.
- Albany City Unified (suburban): math 83% / reading 91% proficiency, ranked #17 of 517 in CA (top 3%) — strong family-tenant draw, lease renewals of 3-5y typical; only 16% free/reduced lunch — higher-income household profile.
- Market conditions: Rents rising (+1.6%/yr); 54 active listings in the ZIP; 29 comparable units currently listed for rent nearby; rentals at typical pace (median 24d on market — plan ~3-4 weeks tenant-placement turnaround); 41% of comp listings sitting > 30 days — soft ceiling on asking rent; high-income renter base; 1,742 units permitted in Alameda County in 2024 (856 in 5+ unit buildings).
Forward outlook
- Local home prices are declining (-3.0%/yr); year-one equity from $2k of loan paydown is wiped out by about $9k of value loss. Plan a longer hold.
- Alameda County population projected at +34% by 2050 — long-run rental-demand tailwind backs the buy-and-hold thesis.
Negotiation context
- It's been on market 24 days — a 2% lower offer ($286k) is reasonable based on typical stale-listing flexibility.
Risks & watch-outs
- Watch-outs: HOA is 36% of rent.
Questions for the listing agent
- What do current leases actually rent for vs. the listed asking? Can we see a recent rent roll and the last 12 months of T-12 income?
- Built in 1977 — when were the roof, HVAC, electrical panel, plumbing, and water heater last replaced?
- What does the HOA fee cover, when was the last increase, and are there any pending special assessments or reserve-fund shortfalls?
- Any open or pending special assessments — roof, HVAC, plumbing, elevator, façade? What's the per-unit balance and payoff schedule, and is the seller paying it off at close or rolling it to the buyer?
- Is there a deadline driving the sale (1031 exchange, divorce, estate, relocation)? That informs how much negotiation room exists.
- Schools are A-rated — typically a magnet for longer-tenancy family renters. What's the average tenant stay here, and is there a school-zone premium baked into asking?
- The area grade is low — what's the realistic commute time and amenity access for the typical tenant pool here? Any planned neighborhood developments (good or bad) we should know about?
- What's the average days-on-market for RENTAL listings here right now (not sales)? A rising rental-DOM trend means longer vacancies and softer asking-rent achievability than the comps imply.
- What's the recent tenant-quality profile in this submarket — average credit score on applications, eviction rate, late-payment / NSF rate, and stable-employment percentage? A property-management company in the area should have these aggregated.
- How much new apartment / multifamily construction is in the pipeline within 1–3 miles? Heavy new supply (>2% of stock underway) typically softens rents 12–24 months out; light construction supports rent growth.
Investment metrics
- 1% rule
- 0.94% ✗
- Cap rate
- 3.27%
- Cash-on-cash
- -10.79%
- DSCR
- 0.52
- GRM
- 8.8
CMA / ARV
- ARV (median comp)
- $477,838
- List price
- $290,000
- Delta
- -39.31%
- Verdict
- UNDERPRICED
- Comps
- 20 within 1.0 mi
Projected returns pro-forma
-3.0% appreciation · 1.61% rent growth · sell at horizon
- IRR
- -38.1%
- Equity multiple
- -0.19×
- Total profit
- $-96,664
- Equity at exit
- $43,240
- IRR
- -72.1%
- Equity multiple
- -0.93×
- Total profit
- $-156,698
- Equity at exit
- $25,074
Cash invested: $81,200 (down + closing). Projections, not guarantees.
Landlord ↔ Tenant lean methodology
- Overall (STATE)
- 18 Strongly Tenant-Friendly
- State California
- 18 Strongly Tenant-Friendly · D+13
- County
- — inherits STATE
- City
- — inherits STATE
ZIP-level market 94706
- Rents YoY
- 1.6%
- Active inventory
- 54
- Price-to-rent
- 8.8×
Monthly cashflow live
- Estimated rent
- $2,732 high interval (Pro) →
- Mortgage (P&I)
- −$1,521
- Tax from tax record
- −$266 /mo · $3,197/yr
- Insurance
- −$121
- HOA
- −$980
- Vacancy / Maint / Mgmt
- −$574
- Net cashflow
- $-730
Break-even live
UW: 25.0% down · 7.5% · 30yr · 1.5% tax · 5.0% vac · 8.0% maint · 8.0% mgmt
Financing live
Cash to close
- Down payment
- $72,500
- Closing costs
- $8,700
- Reserves months
- —
- Total cash needed
- —
Loan-product check · same deal, 3 products live
Conventional
25% down · 7.5% · 30yr
- Down + closing
- —
- Monthly P&I
- —
- Monthly cashflow
- —
- DSCR
- —
- Eligible?
- —
Personal DTI + credit; lowest rate.
DSCR
20% down · 8.5% · 30yr
- Down + closing
- —
- Monthly P&I
- —
- Monthly cashflow
- —
- DSCR
- —
- Eligible?
- —
No personal income docs; deal must DSCR.
Hard money
10% down · 12.0% · 12mo
- Down + closing
- —
- Monthly P&I
- —
- Monthly cashflow
- —
- DSCR
- —
- Eligible?
- —
Short-term bridge; refi at stabilization.
Rent comps 29 comps
| Address | Beds | Baths | Sqft | Rent | $/sqft | DOM | Units | Dist |
|---|---|---|---|---|---|---|---|---|
| 555 Pierce St Albany, CA | 2.0 | 2.0 | 1113 | $3,200 | $2.88 | 3d | 1 | 0.02mi |
| 555 Pierce St #1225 Albany, CA | 2.0 | 2.0 | 933 | $2,600 | $2.79 | 15d | 1 | 0.02mi |
| 555 Pierce St #843 Albany, CA | 2.0 | 2.0 | 1113 | $3,200 | $2.88 | 5d | 1 | 0.02mi |
| 555 Pierce St Albany, CA | 1.0 | 1.0 | 745 | $2,400 | $3.22 | 43d | 1 | 0.02mi |
| 545 Pierce St #1206 Albany, CA | 2.0 | 2.0 | 1245 | $3,200 | $2.57 | 3d | 1 | 0.06mi |
| 545 Pierce St Albany, CA | 2.0 | 2.0 | 1239 | $3,150 | $2.54 | 3d | 2 | 0.07mi |
| 535 Pierce St #5108 Albany, CA | 2.0 | 2.0 | 1170 | $2,900 | $2.48 | 43d | 1 | 0.15mi |
| 535 Pierce St #1214 Albany, CA | 2.0 | 2.0 | 1170 | $3,200 | $2.74 | 11d | 1 | 0.15mi |
| 716 Gateview Ave Unit 2 Albany, CA | 2.0 | 1.0 | 975 | $2,995 | $3.07 | 24d | 1 | 0.24mi |
| 3301 Santa Clara Ave El Cerrito, CA | 2.0 | 1.0 | 800 | $2,695 | $3.37 | 20d | 1 | 0.36mi |
| 3263 Belmont Ave El Cerrito, CA | 2.0 | 1.0 | 800 | $2,275 | $2.84 | 16d | 1 | 0.37mi |
| 3263 Belmont Ave Unit 7 El Cerrito, CA | 2.0 | 1.0 | 800 | $2,275 | $2.84 | 43d | 1 | 0.37mi |
| 5550 Central Ave Unit 11 El Cerrito, CA | 2.0 | 1.0 | 732 | $2,295 | $3.14 | 24d | 1 | 0.42mi |
| 905 Fillmore St Albany, CA | 2.0 | 1.0 | 900 | $2,950 | $3.28 | 43d | 1 | 0.44mi |
| 411 Stannage Ave Albany, CA | 2.0 | 1.0 | 800 | $2,150 | $2.69 | 3d | 1 | 0.47mi |
| 820 Kains Ave Albany, CA | 2.0 | 2.0 | 900 | $2,700 | $3.00 | 43d | 1 | 0.53mi |
| Avila St El Cerrito, CA | 1.0 | 1.0 | 750 | $1,650 | $2.20 | 43d | 1 | 0.55mi |
| 5120 Sacramento Ave Richmond, CA | 2.0 | 2.0 | 1100 | $2,650 | $2.41 | 43d | 3 | 0.71mi |
| 725 Kearney St El Cerrito, CA | 2.0 | 1.0 | 850 | $2,325 | $2.74 | 43d | 1 | 0.83mi |
| 369 Colusa Ave Apt 1 Kensington, CA | 1.0 | 1.0 | 762 | $2,295 | $3.01 | 43d | 1 | 1.11mi |
| 367 Colusa Ave Kensington, CA | 1.0 | 1.0 | 762 | $2,295 | $3.01 | 43d | 1 | 1.11mi |
| 6131 Burlingame Ave Richmond, CA | 1.0 | 1.0 | 750 | $2,895 | $3.86 | 18d | 1 | 1.18mi |
| 1422 7th St Berkeley, CA | 2.0 | 1.0 | 800 | $3,450 | $4.31 | 43d | 1 | 1.29mi |
| 1440 Merced St Richmond, CA | 2.0 | 1.0 | 700 | $2,095 | $2.99 | 3d | 1 | 1.41mi |
| 6615 Schmidt Ln El Cerrito, CA | 1.0–3.0 | 1.0–2.0 | 1000 | $2,395 | $2.40 | 1d | 3 | 1.42mi |
| 1080 Jones St Berkeley, CA | 1.0–2.0 | 1.0–2.5 | 1046 | $3,826 | $3.66 | 1d | 7 | 1.46mi |
| 1007 King Dr Unit Private bottom floor El Cerrito, CA | 1.0 | 1.0 | 750 | $2,400 | $3.20 | 43d | 1 | 1.47mi |
| 1233 S 56th St Unit 3 Richmond, CA | 2.0 | 1.0 | 800 | $2,049 | $2.56 | 18d | 1 | 1.47mi |
| 5819 Bayview Ave Unit Inlaw Richmond, CA | 2.0 | 1.0 | 1220 | $2,500 | $2.05 | 24d | 1 | 1.49mi |
HOA detail condo
- Monthly dues
- $980 · $11,760/yr
- Likely covers
- poolgymsecurity
- Assessments
- None detected in remarks — confirm with the listing agent.
Listing history 2 events
-
2026-05-03status Pending 364-char remark
Show marketing remark (364 chars)
Discover a rare opportunity to own this 1-bedroom, 2-bathroom condo with a possible 2nd bedroom or Den in Albany’s desirable Gateview Community. Breathtaking views with Pool, sauna, and jacuzzi for year-round relaxation Tennis court and a well-equipped gym 24-hour security. Some photos have been virtually staged. Don't be SHY...Make this Condo GREAT AGAIN!
-
2026-04-09$290,000 Active 364-char remark
Show marketing remark (364 chars)
Discover a rare opportunity to own this 1-bedroom, 2-bathroom condo with a possible 2nd bedroom or Den in Albany’s desirable Gateview Community. Breathtaking views with Pool, sauna, and jacuzzi for year-round relaxation Tennis court and a well-equipped gym 24-hour security. Some photos have been virtually staged. Don't be SHY...Make this Condo GREAT AGAIN!
ⓘ Source: listings_history table (triggers on properties + properties_extension) + one-shot
backfill from property_details.listing_events for pre-trigger history.
Tax reassessment forecast CA · Resets to sale price
- Current annual tax
- $3,197 · $266/mo
- Projected year-2 tax
- $3,197 · $266/mo
- Expected delta
- $0/yr ($0/mo · 0.0%)
ⓘ Screening estimate from a state-policy table — verify with the county assessor before closing.
Climate risk First Street
- Flood 1/10 Low FEMA zone X (unshaded) · 0% chance over 30 yrs
- Wildfire 1/10 Low
- Heat 3/10 Moderate 6 d/yr ≥82°F today · 12 d/yr by 30 yrs out
- Wind 1/10 Low
- Air quality 9/10 Extreme 16 unhealthy d/yr today · 16 by 30 yrs out
Nearby sold comps map
Loading sold comps map…
Walkable amenities ~0.75 mi
Loading nearby amenities…
Taxation est. · year 1
- Rental income
- $32,782
- − Mortgage interest
- −$16,245
- − Property taxes
- −$3,197
- − Insurance
- −$1,450
- − Repairs & maintenance
- −$2,623
- − Management
- −$2,623
- − HOA
- −$11,760
- − Depreciation
- −$8,436
- Taxable loss
- −$13,551
- Est. tax savings @ 24.0%
- +$3,252
- After-tax cash flow
- $-5,507/yr
For passive investors: Depreciation is non-cash, so a rental often shows a tax loss while cash-flowing — sheltering income. Rental losses are passive: they offset passive income freely, and up to $25,000/yr can offset ordinary (W-2) income if you actively participate and your MAGI is under $100k (phasing out to $0 by $150k); unused losses carry forward. On sale, claimed depreciation is recaptured at up to 25%, and gains may owe capital-gains tax (a 1031 exchange can defer both). Figures are a year-1 estimate at your 24.0% rate — not tax advice; consult a CPA.
Schools (NCES district)
- District
- Albany City Unified
- NCES district ID
- 0601860
- Math proficiency
- 83% ▲ 11.00%
- Reading proficiency
- 91% ▲ 12.00%
- Median HH income
- $77,685
- Composite
- 76.08/100
- National rank
- #119
- State rank
- #17 of 517 in CA
Livability — Albany
- Score
- 80/100
- State rank
- #52
- US rank
- #1953
Category grades
Schools grade is shown separately in the Schools card above.
Census & demographics
- Census place
- Albany, CA
- County
- Alameda County · 1,614,355 people
- City population
- 19,969
- Metro
- San Francisco-Oakland-Berkeley, CA
- Population (ZIP)
- 19,969
- Household income
- $143,398
- Rent vs Own
- Severe rent burden
- 860.0
Population outlook (Alameda County) Hauer SSP2
- Today (2025)
- 1,928,884 people
- By 2030
- 2,069,146 · +7.3%
- By 2040
- 2,338,405 · +21.2%
- By 2050
- 2,586,608 · +34.1%
- By 2075
- 3,061,911 · +58.7%
- By 2100
- 3,234,133 · +67.7%
Race, ethnicity, and origin ACS 2023
- Neighborhood character
- Highly diverse neighborhood (Simpson 0.70)
- Race & ethnicity
- White 44% Asian 28% Two or more races 15% Hispanic / Latino 13% Black 3%
- Hispanic origin (detail)
- Mexican 6% Salvadoran 1%
- Common ancestry
- Italian 4% Slovak 2% Romanian 2%
- Foreign-born
- 26% · China, Canada, South Korea
- Languages at home
- 64% English-only · Chinese 12% Spanish 8% Other Asian/Pacific 6%
Political lean MEDSL · Alameda
- 2024 margin
- Solid D (+53.6) · D 74.6% · R 21.0% · Other 4.4%
- 2008→2024 swing
- -5.9pp toward R · 2008: 59.5pp · 2024: 53.6pp
- All cycles
- 2024: D+53.6 2020: D+62.5 2016: D+64.4 2012: D+59.8 2008: D+59.5
Not yet ingested
- Civics
- —
Market trends
- HPI YoY
- ▼ -1381.08%
- Current HPI
- 341.1177
- Rent YoY
- ▲ 1.61%
- Metro
- San Francisco-Oakland-Berkeley, CA
- State GDP YoY
- ▲ 3.21%
- F500 in state
- 116
Industry mix (Fortune 500 HQ in CA)
| Industry | F500 HQs | Revenue |
|---|---|---|
| Technology | 27 | $1,492B |
|
||
| Financial Services | 3 | $174B |
|
||
| Retail | 3 | $44B |
|
||
| Insurance | 3 | $26B |
|
||
| Media / Entertainment | 2 | $115B |
|
||
| Pharmaceuticals / Biotech | 2 | $62B |
|
||
Price history
2 events — show timeline
- 2026-05-03 Pending — bridgeMLS, Bay East AOR, or Contra Costa AOR
- 2026-04-09 Listed $290,000 bridgeMLS, Bay East AOR, or Contra Costa AOR
Property tax history
+1.0%/yrLatest (2025): $3,197 · +1.0% YoY. Source: county tax records.
Cash-flow waterfall
monthlySold comps — $/sqft
last 12 mo · ≤1 miLoading sold comps…