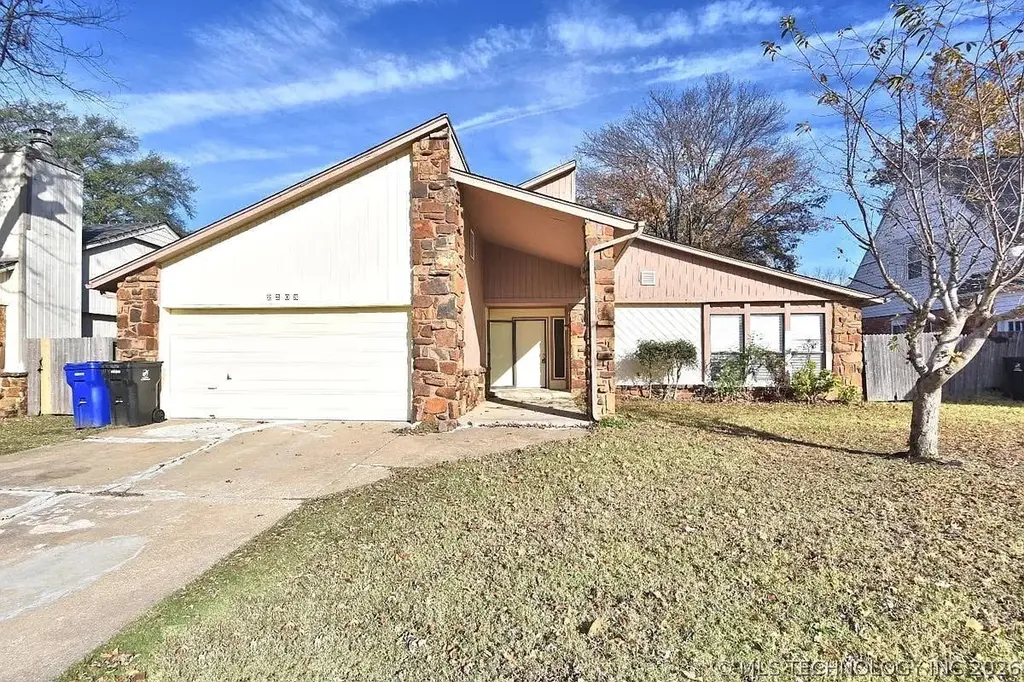
2208 W Memphis St · Broken Arrow, OK
Flood risk 1/10 · Minimal
- FEMA flood zone
- X (unshaded)
- Chance of flooding over 30 yrs
- 0.0%
- Est. flood insurance / yr
- $473 – $860
Fire risk 1/10 · Minimal
- Est. fire insurance / yr
- $2,463 – $4,575
Heat risk 6/10 · Moderate
- Hot days now (above 111°F)
- 7 days/yr
- Hot days in 30 yrs
- 18 days/yr
Wind risk 2/10 · Minimal
- Chance of severe wind over 30 yrs
- 3.0%
Air-quality risk 2/10 · Minimal
- Unhealthy air days now
- 1 days/yr
- Unhealthy air days in 30 yrs
- 1 days/yr
Risk factors via First Street. Map © Google.
Why this score? — see what drove the C grade
The composite is a weighted blend of 9 inputs, each scored 0–100. Each bar is that input's sub-score; the figure is the points it added to the 100-point composite (weight × sub-score).
- Cash flow +19.3/30.0
- ARV discount +15.0/15.0
- DSCR +6.1/10.0
- 1% rule +5.2/10.0
- Livability +3.9/5.0
- Rent growth +3.2/5.0
- Condition / age +2.5/5.0
- Schools +1.8/10.0
- Appreciation +0.0/10.0
$190,000
🖨 Deal sheet (PDF) 📄 Offer letter ✓ Due diligence
Listing remarks MLS
Great neighborhood in Union School district. 3/2/2 with extra large family room/dining room combination. New carpet, new appliances, newer roof, walk-in closets. Some final finishes needed.
Key facts
- Galley kitchen
- New roof
- 7,820 sq ft lot
Tags
Property features AI
Finance
- HOA & community: Homeowners association with $50 annual fee; Community gutters
Exterior
- Parking: Attached garage; 2-car garage
- Security: No safety shelter
- Utilities: Public water; Public sewer; Electricity available; Natural gas available; Cable available; Phone available
- Home design: Single-story; Faces west; Slab foundation
- Construction: Stone and wood frame construction; Asphalt/fiberglass roof; Built in public-record year
- Exterior features: Rain gutters; Privacy fencing; Sidewalks
Interior
- Kitchen: Built-in oven; Cooktop; Range; Oven; Dishwasher; Garbage disposal
- Flooring: Laminate flooring; Wood veneer flooring
- Bathrooms: 2 full bathrooms
- Heating & cooling: Central heating (gas); Central air conditioning
- Interior features: High ceilings; Cable TV available; Ceiling fans; Aluminum-framed windows; Electric range connection; Other interior features
- Laundry & utility: Gas dryer hookup; Gas water heater
Neighborhood map
What this means for you Summary
Snapshot
- This is a 3-bed/2.0-bath single-family listed at $190k.
Deal economics
- At list price, monthly cash flow is $210 ($3k/yr) — positive.
- The deal already cash-flows at list — no discount required.
- Meets the 1% rule at list price ($2k rent vs $190k).
- Cap rate 7.6% vs local median 4.0% in Broken Arrow — top-decile yield for the area; either an underpriced asset or a hidden risk that comps aren't pricing in. Stress-test before assuming the spread holds.
Location & tenants
- Location reads 78/100 on livability (#7 in OK, #2,691 nationally) — a middle-class / working-renter tenant base. Strengths: commute A+, cost of living A+, housing A+; Watch: amenities F.
- Union (urban): math 20% / reading 20% proficiency, ranked #160 of 270 in OK (top 59%) — low school quality limits family demand, transient renter base, plan for 1-2y turnover.
- Zoned schools: Peters Es (math 22% / reading 27%, grade F, #354 of 845 statewide, top 47%, 434 students, 0% FRL); Union 6Th-7Th Grade Ctr (math 18% / reading 17%, grade F, #186 of 345 statewide, top 55%, 2,182 students, 0% FRL); Union Hs (math 22% / reading 31%, grade F, #139 of 447 statewide, top 31%, 3,355 students, 0% FRL) — zoned schools average 0% FRL vs 51% district-wide (51 pts lower); this property's tenant base skews higher-income than the district average.
- Market conditions: Rents rising (+2.9%/yr); 445 active listings in the ZIP; 14 comparable units currently listed for rent nearby; rentals at typical pace (median 18d on market — plan ~3-4 weeks tenant-placement turnaround); solid renter incomes; 2,818 units permitted in Tulsa County in 2024 (518 in 5+ unit buildings).
Forward outlook
- Local home prices are declining (-3.0%/yr); year-one equity from $1k of loan paydown is wiped out by about $6k of value loss. Plan a longer hold.
- Tulsa County population projected at +30% by 2050 — long-run rental-demand tailwind backs the buy-and-hold thesis.
Negotiation context
- Only 2 days on market — expect competitive offers; lowballing is unlikely to land.
- 6 sale attempts since 32y ago with the ask held roughly flat each time — persistent listings suggest the price (not the market) is what's stuck; bring a comps-based counter.
- Current owner paid $115k; list at $190k implies a 65% gain — meaningful room to come down on a strong offer.
Risks & watch-outs
- Climate carrying-cost: extreme-heat days projected 7→18/yr by 2055 (HVAC capex compounding) — expect insurance premiums to compound above CPI over the hold.
Questions for the listing agent
- Built in 1978 — when were the roof, HVAC, electrical panel, plumbing, and water heater last replaced?
- What does the HOA fee cover, when was the last increase, and are there any pending special assessments or reserve-fund shortfalls?
- Is there a deadline driving the sale (1031 exchange, divorce, estate, relocation)? That informs how much negotiation room exists.
- Schools are D-rated, which usually means shorter tenancies and higher turnover. Who's the typical renter profile here, and what's been the actual vacancy rate?
- What's the average days-on-market for RENTAL listings here right now (not sales)? A rising rental-DOM trend means longer vacancies and softer asking-rent achievability than the comps imply.
- What's the recent tenant-quality profile in this submarket — average credit score on applications, eviction rate, late-payment / NSF rate, and stable-employment percentage? A property-management company in the area should have these aggregated.
- How much new for-sale + rental construction is in the pipeline within 1–3 miles? Heavy new supply typically softens prices + rents 12–24 months out; constrained supply supports both.
Investment metrics
- 1% rule
- 1.02% ✓
- Cap rate
- 7.62%
- Cash-on-cash
- 4.74%
- DSCR
- 1.21
- GRM
- 8.2
CMA / ARV
- ARV (on-the-fly)
- $242,150
- Comps found
- 12
Show comp detail 12 sales within ~0.75 mi
| Address | Dist | Beds/Ba | Sqft | Sold | Price | $/sf | Match |
|---|---|---|---|---|---|---|---|
| 2110 W Pittsburgh Pl | 0.28mi | 3/2.0 | 1,603 (-4%) | 1mo | $243,000 | $152 | 79 |
| 1912 W Pittsburg Ct | 0.34mi | 3/2.0 | 1,756 (+5%) | 4mo | $217,000 | $124 | 73 |
| 1705 W Jackson Pl | 0.41mi | 3/2.0 | 1,741 (+4%) | 1mo | $230,000 | $132 | 72 |
| 1501 S Narcissus Ave | 0.58mi | 3/2.0 | 1,675 (+0%) | 3mo | $240,000 | $143 | 70 |
| 2516 W Broadway St | 0.70mi | 3/2.0 | 1,669 (-0%) | 2mo | $284,900 | $171 | 66 |
| 1108 S Poplar Ave | 0.33mi | 3/2.0 | 1,488 (-11%) | 1mo | $245,000 | $165 | 65 |
| 1213 S Oak Ave | 0.39mi | 3/2.0 | 1,815 (+9%) | 4mo | $299,990 | $165 | 64 |
| 1213 S Maple Pl | 0.63mi | 3/1.5 | 1,724 (+3%) | 2mo | $195,000 | $113 | 62 |
| 1909 W Oakridge St | 0.30mi | 3/2.0 | 1,905 (+14%) | 5mo | $215,000 | $113 | 58 |
| 104 S Walnut Ave | 0.62mi | 3/2.0 | 1,789 (+7%) | 1mo | $259,900 | $145 | 58 |
| 1905 W Indianola St | 0.40mi | 3/2.0 | 1,895 (+14%) | 3mo | $260,000 | $137 | 56 |
| 1916 W Indianola St | 0.39mi | 4/2.0 (+1) | 1,874 (+12%) | 6mo | $275,000 | $147 | 52 |
Match score weights: distance 35% · size 25% · config 20% · recency 20%. Top-matched comps best support the ARV.
Projected returns pro-forma
-3.0% appreciation · 2.94% rent growth · sell at horizon
- IRR
- -9.0%
- Equity multiple
- 0.67×
- Total profit
- $-17,481
- Equity at exit
- $28,330
- IRR
- 0.5%
- Equity multiple
- 1.03×
- Total profit
- $1,672
- Equity at exit
- $16,428
Cash invested: $53,200 (down + closing). Projections, not guarantees.
Landlord ↔ Tenant lean methodology
- Overall (STATE)
- 83 Strongly Landlord-Friendly
- State Oklahoma
- 83 Strongly Landlord-Friendly · R+20
- County
- — inherits STATE
- City
- — inherits STATE
ZIP-level market 74012
- Rents YoY
- 2.9%
- Active inventory
- 445
- Price-to-rent
- 8.2×
Monthly cashflow live
- Estimated rent
- $1,932 high interval (Pro) →
- Mortgage (P&I)
- −$996
- Tax from tax record
- −$237 /mo · $2,842/yr
- Insurance
- −$79
- HOA
- −$4
- Vacancy / Maint / Mgmt
- −$406
- Net cashflow
- $210
Break-even live
Sensitivity live
| Price | -10% $318 | -5% $264 | +0% $210 | +5% $157 | +10% $103 |
|---|---|---|---|---|---|
| Rent | -10% $58 | -5% $134 | +0% $210 | +5% $287 | +10% $363 |
| Rate | -1.0pp $306 | -0.5pp $259 | base $210 | +0.5pp $161 | +1.0pp $111 |
UW: 25.0% down · 7.5% · 30yr · 1.5% tax · 5.0% vac · 8.0% maint · 8.0% mgmt
Financing live
Cash to close
- Down payment
- $47,500
- Closing costs
- $5,700
- Reserves months
- —
- Total cash needed
- —
Loan-product check · same deal, 3 products live
Conventional
25% down · 7.5% · 30yr
- Down + closing
- —
- Monthly P&I
- —
- Monthly cashflow
- —
- DSCR
- —
- Eligible?
- —
Personal DTI + credit; lowest rate.
DSCR
20% down · 8.5% · 30yr
- Down + closing
- —
- Monthly P&I
- —
- Monthly cashflow
- —
- DSCR
- —
- Eligible?
- —
No personal income docs; deal must DSCR.
Hard money
10% down · 12.0% · 12mo
- Down + closing
- —
- Monthly P&I
- —
- Monthly cashflow
- —
- DSCR
- —
- Eligible?
- —
Short-term bridge; refi at stabilization.
Rent comps 14 comps
| Address | Beds | Baths | Sqft | Rent | $/sqft | DOM | Units | Dist |
|---|---|---|---|---|---|---|---|---|
| 1756 S Pine Ave Broken Arrow, OK | 3.0 | 1.0 | 1146 | $1,573 | $1.37 | 25d | 1 | 0.78mi |
| 1756 S Pine Ave Broken Arrow, OK | 3.0 | 1.0 | 1146 | $1,678 | $1.46 | 4d | 1 | 0.78mi |
| 2630 W Washington Pl Broken Arrow, OK | 4.0 | 2.0 | 1867 | $1,975 | $1.06 | 25d | 1 | 0.87mi |
| 401 N Fir Pl Broken Arrow, OK | 3.0 | 2.0 | 1746 | $1,850 | $1.06 | 13d | 1 | 0.92mi |
| 1008 W Quincy St Broken Arrow, OK | 4.0 | 2.0 | 1617 | $1,750 | $1.08 | 18d | 1 | 0.94mi |
| 1008 W Quincy St Broken Arrow, OK | 4.0 | 2.0 | 1617 | $1,750 | $1.08 | 23d | 1 | 0.94mi |
| 3002 W Washington Pl Broken Arrow, OK | 4.0 | 2.0 | 2211 | $1,700 | $0.77 | 5d | 1 | 1.00mi |
| 511 W Fort Worth St Unit 511 Broken Arrow, OK | 3.0 | 2.5 | 1621 | $2,650 | $1.63 | 18d | 1 | 1.21mi |
| 507 W Fort Worth St Unit 507 Broken Arrow, OK | 3.0 | 2.5 | 1621 | $2,850 | $1.76 | 18d | 1 | 1.22mi |
| 513 W Dallas St Unit A Broken Arrow, OK | 3.0 | 2.0 | 1322 | $1,850 | $1.40 | 5d | 1 | 1.24mi |
| 513 W Dallas St Unit B Broken Arrow, OK | 3.0 | 2.0 | 1362 | $1,850 | $1.36 | 25d | 1 | 1.24mi |
| 1911 W Canton Pl Broken Arrow, OK | 3.0 | 2.0 | 1359 | $1,750 | $1.29 | 25d | 1 | 1.27mi |
| 1013 W Atlanta Ct Broken Arrow, OK | 3.0 | 1.0 | 1200 | $1,325 | $1.10 | 18d | 1 | 1.28mi |
| 221 W Commercial St Broken Arrow, OK | 3.0 | 1.5 | 2192 | $1,895 | $0.86 | 18d | 1 | 1.45mi |
HOA detail
- Monthly dues
- $4 · $48/yr
Listing history 18 events
-
2026-05-21status Pending
-
2026-05-18$190,000 Active
-
2026-02-11historical $1,595
-
2026-02-09historical
-
2026-02-03price $1,595
-
2026-01-31price $219,000
-
2026-01-02price $229,000
-
2025-12-02$1,800
-
2025-11-28$235,000 Active
-
2014-06-11soldstatus $115,000
-
2014-04-25soldstatus $115,000 189-char remark
Show marketing remark (189 chars)
Great neighborhood in Union School district. 3/2/2 with extra large family room/dining room combination. New carpet, new appliances, newer roof, walk-in closets. Some final finishes needed.
-
2014-04-11historical 189-char remark
Show marketing remark (189 chars)
Great neighborhood in Union School district. 3/2/2 with extra large family room/dining room combination. New carpet, new appliances, newer roof, walk-in closets. Some final finishes needed.
-
2014-03-13$116,000 189-char remark
Show marketing remark (189 chars)
Great neighborhood in Union School district. 3/2/2 with extra large family room/dining room combination. New carpet, new appliances, newer roof, walk-in closets. Some final finishes needed.
-
2007-10-01soldstatus $85,000
-
1996-08-01soldstatus $81,500
-
1996-06-13$79,900
-
1994-10-25historical
-
1994-04-25$74,500
ⓘ Source: listings_history table (triggers on properties + properties_extension) + one-shot
backfill from property_details.listing_events for pre-trigger history.
Tax reassessment forecast OK · Resets to sale price
- Current annual tax
- $2,842 · $237/mo
- Projected year-2 tax
- $2,842 · $237/mo
- Expected delta
- $0/yr ($0/mo · 0.0%)
ⓘ Screening estimate from a state-policy table — verify with the county assessor before closing.
Climate risk First Street
- Flood 1/10 Low FEMA zone X (unshaded) · 0% chance over 30 yrs
- Wildfire 1/10 Low
- Heat 6/10 Major 7 d/yr ≥111°F today · 18 d/yr by 30 yrs out
- Wind 2/10 Low 3% chance of damaging wind over 30 yrs
- Air quality 2/10 Low 1 unhealthy d/yr today · 1 by 30 yrs out
Nearby sold comps map
Loading sold comps map…
Walkable amenities ~0.75 mi
Loading nearby amenities…
Taxation est. · year 1
- Rental income
- $23,190
- − Mortgage interest
- −$10,643
- − Property taxes
- −$2,842
- − Insurance
- −$950
- − Repairs & maintenance
- −$1,855
- − Management
- −$1,855
- − HOA
- −$48
- − Depreciation
- −$5,527
- Taxable loss
- −$531
- Est. tax savings @ 24.0%
- +$127
- After-tax cash flow
- $2,651/yr
For passive investors: Depreciation is non-cash, so a rental often shows a tax loss while cash-flowing — sheltering income. Rental losses are passive: they offset passive income freely, and up to $25,000/yr can offset ordinary (W-2) income if you actively participate and your MAGI is under $100k (phasing out to $0 by $150k); unused losses carry forward. On sale, claimed depreciation is recaptured at up to 25%, and gains may owe capital-gains tax (a 1031 exchange can defer both). Figures are a year-1 estimate at your 24.0% rate — not tax advice; consult a CPA.
Schools (NCES district)
- District
- Union
- NCES district ID
- 4030600
- Math proficiency
- 20% ▼ -9.00%
- Reading proficiency
- 20% ▼ -9.00%
- Median HH income
- $52,744
- Composite
- 18.18/100
- National rank
- #8962
- State rank
- #160 of 270 in OK
Livability — Broken Arrow
- Score
- 78/100
- State rank
- #7
- US rank
- #2691
Category grades
Schools grade is shown separately in the Schools card above.
Census & demographics
- Census place
- Broken Arrow, OK
- County
- Tulsa County · 640,811 people
- City population
- 144,172
- Metro
- Tulsa, OK
- Population (ZIP)
- 65,060
- Household income
- $81,456
- Rent vs Own
- Severe rent burden
- 1378.0
Population outlook (Tulsa County) Hauer SSP2
- Today (2025)
- 723,846 people
- By 2030
- 766,033 · +5.8%
- By 2040
- 851,386 · +17.6%
- By 2050
- 938,389 · +29.6%
- By 2075
- 1,166,011 · +61.1%
- By 2100
- 1,350,277 · +86.5%
Race, ethnicity, and origin ACS 2023
- Neighborhood character
- Diverse neighborhood (Simpson 0.58)
- Race & ethnicity
- White 63% Two or more races 13% Hispanic / Latino 11% Black 7% Asian 5% Native American 5%
- Hispanic origin (detail)
- Mexican 8%
- Common ancestry
- Slovak 2% Italian 2% Lithuanian 2%
- Foreign-born
- 10% · Canada, Vietnam
- Languages at home
- 86% English-only · Spanish 7% Vietnamese 2% Other Asian/Pacific 1%
Political lean MEDSL · Tulsa
- 2024 margin
- R (+15.2) · D 41.3% · R 56.5% · Other 2.2%
- 2008→2024 swing
- +9.2pp toward D · 2008: -24.5pp · 2024: -15.2pp
- All cycles
- 2024: R+15.2 2020: R+15.6 2016: R+22.9 2012: R+27.4 2008: R+24.5
Not yet ingested
- Civics
- —
Market trends
- HPI YoY
- ▼ -170.42%
- Current HPI
- 214.1279
- Rent YoY
- ▲ 2.94%
- Metro
- Tulsa, OK
- State GDP YoY
- ▲ 1.55%
- F500 in state
- 6
Industry mix (Fortune 500 HQ in OK)
| Industry | F500 HQs | Revenue |
|---|---|---|
| Energy | 3 | $48B |
|
||
Price history
+155.0% since first listed18 events — show timeline
- 2026-05-21 Pending — MLS Technology, Inc.
- 2026-05-18 Listed $190,000 MLS Technology, Inc.
- 2026-02-11 Rental Removed $1,595 BUILDIUM
- 2026-02-09 Listing Removed — MLS Technology, Inc.
- 2026-02-03 Price Changed $1,595 BUILDIUM
- 2026-01-31 Price Changed $219,000 MLS Technology, Inc.
- 2026-01-02 Price Changed $229,000 MLS Technology, Inc.
- 2025-12-02 Listed for Rent $1,800 BUILDIUM
- 2025-11-28 Listed $235,000 MLS Technology, Inc.
- 2014-06-11 Sold (Public Records) $115,000 Public Records
- 2014-04-25 Sold (MLS) $115,000 MLS Technology, Inc.
- 2014-04-11 Listing Removed — MLS Technology, Inc.
- 2014-03-13 Listed $116,000 MLS Technology, Inc.
- 2007-10-01 Sold (Public Records) $85,000 Public Records
- 1996-08-01 Sold (Public Records) $81,500 Public Records
- 1996-06-13 Listed $79,900 MLS Technology, Inc.
- 1994-10-25 Listing Removed — MLS Technology, Inc.
- 1994-04-25 Listed $74,500 MLS Technology, Inc.
Property tax history
+5.6%/yrLatest (2025): $2,842 · +6.2% YoY. Source: county tax records.
Cash-flow waterfall
monthlySold comps — $/sqft
last 12 mo · ≤1 miLoading sold comps…