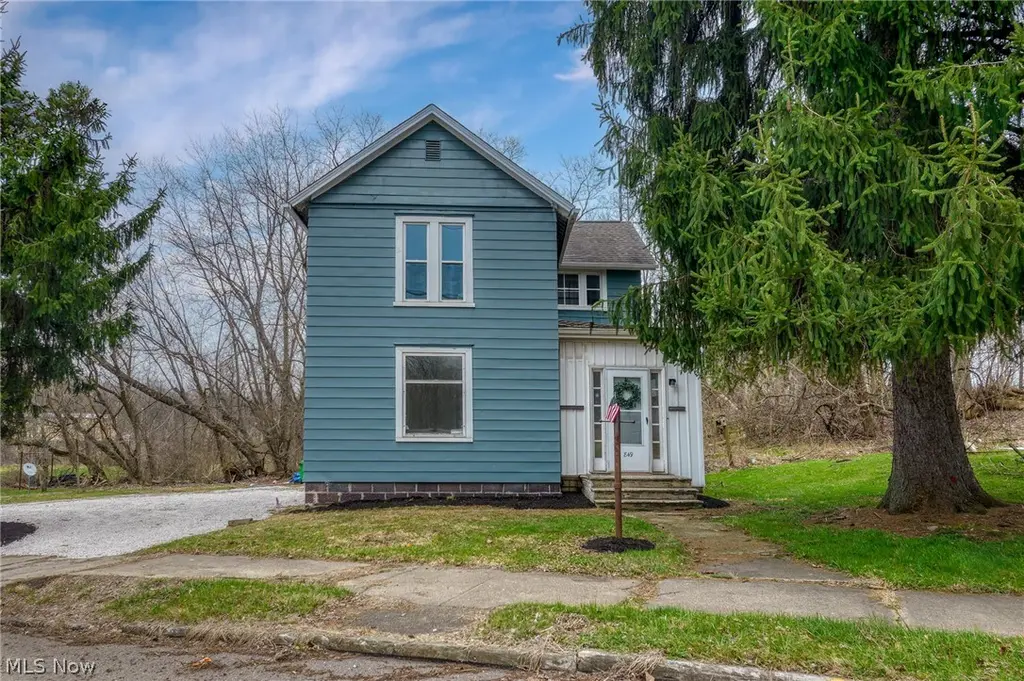
849 Walnut Ave · Alliance, OH
Flood risk 1/10 · Minimal
- FEMA flood zone
- X (unshaded)
- Chance of flooding over 30 yrs
- 0.0%
- Est. flood insurance / yr
- $473 – $860
Fire risk 1/10 · Minimal
- Est. fire insurance / yr
- $713 – $1,323
Heat risk 3/10 · Minor
- Hot days now (above 97°F)
- 7 days/yr
- Hot days in 30 yrs
- 17 days/yr
Wind risk 1/10 · Minimal
- Chance of severe wind over 30 yrs
- —
Air-quality risk 2/10 · Minimal
- Unhealthy air days now
- 1 days/yr
- Unhealthy air days in 30 yrs
- 2 days/yr
Risk factors via First Street. Map © Google.
Why this score? — see what drove the C grade
The composite is a weighted blend of 9 inputs, each scored 0–100. Each bar is that input's sub-score; the figure is the points it added to the 100-point composite (weight × sub-score).
- Cash flow +20.7/30.0
- ARV discount +11.0/15.0
- DSCR +6.6/10.0
- 1% rule +5.5/10.0
- Livability +3.9/5.0
- Schools +3.5/10.0
- Rent growth +2.5/5.0
- Condition / age +2.5/5.0
- Appreciation +0.0/10.0
$125,000
🖨 Deal sheet (PDF) 📄 Offer letter ✓ Due diligence
Listing remarks
Tucked away on a spacious lot in Alliance, this thoughtfully remodeled home blends classic charm with fresh, modern updates throughout. From the moment you step inside, you’ll notice the light, airy feel, updated finishes, and a layout that just makes sense for everyday living. The kitchen has been completely refreshed with crisp cabinetry, updated countertops, and a functional layout that opens into the dining space—perfect for both weeknight dinners and hosting. The main living areas offer a warm, inviting feel with updated flooring and neutral tones that make it easy to move right in and make it your own. With 3 bedrooms, this home offers flexibility for guests, a home office
Key facts
- Updated finishes
- 2-car garage
- Oversized lot
Tags
Property features AI
Finance
- Financial info: Annual taxes listed (amount withheld from output as financial detail)
Exterior
- Parking: Detached 2-car garage; Driveway
- Utilities: Public water; Public sewer
- Home design: Two-story home; Aluminum siding exterior; Entry level information not provided
- Construction: Built (year from public records); Frame construction; Shingle/asphalt roof; Block foundation
- Exterior features: Lot approximately 0.334 acres
Interior
- Bedrooms: One main-level bedroom
- Bathrooms: One full bathroom
- Heating & cooling: Forced-air gas heating
- Interior features: Partial concrete basement
Neighborhood map
What this means for you Summary
Snapshot
- This is a 3-bed/1.0-bath single-family listed at $125k.
Deal economics
- At list price, monthly cash flow is $170 ($2k/yr) — positive.
- The deal already cash-flows at list — no discount required.
- Meets the 1% rule at list price ($1k rent vs $125k).
- Cap rate 7.9% vs local median 4.8% in Alliance — top-decile yield for the area; either an underpriced asset or a hidden risk that comps aren't pricing in. Stress-test before assuming the spread holds.
Location & tenants
- Location reads 78/100 on livability (#175 in OH, #2,737 nationally) — a middle-class / working-renter tenant base. Strengths: commute A+, cost of living A+, housing A+; Watch: amenities F, employment F.
- Alliance City (town): math 39% / reading 45% proficiency, ranked #536 of 656 in OH (top 82%) — families likely to look elsewhere, expect single-tenant / working-renter base with shorter leases; 71% free/reduced lunch — lower-income household profile, screen leases tightly.
- Zoned schools: Alliance Early Learning School (624 students, 0% FRL); Alliance Middle School (math 33% / reading 40%, grade F, #539 of 654 statewide, top 83%, 602 students, 0% FRL); Alliance High School (math 22% / reading 45%, grade F, #598 of 781 statewide, top 77%, 973 students, 0% FRL) — zoned schools average 0% FRL vs 71% district-wide (71 pts lower); this property's tenant base skews higher-income than the district average.
- Market conditions: 168 active listings in the ZIP; 1 comparable units currently listed for rent nearby; 528 units permitted in Stark County in 2024 (84 in 5+ unit buildings).
Forward outlook
- Local home prices are declining (-3.0%/yr); year-one equity from $864 of loan paydown is wiped out by about $4k of value loss. Plan a longer hold.
- Stark County population projected to shrink 8% by 2050 — rents likely to lag national; underwrite the cash flow, not the appreciation.
Negotiation context
- Only 1 days on market — expect competitive offers; lowballing is unlikely to land.
- 7 sale attempts since 2y ago with the ask held roughly flat each time — persistent listings suggest the price (not the market) is what's stuck; bring a comps-based counter.
- Current owner paid $45k; list at $125k implies a 178% gain — meaningful room to come down on a strong offer.
Risks & watch-outs
- Watch-outs: built in 1904 — expect roof / HVAC / electrical / plumbing capex.
Questions for the listing agent
- Built in 1904 — when were the roof, HVAC, electrical panel, plumbing, and water heater last replaced?
- Is there a deadline driving the sale (1031 exchange, divorce, estate, relocation)? That informs how much negotiation room exists.
- Schools are B-rated — typically a magnet for longer-tenancy family renters. What's the average tenant stay here, and is there a school-zone premium baked into asking?
- What's the average days-on-market for RENTAL listings here right now (not sales)? A rising rental-DOM trend means longer vacancies and softer asking-rent achievability than the comps imply.
- What's the recent tenant-quality profile in this submarket — average credit score on applications, eviction rate, late-payment / NSF rate, and stable-employment percentage? A property-management company in the area should have these aggregated.
- How much new for-sale + rental construction is in the pipeline within 1–3 miles? Heavy new supply typically softens prices + rents 12–24 months out; constrained supply supports both.
Investment metrics
- 1% rule
- 1.05% ✓
- Cap rate
- 7.93%
- Cash-on-cash
- 5.83%
- DSCR
- 1.26
- GRM
- 8.0
CMA / ARV
- ARV (on-the-fly)
- $135,534
- Comps found
- 12
Show comp detail 12 sales within ~0.75 mi
| Address | Dist | Beds/Ba | Sqft | Sold | Price | $/sf | Match |
|---|---|---|---|---|---|---|---|
| 838 Walnut Ave | 0.03mi | 3/2.0 | 1,460 (+6%) | 4mo | $150,000 | $103 | 82 |
| 174 W Wayne St | 0.43mi | 3/1.0 | 1,344 (-3%) | 5mo | $105,000 | $78 | 71 |
| 260 W Wayne St | 0.47mi | 3/1.0 | 1,446 (+5%) | 6mo | $144,900 | $100 | 65 |
| 124 E Wayne St | 0.23mi | 3/2.0 | 1,248 (-10%) | 7mo | $133,000 | $107 | 63 |
| 407 N Liberty Ave | 0.47mi | 3/1.5 | 1,316 (-5%) | 9mo | $124,000 | $94 | 61 |
| 244 N Park Ave | 0.45mi | 2/1.0 (-1) | 1,272 (-8%) | 9mo | $38,000 | $30 | 53 |
| 1015 Reed | 0.62mi | 3/1.5 | 1,248 (-10%) | 2mo | $137,000 | $110 | 51 |
| 546 W Harrison St | 0.74mi | 3/1.5 | 1,344 (-3%) | 10mo | $149,900 | $112 | 50 |
| 1025 Reed St | 0.63mi | 3/2.0 | 1,248 (-10%) | 3mo | $122,600 | $98 | 48 |
| 511 W Ely St | 0.73mi | 2/2.0 (-1) | 1,430 (+3%) | 8mo | $18,000 | $13 | 44 |
| 263 Franklin Ave | 0.64mi | 2/1.5 (-1) | 1,252 (-10%) | 8mo | $26,000 | $21 | 41 |
| 163 W Market St | 0.74mi | 3/1.0 | 1,187 (-14%) | 2mo | $110,000 | $93 | 40 |
Match score weights: distance 35% · size 25% · config 20% · recency 20%. Top-matched comps best support the ARV.
Projected returns pro-forma
-3.0% appreciation · 3.0% rent growth · sell at horizon
- IRR
- -7.3%
- Equity multiple
- 0.73×
- Total profit
- $-9,404
- Equity at exit
- $18,638
- IRR
- 2.3%
- Equity multiple
- 1.17×
- Total profit
- $5,839
- Equity at exit
- $10,808
Cash invested: $35,000 (down + closing). Projections, not guarantees.
Landlord ↔ Tenant lean methodology
- Overall (STATE)
- 73 Landlord-Friendly
- State Ohio
- 73 Landlord-Friendly · R+6
- County
- — inherits STATE
- City
- — inherits STATE
ZIP-level market 44601
- Active inventory
- 168
- Price-to-rent
- 8.0×
Monthly cashflow live
- Estimated rent
- $1,309 medium interval (Pro) →
- Mortgage (P&I)
- −$656
- Tax est. 1.5%
- −$156 /mo · $1,875/yr
- Insurance
- −$52
- HOA
- −$0
- Vacancy / Maint / Mgmt
- −$275
- Net cashflow
- $170
Break-even live
Sensitivity live
| Price | -10% $256 | -5% $213 | +0% $170 | +5% $127 | +10% $84 |
|---|---|---|---|---|---|
| Rent | -10% $67 | -5% $118 | +0% $170 | +5% $222 | +10% $273 |
| Rate | -1.0pp $233 | -0.5pp $202 | base $170 | +0.5pp $138 | +1.0pp $105 |
UW: 25.0% down · 7.5% · 30yr · 1.5% tax · 5.0% vac · 8.0% maint · 8.0% mgmt
Financing live
Cash to close
- Down payment
- $31,250
- Closing costs
- $3,750
- Reserves months
- —
- Total cash needed
- —
Loan-product check · same deal, 3 products live
Conventional
25% down · 7.5% · 30yr
- Down + closing
- —
- Monthly P&I
- —
- Monthly cashflow
- —
- DSCR
- —
- Eligible?
- —
Personal DTI + credit; lowest rate.
DSCR
20% down · 8.5% · 30yr
- Down + closing
- —
- Monthly P&I
- —
- Monthly cashflow
- —
- DSCR
- —
- Eligible?
- —
No personal income docs; deal must DSCR.
Hard money
10% down · 12.0% · 12mo
- Down + closing
- —
- Monthly P&I
- —
- Monthly cashflow
- —
- DSCR
- —
- Eligible?
- —
Short-term bridge; refi at stabilization.
Rent comps 1 comps
| Address | Beds | Baths | Sqft | Rent | $/sqft | DOM | Units | Dist |
|---|---|---|---|---|---|---|---|---|
| 109 W Ely St Alliance, OH | 3.0 | 1.0 | 1344 | $1,300 | $0.97 | 15d | 1 | 0.48mi |
Listing history 2 events
-
2026-06-13remarks 687-char remark
-
2026-06-13$125,000 Pending 1 DOM
ⓘ Source: listings_history table (triggers on properties + properties_extension) + one-shot
backfill from property_details.listing_events for pre-trigger history.
Climate risk First Street
- Flood 1/10 Low FEMA zone X (unshaded) · 0% chance over 30 yrs
- Wildfire 1/10 Low
- Heat 3/10 Moderate 7 d/yr ≥97°F today · 17 d/yr by 30 yrs out
- Wind 1/10 Low
- Air quality 2/10 Low 1 unhealthy d/yr today · 2 by 30 yrs out
Nearby sold comps map
Loading sold comps map…
Walkable amenities ~0.75 mi
Loading nearby amenities…
Taxation est. · year 1
- Rental income
- $15,705
- − Mortgage interest
- −$7,002
- − Property taxes
- −$1,875
- − Insurance
- −$625
- − Repairs & maintenance
- −$1,256
- − Management
- −$1,256
- − Depreciation
- −$3,636
- Taxable income
- $54
- Est. tax owed @ 24.0%
- −$13
- After-tax cash flow
- $2,028/yr
For passive investors: Depreciation is non-cash, so a rental often shows a tax loss while cash-flowing — sheltering income. Rental losses are passive: they offset passive income freely, and up to $25,000/yr can offset ordinary (W-2) income if you actively participate and your MAGI is under $100k (phasing out to $0 by $150k); unused losses carry forward. On sale, claimed depreciation is recaptured at up to 25%, and gains may owe capital-gains tax (a 1031 exchange can defer both). Figures are a year-1 estimate at your 24.0% rate — not tax advice; consult a CPA.
Schools (NCES district)
- District
- Alliance City
- NCES district ID
- 3904349
- Math proficiency
- 39% ▼ -9.00%
- Reading proficiency
- 45% ▼ -5.00%
- Median HH income
- $33,326
- Composite
- 34.54/100
- National rank
- #5176
- State rank
- #536 of 656 in OH
Livability — Alliance
- Score
- 78/100
- State rank
- #175
- US rank
- #2737
Category grades
Schools grade is shown separately in the Schools card above.
Census & demographics
- Census place
- Alliance, OH
- County
- Stark County · 272,865 people
- City population
- 32,696
- Metro
- Canton-Massillon, OH
- Population (ZIP)
- 32,696
- Household income
- $61,965
- Rent vs Own
- Severe rent burden
- 780.0
Population outlook (Stark County) Hauer SSP2
- Today (2025)
- 373,708 people
- By 2030
- 371,245 · -0.7%
- By 2040
- 361,331 · -3.3%
- By 2050
- 345,290 · -7.6%
- By 2075
- 302,669 · -19.0%
- By 2100
- 238,870 · -36.1%
Race, ethnicity, and origin ACS 2023
- Neighborhood character
- Predominantly White (87%)
- Race & ethnicity
- White 87% Black 6% Two or more races 5% Hispanic / Latino 1%
- Common ancestry
- Italian 3% Lithuanian 2% Slovak 2%
- Foreign-born
- 1%
- Languages at home
- 98% English-only · Spanish 1%
Political lean MEDSL · Stark
- 2024 margin
- Strong R (+21.9) · D 38.6% · R 60.5%
- 2008→2024 swing
- -27.4pp toward R · 2008: 5.5pp · 2024: -21.9pp
- All cycles
- 2024: R+21.9 2020: R+18.5 2016: R+17.4 2012: R+0.4 2008: D+5.5
Not yet ingested
- Civics
- —
Market trends
- HPI YoY
- ▼ -174.62%
- Current HPI
- 224.9507
- Rent YoY
- —
- Metro
- Canton-Massillon, OH
- State GDP YoY
- ▲ 1.98%
- F500 in state
- 48
Industry mix (Fortune 500 HQ in OH)
| Industry | F500 HQs | Revenue |
|---|---|---|
| Insurance | 3 | $145B |
|
||
| Industrial Machinery | 3 | $49B |
|
||
| Financial Services | 3 | $24B |
|
||
| Consumer Goods | 2 | $93B |
|
||
| Aerospace / Defense | 2 | $47B |
|
||
| Utilities | 2 | $33B |
|
||
Price history
+420.8% since first listed26 events — show timeline
- 2026-06-12 Pending — MLSNOW
- 2026-06-11 Listed $125,000 MLSNOW
- 2026-04-29 Listing Removed — MLSNOW
- 2026-04-10 Price Changed $129,900 MLSNOW
- 2026-04-01 Relisted — MLSNOW
- 2026-03-30 Pending — MLSNOW
- 2026-03-26 Listed $135,000 MLSNOW
- 2025-11-04 Listed $70,000 MLSNOW
- 2025-06-24 Listing Removed — MLSNOW
- 2025-06-02 Price Changed $90,000 MLSNOW
- 2025-05-19 Price Changed $95,000 MLSNOW
- 2025-04-09 Price Changed $101,000 MLSNOW
- 2025-03-31 Price Changed $105,000 MLSNOW
- 2025-02-05 Price Changed $114,000 MLSNOW
- 2025-01-27 Listed $120,000 MLSNOW
- 2024-07-30 Listing Removed — MLSNOW
- 2024-07-12 Price Changed $115,000 MLSNOW
- 2024-06-11 Relisted — MLSNOW
- 2024-06-11 Price Changed $120,000 MLSNOW
- 2024-06-10 Listing Removed — MLSNOW
- 2024-05-23 Price Changed $135,000 MLSNOW
- 2024-03-20 Price Changed $150,000 MLSNOW
- 2024-03-11 Listed $175,000 MLSNOW
- 2009-11-04 Sold (Public Records) $45,000 Public Records
- 1988-11-28 Sold (Public Records) $12,500 Public Records
- 1985-04-30 Sold (Public Records) $24,000 Public Records
Property tax history
-9.3%/yrLatest (2024): $221 · +45.4% YoY. Source: county tax records.
Cash-flow waterfall
monthlySold comps — $/sqft
last 12 mo · ≤1 miLoading sold comps…