 Duplex
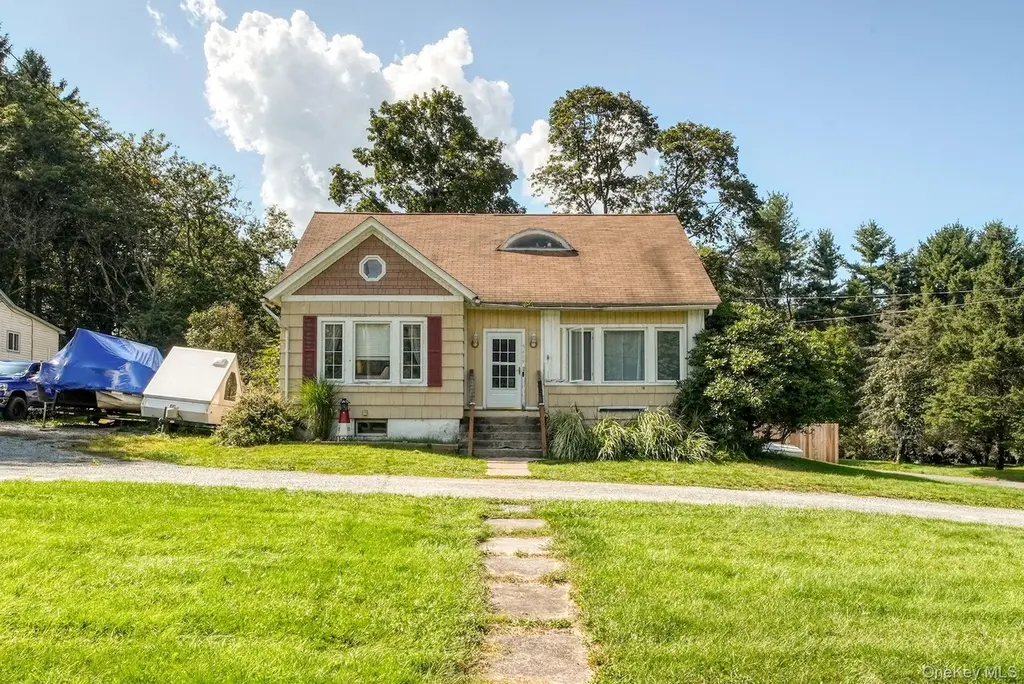
5469 State Route 55 · Liberty, NY
Flood risk 1/10 · Minimal
- FEMA flood zone
- X (unshaded)
- Chance of flooding over 30 yrs
- 0.0%
- Est. flood insurance / yr
- $473 – $860
Fire risk 2/10 · Minimal
- Est. fire insurance / yr
- $691 – $1,283
Heat risk 1/10 · Minimal
- Hot days now (above 90°F)
- 7 days/yr
- Hot days in 30 yrs
- 16 days/yr
Wind risk 2/10 · Minimal
- Chance of severe wind over 30 yrs
- 3.0%
Air-quality risk 2/10 · Minimal
- Unhealthy air days now
- 0 days/yr
- Unhealthy air days in 30 yrs
- 1 days/yr
Risk factors via First Street. Map © Google.
Why this score? — see what drove the C+ grade
The composite is a weighted blend of 9 inputs, each scored 0–100. Each bar is that input's sub-score; the figure is the points it added to the 100-point composite (weight × sub-score).
- Cash flow +21.3/30.0
- Appreciation +10.0/10.0
- DSCR +6.8/10.0
- 1% rule +6.2/10.0
- ARV discount +6.2/15.0
- Livability +3.1/5.0
- Schools +2.8/10.0
- Rent growth +2.5/5.0
- Condition / age +2.5/5.0
$299,000
🖨 Deal sheet 📄 Offer letter ✓ Due diligence
Multi-family units
County records classify this as Multi-Family (2-4 Unit). Listing-text estimate: 2 units. confirmed
Listing remarks
This 4-acre park picturesque duplex 2-family house, is currently being used as a 2-family. Each unit has 2 bedrooms and a new kitchen with a separate entrance. The main house has 2 decks, a big kitchen, and lots of potential new bathroom Nice-sized bedrooms in addition to a formal dining room. It can be easily converted to a large one family Additional Information: Heating Fuel: Oil Above Ground. ParkingFeatures:1 Car Attached
Key facts
- 4.45 acre lot
- Garage
- Built 1933
Property features AI
Exterior
- Parking: Attached parking; Driveway; One-car garage
- Utilities: Septic tank; Private trash collection
- Home design: Duplex; Actual condition
- Construction: Frame construction; Wood siding
- Exterior features: Wood siding frame construction; Not waterfront; No additional parcels
Interior
- Bedrooms: Two 2-bedroom units (duplex)
- Bathrooms: Two full bathrooms
- Heating & cooling: Hot water heating; Oil heating; No central cooling
- Interior features: First-floor bedroom
Neighborhood map
What this means for you Summary
Snapshot
- This is a 2 × 2-bed/1.0-bath units multifamily listed at $299k.
Deal economics
- At list price, monthly cash flow is $436 ($5k/yr) — positive. Per door: $218/mo.
- The deal already cash-flows at list — no discount required.
- Meets the 1% rule at list price ($3k rent vs $299k).
- Recommended offer: $281k (6.0% below list) — sets the bar for market timing.
Location & tenants
- Location reads 62/100 on livability (#890 in NY) — a middle-class / working-renter tenant base. Strengths: cost of living A+, health & safety A+, housing B+; Watch: crime D+, amenities F, commute F.
- Liberty Central School District (town): math 31% / reading 34% proficiency, ranked #569 of 590 in NY (top 96%) — families likely to look elsewhere, expect single-tenant / working-renter base with shorter leases.
- Zoned schools: Liberty Elementary School (math 27% / reading 42%, grade F, #1,577 of 2,108 statewide, top 77%, 691 students, 64% FRL); Liberty Middle School (math 12% / reading 29%, grade F, #664 of 729 statewide, top 91%, 529 students, 68% FRL); Liberty High School (math 92% / reading 70%, grade A, #495 of 1,100 statewide, top 46%, 596 students, 62% FRL) — zoned schools average 65% FRL vs 48% district-wide (16 pts higher); higher-poverty schools than district average — tighter screening recommended.
- Zoned-school proficiency averages 45% at this address vs 32% district-wide (+13 pts) — the actual schools serving this property are materially stronger than the Liberty Central School District average implies; a family-tenant draw the district grade alone would hide.
- Market conditions: 65 active listings in the ZIP; 1 comparable units currently listed for rent nearby; 739 units permitted in Sullivan County in 2024 (5 in 5+ unit buildings).
Forward outlook
- In year one you build about $32k of equity ($2k loan paydown + $30k appreciation (10.0% local appreciation)).
- Sullivan County population projected at -24% by 2050 — secular population decline; favor cash flow + early exit over multi-decade hold.
- At projected returns (10.0% appreciation + 3.0% rent growth), your $84k cash investment doubles in ~3 years — after that, you're playing with house money.
- By year 2, paydown + projected appreciation supports a ~$51k cash-out refi (75% LTV) — recoverable capital for the next deal without selling this one.
Negotiation context
- It's been on market 76 days — a 6% lower offer ($281k) is reasonable based on typical stale-listing flexibility.
- 2 sale attempts since 2y ago; this cycle's ask has dropped $40k (12%) from the opening price — seller is motivated, your offer sets the floor, not the list.
- Current owner paid $137k; list at $299k implies a 118% gain — meaningful room to come down on a strong offer.
Risks & watch-outs
- Watch-outs: built in 1933 — expect roof / HVAC / electrical / plumbing capex.
Questions for the listing agent
- It's been on market 76 days. Have you received any prior offers? Is the seller open to a 6% concession, seller financing, or rate buy-down credit?
- Can we see the unit-by-unit rent roll, current vacancy, and any below-market leases? What's the average tenancy length?
- What capital expenditures (roof, boiler, parking lot, exteriors) have been made in the last 5 years, and what's planned in the next 2?
- Built in 1933 — when were the roof, HVAC, electrical panel, plumbing, and water heater last replaced?
- Why hasn't it sold? Are there any deal-killer items the seller is aware of (foundation, flood, title, zoning, code violations)?
- Is there a deadline driving the sale (1031 exchange, divorce, estate, relocation)? That informs how much negotiation room exists.
- Crime grade is D in this area — have there been break-ins, vandalism, or insurance claims at this property in the last 3 years? What carrier currently insures it and at what premium?
- What's the average days-on-market for RENTAL listings here right now (not sales)? A rising rental-DOM trend means longer vacancies and softer asking-rent achievability than the comps imply.
- What's the recent tenant-quality profile in this submarket — average credit score on applications, eviction rate, late-payment / NSF rate, and stable-employment percentage? A property-management company in the area should have these aggregated.
- How much new apartment / multifamily construction is in the pipeline within 1–3 miles? Heavy new supply (>2% of stock underway) typically softens rents 12–24 months out; light construction supports rent growth.
Investment metrics
- 1% rule
- 1.12% ✓
- Cap rate
- 8.04%
- Cash-on-cash
- 6.25%
- DSCR
- 1.28
- GRM
- 7.4
CMA / ARV
- ARV (on-the-fly)
- $290,738
- Comps found
- 2
Show comp detail 2 sales within ~0.75 mi
| Address | Dist | Beds/Ba | Sqft | Sold | Price | $/sf | Match |
|---|---|---|---|---|---|---|---|
| 117 Chestnut St | 0.57mi | 5/2.0 (+1) | 2,181 (-0%) | 16mo | $280,000 | $128 | 55 |
| 67 Lake St | 0.48mi | 5/3.0 (+1) | 1,920 (-12%) | 13mo | $255,000 | $133 | 38 |
Match score weights: distance 35% · size 25% · config 20% · recency 20%. Top-matched comps best support the ARV.
Projected returns pro-forma
10.0% appreciation · 3.0% rent growth · sell at horizon
- IRR
- 28.8%
- Equity multiple
- 3.28×
- Total profit
- $190,745
- Equity at exit
- $269,363
- IRR
- 25.1%
- Equity multiple
- 7.45×
- Total profit
- $540,151
- Equity at exit
- $580,891
Cash invested: $83,720 (down + closing). Projections, not guarantees.
Landlord ↔ Tenant lean methodology
- Overall (STATE)
- 15 Strongly Tenant-Friendly
- State New York
- 15 Strongly Tenant-Friendly · D+10
- County
- — inherits STATE
- City
- — inherits STATE
ZIP-level market 12754
- Home prices YoY
- 28.0%
- Active inventory
- 65
- Price-to-rent
- 14.9×
Monthly cashflow live
- Estimated rent
- $3,345 high interval (Pro) →
- Mortgage (P&I)
- −$1,568
- Tax from tax record
- −$514 /mo · $6,168/yr
- Insurance
- −$125
- HOA
- −$0
- Vacancy / Maint / Mgmt
- −$702
- Net cashflow
- $436
Break-even live
2-unit breakdown (identical units grouped — click to expand)
| Units | Beds | Baths | Est. rent |
|---|---|---|---|
| 2× units | 2 | 1 | $3,346 |
| #1 | 2 | 1 | $1,673 |
| #2 | 2 | 1 | $1,673 |
| Total (2 units) | $3,345 | ||
UW: 25.0% down · 7.5% · 30yr · 1.5% tax · 5.0% vac · 8.0% maint · 8.0% mgmt
Financing live
Cash to close
- Down payment
- $74,750
- Closing costs
- $8,970
- Reserves months
- —
- Total cash needed
- —
Loan-product check · same deal, 3 products live
Conventional
25% down · 7.5% · 30yr
- Down + closing
- —
- Monthly P&I
- —
- Monthly cashflow
- —
- DSCR
- —
- Eligible?
- —
Personal DTI + credit; lowest rate.
DSCR
20% down · 8.5% · 30yr
- Down + closing
- —
- Monthly P&I
- —
- Monthly cashflow
- —
- DSCR
- —
- Eligible?
- —
No personal income docs; deal must DSCR.
Hard money
10% down · 12.0% · 12mo
- Down + closing
- —
- Monthly P&I
- —
- Monthly cashflow
- —
- DSCR
- —
- Eligible?
- —
Short-term bridge; refi at stabilization.
Rent comps 1 comps
| Address | Beds | Baths | Sqft | Rent | $/sqft | DOM | Units | Dist |
|---|---|---|---|---|---|---|---|---|
| 12 Liberty St Liberty, NY | 4.0 | 2.5 | 2200 | $2,350 | $1.07 | 23d | 1 | 1.08mi |
Listing history 21 events
-
2026-06-17status $299,000 Pending 76 DOM
-
2026-06-17days on market $299,000 Active 76 DOM
-
2026-06-16days on market $299,000 Active 75 DOM
-
2026-06-15days on market $299,000 Active 74 DOM
-
2026-06-14days on market $299,000 Active 72 DOM
-
2026-06-13days on market $299,000 Active 71 DOM
-
2026-06-10days on market $299,000 Active 69 DOM
-
2026-06-09days on market $299,000 Active 68 DOM
-
2026-06-08days on market $299,000 Active 67 DOM
-
2026-06-07days on market $299,000 Active 66 DOM
-
2026-06-03days on market $299,000 Active 62 DOM
-
2026-06-02days on market $299,000 Active 61 DOM
-
2026-06-01days on market $299,000 Active 60 DOM
-
2026-05-31days on market $299,000 Active 59 DOM
-
2026-05-31days on market $299,000 Active 58 DOM
-
2026-05-24price $299,000
-
2026-05-04price $325,000
-
2026-04-01$339,000 Active
-
2024-09-13historical
-
2024-08-28$389,000 Active
-
2021-04-30soldstatus $137,000
ⓘ Source: listings_history table (triggers on properties + properties_extension) + one-shot
backfill from property_details.listing_events for pre-trigger history.
Tax reassessment forecast NY · Partial reset (capped growth)
- Current annual tax
- $6,168 · $514/mo
- Projected year-2 tax
- $6,168 · $514/mo
- Expected delta
- $0/yr ($0/mo · 0.0%)
ⓘ Screening estimate from a state-policy table — verify with the county assessor before closing.
Climate risk First Street
- Flood 1/10 Low FEMA zone X (unshaded) · 0% chance over 30 yrs
- Wildfire 2/10 Low
- Heat 1/10 Low 7 d/yr ≥90°F today · 16 d/yr by 30 yrs out
- Wind 2/10 Low 3% chance of damaging wind over 30 yrs
- Air quality 2/10 Low 0 unhealthy d/yr today · 1 by 30 yrs out
Nearby sold comps map
Loading sold comps map…
Walkable amenities ~0.75 mi
Loading nearby amenities…
Taxation est. · year 1
- Rental income
- $40,140
- − Mortgage interest
- −$16,749
- − Property taxes
- −$6,168
- − Insurance
- −$1,495
- − Repairs & maintenance
- −$3,211
- − Management
- −$3,211
- − Depreciation
- −$8,698
- Taxable income
- $607
- Est. tax owed @ 24.0%
- −$146
- After-tax cash flow
- $5,086/yr
For passive investors: Depreciation is non-cash, so a rental often shows a tax loss while cash-flowing — sheltering income. Rental losses are passive: they offset passive income freely, and up to $25,000/yr can offset ordinary (W-2) income if you actively participate and your MAGI is under $100k (phasing out to $0 by $150k); unused losses carry forward. On sale, claimed depreciation is recaptured at up to 25%, and gains may owe capital-gains tax (a 1031 exchange can defer both). Figures are a year-1 estimate at your 24.0% rate — not tax advice; consult a CPA.
Schools (NCES district)
- District
- Liberty Central School District
- NCES district ID
- 3617220
- Math proficiency
- 31% ▼ -8.00%
- Reading proficiency
- 34% ▼ -4.00%
- Median HH income
- $43,542
- Composite
- 27.65/100
- National rank
- #6920
- State rank
- #569 of 590 in NY
Livability — Liberty
- Score
- 62/100
- State rank
- #890
- US rank
- #17254
Category grades
Schools grade is shown separately in the Schools card above.
Census & demographics
- City population
- 8,525
- Population (ZIP)
- 8,525
Population outlook (Sullivan County) Hauer SSP2
- Today (2025)
- 68,974 people
- By 2030
- 65,609 · -4.9%
- By 2040
- 58,878 · -14.6%
- By 2050
- 52,500 · -23.9%
- By 2075
- 39,941 · -42.1%
- By 2100
- 28,880 · -58.1%
Race, ethnicity, and origin ACS 2023
- Neighborhood character
- Diverse neighborhood (Simpson 0.56)
- Race & ethnicity
- White 56% Hispanic / Latino 36% Two or more races 8% Black 4% Asian 2% Native American 1%
- Hispanic origin (detail)
- Mexican 3% Puerto Rican 7% Dominican 2%
- Common ancestry
- Romanian 3% Lithuanian 2% Scotch-Irish 1%
- Foreign-born
- 22% · Canada, Dominican Republic, Jamaica
- Languages at home
- 71% English-only · Spanish 25% Other Indo-European 2% French/Haitian/Cajun 1%
Political lean MEDSL · Sullivan
- 2024 margin
- R (+16.7) · D 41.6% · R 58.4%
- 2008→2024 swing
- -26.2pp toward R · 2008: 9.5pp · 2024: -16.7pp
- All cycles
- 2024: R+16.7 2020: R+9.2 2016: R+13.7 2012: D+10.4 2008: D+9.5
Not yet ingested
- Civics
- —
Market trends
- HPI YoY
- ▲ 100.10%
- Current HPI
- 457.3342
- Rent YoY
- —
- Metro
- —
- State GDP YoY
- ▲ 2.60%
- F500 in state
- 92
Industry mix (Fortune 500 HQ in NY)
| Industry | F500 HQs | Revenue |
|---|---|---|
| Financial Services | 10 | $950B |
|
||
| Consumer Goods | 9 | $162B |
|
||
| Insurance | 4 | $225B |
|
||
| Telecommunications | 2 | $144B |
|
||
| Pharmaceuticals | 2 | $112B |
|
||
| Media / Entertainment | 2 | $69B |
|
||
Price history
+118.2% since first listed6 events — show timeline
- 2026-05-24 Price Changed $299,000 OneKey® MLS as Distributed by MLS Grid
- 2026-05-04 Price Changed $325,000 OneKey® MLS as Distributed by MLS Grid
- 2026-04-01 Listed $339,000 OneKey® MLS as Distributed by MLS Grid
- 2024-09-13 Listing Removed — OneKey® MLS as Distributed by MLS Grid
- 2024-08-28 Listed $389,000 OneKey® MLS as Distributed by MLS Grid
- 2021-04-30 Sold (Public Records) $137,000 Public Records
Property tax history
+5.3%/yrLatest (2025): $6,168 · +19.3% YoY. Source: county tax records.
Cash-flow waterfall
monthlySold comps — $/sqft
last 12 mo · ≤1 miLoading sold comps…