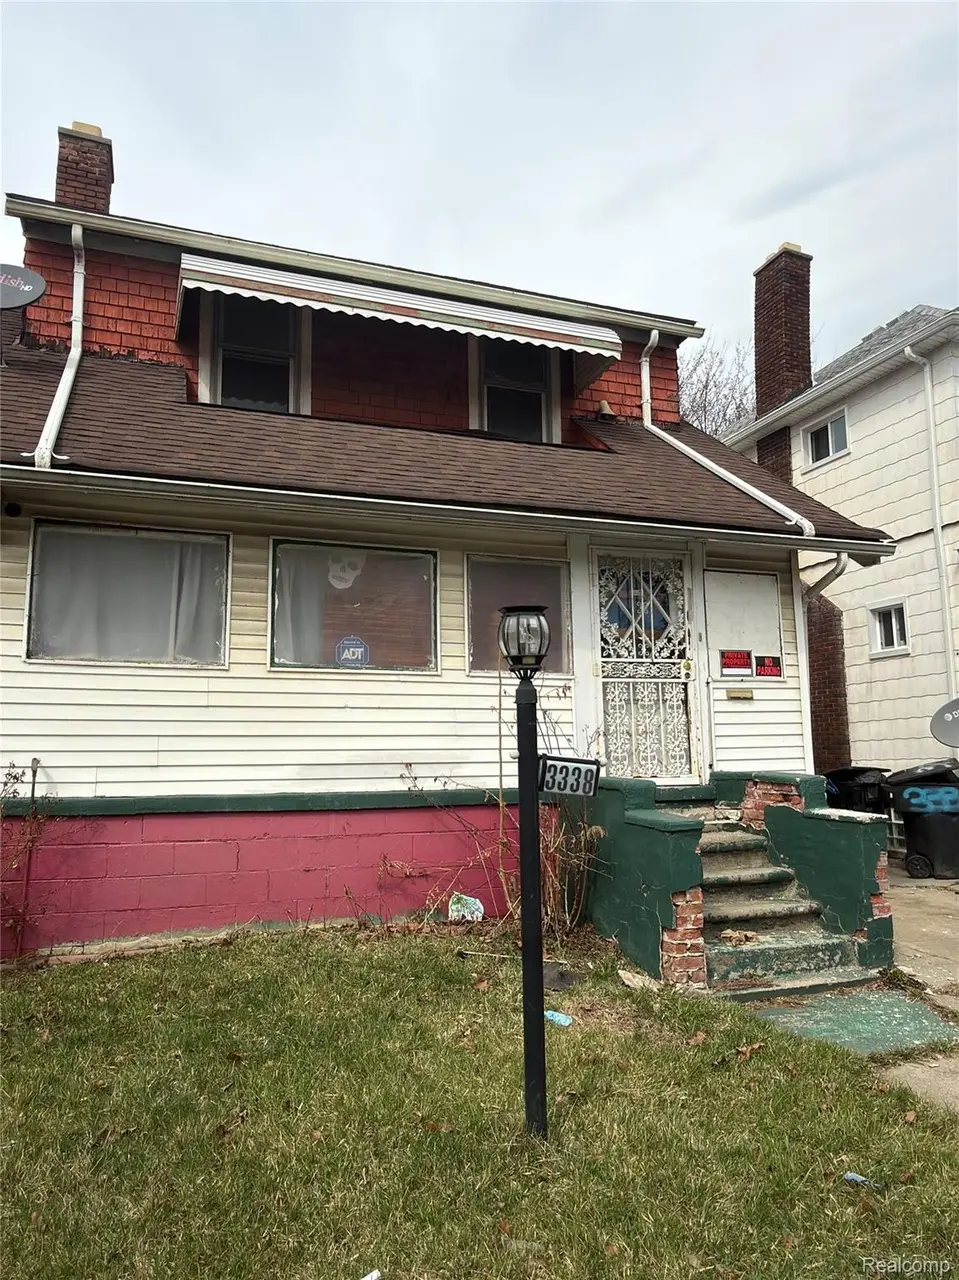
3338 Taylor St · Detroit, MI
Flood risk 1/10 · Minimal
- FEMA flood zone
- X (unshaded)
- Chance of flooding over 30 yrs
- 0.0%
- Est. flood insurance / yr
- $473 – $860
Fire risk 1/10 · Minimal
- Est. fire insurance / yr
- $784 – $1,456
Heat risk 3/10 · Minor
- Hot days now (above 97°F)
- 7 days/yr
- Hot days in 30 yrs
- 15 days/yr
Wind risk 2/10 · Minimal
- Chance of severe wind over 30 yrs
- —
Air-quality risk 4/10 · Minor
- Unhealthy air days now
- 4 days/yr
- Unhealthy air days in 30 yrs
- 6 days/yr
Risk factors via First Street. Map © Google.
Why this score? — see what drove the B+ grade
The composite is a weighted blend of 9 inputs, each scored 0–100. Each bar is that input's sub-score; the figure is the points it added to the 100-point composite (weight × sub-score).
- Cash flow +30.0/30.0
- ARV discount +15.0/15.0
- 1% rule +10.0/10.0
- DSCR +10.0/10.0
- Rent growth +3.8/5.0
- Livability +3.7/5.0
- Condition / age +2.5/5.0
- Schools +1.3/10.0
- Appreciation +0.0/10.0
$35,000
🖨 Deal sheet 📄 Offer letter ✓ Due diligence
Listing remarks MLS
Great investment opportunity! This property is a prime candidate for a fix-and-flip or a buy-and-hold passive income property. With the right renovations and vision, this home offers strong income and value-add potential. The property features 3 bedrooms (one bedroom wall was previously removed and can easily be converted back), a living room with fireplace, formal dining room, and a kitchen. The home also includes a full basement with a bonus room that has a private exterior entrance, which is a unique feature for the area and provides an excellent opportunity to create a separate finished living space for additional rental income. In addition, the 2-car garage has been converted into living space, which could be used as an additional income-producing unit, office, or extended living area. This property has great bones and multiple income possibilities, making it ideal for investors or buyers looking to build equity and generate rental income. BATVAI. Property sold as-is. Owner is a licensed Broker.
Key facts
- Bonus room
- Converted garage
- Full basement
Tags
Neighborhood map
What this means for you Summary
Snapshot
- This is a 3-bed/1.0-bath single-family listed at $35k.
Deal economics
- At list price, monthly cash flow is $819 ($10k/yr) — positive.
- The deal already cash-flows at list — no discount required.
- Meets the 1% rule at list price ($1k rent vs $35k).
- Recommended offer: $33k (6.0% below list) — sets the bar for market timing.
- Cap rate 34.4% vs local median 10.2% in Detroit — top-decile yield for the area; either an underpriced asset or a hidden risk that comps aren't pricing in. Stress-test before assuming the spread holds.
Location & tenants
- Location reads 73/100 on livability (#218 in MI) — a middle-class / working-renter tenant base. Strengths: amenities A+, commute A+, cost of living A+; Watch: schools F, crime F, employment F.
- Detroit Public Schools Community District (urban): math 10% / reading 24% proficiency, ranked #499 of 540 in MI (top 92%) — low school quality limits family demand, transient renter base, plan for 1-2y turnover; 90% free/reduced lunch — lower-income household profile, screen leases tightly.
- Market conditions: Rents rising fast (+5.2%/yr); 271 active listings in the ZIP; 40 comparable units currently listed for rent nearby; rentals at typical pace (median 24d on market — plan ~3-4 weeks tenant-placement turnaround); 48% of comp listings sitting > 30 days — soft ceiling on asking rent; 2,639 units permitted in Wayne County in 2024 (1,216 in 5+ unit buildings).
- This rent runs 36% of the median local income ($45k/yr) — at the standard rent-burdened threshold; future hikes will face affordability resistance.
Forward outlook
- Local home prices are declining (-3.0%/yr); year-one equity from $242 of loan paydown is wiped out by about $1k of value loss. Plan a longer hold.
- Wayne County population projected at -17% by 2050 — secular population decline; favor cash flow + early exit over multi-decade hold.
- At projected returns (-3.0% appreciation + 5.2% rent growth), your $10k cash investment doubles in ~2 years — after that, you're playing with house money.
Negotiation context
- It's been on market 88 days — a 6% lower offer ($33k) is reasonable based on typical stale-listing flexibility.
- 2 sale attempts; this cycle's ask has dropped $10k (22%) from the opening price — seller is motivated, your offer sets the floor, not the list.
Risks & watch-outs
- Watch-outs: built in 1921 — expect roof / HVAC / electrical / plumbing capex.
Questions for the listing agent
- It's been on market 88 days. Have you received any prior offers? Is the seller open to a 6% concession, seller financing, or rate buy-down credit?
- Built in 1921 — when were the roof, HVAC, electrical panel, plumbing, and water heater last replaced?
- Why hasn't it sold? Are there any deal-killer items the seller is aware of (foundation, flood, title, zoning, code violations)?
- Is there a deadline driving the sale (1031 exchange, divorce, estate, relocation)? That informs how much negotiation room exists.
- Schools are F-rated, which usually means shorter tenancies and higher turnover. Who's the typical renter profile here, and what's been the actual vacancy rate?
- Crime grade is F in this area — have there been break-ins, vandalism, or insurance claims at this property in the last 3 years? What carrier currently insures it and at what premium?
- What's the average days-on-market for RENTAL listings here right now (not sales)? A rising rental-DOM trend means longer vacancies and softer asking-rent achievability than the comps imply.
- What's the recent tenant-quality profile in this submarket — average credit score on applications, eviction rate, late-payment / NSF rate, and stable-employment percentage? A property-management company in the area should have these aggregated.
- How much new for-sale + rental construction is in the pipeline within 1–3 miles? Heavy new supply typically softens prices + rents 12–24 months out; constrained supply supports both.
Investment metrics
- 1% rule
- 3.88% ✓
- Cap rate
- 34.36%
- Cash-on-cash
- 100.24%
- DSCR
- 5.46
- GRM
- 2.1
CMA / ARV
- ARV (median comp)
- $69,926
- List price
- $35,000
- Delta
- -49.95%
- Verdict
- UNDERPRICED
- Comps
- 20 within 1.0 mi
Show comp detail 12 sales within ~0.75 mi
| Address | Dist | Beds/Ba | Sqft | Sold | Price | $/sf | Match |
|---|---|---|---|---|---|---|---|
| 9329 Petoskey Ave | 0.38mi | 3/1.0 | 1,097 (-6%) | 7mo | $16,000 | $15 | 67 |
| 4010 HAZELWOOD St | 0.20mi | 2/2.0 (-1) | 1,206 (+4%) | 14mo | $80,500 | $67 | 64 |
| 4010 Hazelwood St | 0.20mi | 2/2.0 (-1) | 1,206 (+4%) | 14mo | $80,500 | $67 | 64 |
| 2947 Glynn Ct | 0.56mi | 3/1.0 | 1,208 (+4%) | 4mo | $105,000 | $87 | 64 |
| 2637 Carter St | 0.46mi | 3/1.0 | 1,092 (-6%) | 11mo | $86,000 | $79 | 58 |
| 3286 Columbus St | 0.60mi | 3/1.0 | 1,272 (+9%) | 6mo | $13,600 | $11 | 51 |
| 3226 Glynn Ct | 0.53mi | 3/1.5 | 1,300 (+12%) | 6mo | $15,000 | $12 | 48 |
| 3738 Vicksburg St | 0.50mi | 2/1.0 (-1) | 1,290 (+11%) | 8mo | $65,000 | $50 | 47 |
| 3007 W Philadelphia St | 0.40mi | 4/1.5 (+1) | 1,334 (+15%) | 5mo | $106,000 | $79 | 46 |
| 2674 Glynn Ct | 0.65mi | 3/1.0 | 1,248 (+7%) | 15mo | $55,000 | $44 | 45 |
| 3299 Montgomery St | 0.57mi | 4/1.5 (+1) | 1,308 (+12%) | 5mo | $79,000 | $60 | 41 |
| 8792 Mackinaw St | 0.46mi | 2/1.0 (-1) | 1,005 (-14%) | 15mo | $15,000 | $15 | 38 |
Match score weights: distance 35% · size 25% · config 20% · recency 20%. Top-matched comps best support the ARV.
Projected returns pro-forma
-3.0% appreciation · 5.2% rent growth · sell at horizon
- IRR
- —
- Equity multiple
- 6.06×
- Total profit
- $49,569
- Equity at exit
- $5,219
- IRR
- —
- Equity multiple
- 13.61×
- Total profit
- $123,605
- Equity at exit
- $3,026
Cash invested: $9,800 (down + closing). Projections, not guarantees.
Landlord ↔ Tenant lean methodology
- Overall (STATE)
- 62 Landlord-Friendly
- State Michigan
- 62 Landlord-Friendly · EVEN
- County
- — inherits STATE
- City
- — inherits STATE
ZIP-level market 48206
- Rents YoY
- 5.2%
- Active inventory
- 271
- Price-to-rent
- 2.1×
Monthly cashflow live
- Estimated rent
- $1,358 high interval (Pro) →
- Mortgage (P&I)
- −$184
- Tax from tax record
- −$56 /mo · $675/yr
- Insurance
- −$15
- HOA
- −$0
- Vacancy / Maint / Mgmt
- −$285
- Net cashflow
- $819
Break-even live
UW: 25.0% down · 7.5% · 30yr · 1.5% tax · 5.0% vac · 8.0% maint · 8.0% mgmt
Financing live
Cash to close
- Down payment
- $8,750
- Closing costs
- $1,050
- Reserves months
- —
- Total cash needed
- —
Loan-product check · same deal, 3 products live
Conventional
25% down · 7.5% · 30yr
- Down + closing
- —
- Monthly P&I
- —
- Monthly cashflow
- —
- DSCR
- —
- Eligible?
- —
Personal DTI + credit; lowest rate.
DSCR
20% down · 8.5% · 30yr
- Down + closing
- —
- Monthly P&I
- —
- Monthly cashflow
- —
- DSCR
- —
- Eligible?
- —
No personal income docs; deal must DSCR.
Hard money
10% down · 12.0% · 12mo
- Down + closing
- —
- Monthly P&I
- —
- Monthly cashflow
- —
- DSCR
- —
- Eligible?
- —
Short-term bridge; refi at stabilization.
Rent comps 40 comps
| Address | Beds | Baths | Sqft | Rent | $/sqft | DOM | Units | Dist |
|---|---|---|---|---|---|---|---|---|
| 3220 Gladstone St Detroit, MI | 3.0 | 1.0 | 1248 | $1,200 | $0.96 | 43d | 1 | 0.15mi |
| 3759 Atkinson St Unit 2 Detroit, MI | 2.0 | 1.0 | 919 | $1,200 | $1.31 | 24d | 1 | 0.18mi |
| 3786 Carter St Unit 2 Detroit, MI | 3.0 | 1.0 | 1400 | $1,100 | $0.79 | 24d | 1 | 0.19mi |
| 3757 Blaine St Detroit, MI | 3.0 | 1.0 | 1169 | $1,480 | $1.27 | 16d | 1 | 0.24mi |
| 3422 Edison St Detroit, MI | 3.0 | 1.0 | 1300 | $1,295 | $1.00 | 16d | 1 | 0.28mi |
| 3259 W Philadelphia St Detroit, MI | 3.0 | 1.0 | 1293 | $1,400 | $1.08 | 16d | 1 | 0.34mi |
| 3295 Rochester St Unit 2 Detroit, MI | 2.0 | 1.0 | 800 | $1,000 | $1.25 | 4d | 1 | 0.41mi |
| 3295 Rochester St Unit 2 Detroit, MI | 2.0 | 1.0 | 782 | $850 | $1.09 | 43d | 1 | 0.41mi |
| 9376 Otsego St Detroit, MI | 3.0 | 1.0 | 873 | $1,396 | $1.60 | 43d | 1 | 0.44mi |
| 4345 W Euclid St Unit 1 Detroit, MI | 3.0 | 1.0 | 1300 | $1,400 | $1.08 | 24d | 1 | 0.51mi |
| 4345 W Euclid St Unit 2 Detroit, MI | 3.0 | 1.0 | 1300 | $1,450 | $1.12 | 24d | 1 | 0.51mi |
| 2531 Pingree St Unit 2 (FL 2) Detroit, MI | 3.0 | 1.0 | 893 | $1,100 | $1.23 | 1d | 1 | 0.57mi |
| 2463 Taylor St Detroit, MI | 3.0 | 1.0 | 1350 | $1,100 | $0.81 | 43d | 1 | 0.57mi |
| 3266 Calvert Ave Fl 2 Detroit, MI | 3.0 | 1.0 | 1279 | $1,300 | $1.02 | 24d | 1 | 0.60mi |
| 3226 Calvert Ave Detroit, MI | 3.0 | 1.0 | 1100 | $1,200 | $1.09 | 12d | 1 | 0.61mi |
| 3224 Calvert St Detroit, MI | 3.0 | 1.0 | 1150 | $1,150 | $1.00 | 43d | 1 | 0.61mi |
| 2506 W Euclid St Detroit, MI | 3.0 | 1.0 | 1475 | $1,675 | $1.14 | 43d | 1 | 0.64mi |
| 2925 Calvert St Detroit, MI | 3.0 | 1.0 | 1400 | $1,300 | $0.93 | 16d | 1 | 0.64mi |
| 2504 W Euclid St Unit 2506 Detroit, MI | 3.0 | 1.0 | 1475 | $1,675 | $1.14 | 43d | 1 | 0.64mi |
| 2504 W Euclid St Unit 2504 Detroit, MI | 3.0 | 1.0 | 1475 | $1,650 | $1.12 | 43d | 1 | 0.64mi |
| 2727 Calvert Ave Unit 1 Detroit, MI | 3.0 | 1.5 | 1350 | $1,200 | $0.89 | 43d | 1 | 0.67mi |
| 4915 Maplewood St Detroit, MI | 3.0 | 1.0 | 1324 | $1,100 | $0.83 | 16d | 1 | 0.68mi |
| 2653 Calvert Ave Unit 1 Detroit, MI | 3.0 | 1.0 | 1305 | $1,200 | $0.92 | 43d | 1 | 0.71mi |
| 4016 Hogarth St Unit 4018 Hogarth Lower Detroit, MI | 2.0 | 1.0 | 1200 | $1,100 | $0.92 | 3d | 1 | 0.72mi |
| 2254 Taylor St Unit Taylor St unit Detroit, MI | 3.0 | 1.0 | 1307 | $1,550 | $1.19 | 3d | 1 | 0.73mi |
| 2634 Lawrence St Detroit, MI | 3.0 | 1.5 | 1388 | $1,600 | $1.15 | 1d | 1 | 0.84mi |
| 2021 Blaine St Detroit, MI | 1.0–2.0 | 1.0 | 684 | $1,200 | $1.75 | 43d | 1 | 0.87mi |
| 4566 Seebaldt St Detroit, MI | 2.0 | 1.0 | 1200 | $1,250 | $1.04 | 21d | 1 | 0.93mi |
| 5101 Oregon St Detroit, MI | 2.0 | 1.0 | 1000 | $1,049 | $1.05 | 43d | 1 | 0.96mi |
| 2047 Seward St Detroit, MI | 3.0 | 1.0 | 1421 | $1,523 | $1.07 | 4d | 1 | 0.97mi |
| 9789 Chenlot St Unit 1 Detroit, MI | 2.0 | 1.0 | 1000 | $1,000 | $1.00 | 4d | 1 | 0.98mi |
| 1974 Virginia Park St Detroit, MI | 2.0 | 2.0 | 1200 | $1,995 | $1.66 | 43d | 1 | 0.99mi |
| 11704 Broadstreet Ave Detroit, MI | 3.0 | 1.0 | 1200 | $1,050 | $0.88 | 43d | 1 | 1.00mi |
| 2045 Calvert St Detroit, MI | 2.0 | 2.0 | 1400 | $1,600 | $1.14 | 43d | 1 | 1.01mi |
| 3224 Monterey St Unit 2E Detroit, MI | 2.0 | 1.0 | 1200 | $1,350 | $1.12 | 43d | 1 | 1.05mi |
| 1929 Calvert Ave Unit 2 Detroit, MI | 3.0 | 1.0 | 1414 | $1,199 | $0.85 | 14d | 1 | 1.10mi |
| 1710 Virginia Park St Detroit, MI | 2.0 | 2.0 | 1350 | $1,300 | $0.96 | 4d | 1 | 1.12mi |
| 1626 Gladstone St Unit 1 Detroit, MI | 2.0 | 1.0 | 800 | $1,300 | $1.62 | 43d | 1 | 1.12mi |
| 1628 Gladstone St Unit 2 Detroit, MI | 2.0 | 1.0 | 800 | $1,050 | $1.31 | 43d | 1 | 1.12mi |
| 9917 Woodside St Apt 1 Detroit, MI | 2.0 | 1.0 | 800 | $800 | $1.00 | 43d | 1 | 1.13mi |
Listing history 14 events
-
2026-06-18days on market $35,000 Active 88 DOM
-
2026-06-17days on market $35,000 Active 87 DOM
-
2026-06-15days on market $35,000 Active 85 DOM
-
2026-06-13days on market $35,000 Active 83 DOM
-
2026-06-13days on market $35,000 Active 82 DOM
-
2026-06-09days on market $35,000 Active 79 DOM
-
2026-06-08days on market $35,000 Active 78 DOM
-
2026-06-07days on market $35,000 Active 77 DOM
-
2026-06-04pricedays on market $35,000 Active 74 DOM
-
2026-06-03days on market $45,000 Active 73 DOM
-
2026-06-01days on market $45,000 Active 71 DOM
-
2026-05-31days on market $45,000 Active 70 DOM
-
2026-03-23$45,000 Active 1015-char remark
Show marketing remark (1015 chars)
Great investment opportunity! This property is a prime candidate for a fix-and-flip or a buy-and-hold passive income property. With the right renovations and vision, this home offers strong income and value-add potential. The property features 3 bedrooms (one bedroom wall was previously removed and can easily be converted back), a living room with fireplace, formal dining room, and a kitchen. The home also includes a full basement with a bonus room that has a private exterior entrance, which is a unique feature for the area and provides an excellent opportunity to create a separate finished living space for additional rental income. In addition, the 2-car garage has been converted into living space, which could be used as an additional income-producing unit, office, or extended living area. This property has great bones and multiple income possibilities, making it ideal for investors or buyers looking to build equity and generate rental income. BATVAI. Property sold as-is. Owner is a licensed Broker.
-
2026-03-22$45,000 Active 1015-char remark
Show marketing remark (1015 chars)
Great investment opportunity! This property is a prime candidate for a fix-and-flip or a buy-and-hold passive income property. With the right renovations and vision, this home offers strong income and value-add potential. The property features 3 bedrooms (one bedroom wall was previously removed and can easily be converted back), a living room with fireplace, formal dining room, and a kitchen. The home also includes a full basement with a bonus room that has a private exterior entrance, which is a unique feature for the area and provides an excellent opportunity to create a separate finished living space for additional rental income. In addition, the 2-car garage has been converted into living space, which could be used as an additional income-producing unit, office, or extended living area. This property has great bones and multiple income possibilities, making it ideal for investors or buyers looking to build equity and generate rental income. BATVAI. Property sold as-is. Owner is a licensed Broker.
ⓘ Source: listings_history table (triggers on properties + properties_extension) + one-shot
backfill from property_details.listing_events for pre-trigger history.
Tax reassessment forecast MI · Partial reset (capped growth)
- Current annual tax
- $675 · $56/mo
- Projected year-2 tax
- $675 · $56/mo
- Expected delta
- $0/yr ($0/mo · 0.0%)
ⓘ Screening estimate from a state-policy table — verify with the county assessor before closing.
Climate risk First Street
- Flood 1/10 Low FEMA zone X (unshaded) · 0% chance over 30 yrs
- Wildfire 1/10 Low
- Heat 3/10 Moderate 7 d/yr ≥97°F today · 15 d/yr by 30 yrs out
- Wind 2/10 Low
- Air quality 4/10 Moderate 4 unhealthy d/yr today · 6 by 30 yrs out
Nearby sold comps map
Loading sold comps map…
Walkable amenities ~0.75 mi
Loading nearby amenities…
Taxation est. · year 1
- Rental income
- $16,299
- − Mortgage interest
- −$1,961
- − Property taxes
- −$675
- − Insurance
- −$175
- − Repairs & maintenance
- −$1,304
- − Management
- −$1,304
- − Depreciation
- −$1,018
- Taxable income
- $9,862
- Est. tax owed @ 24.0%
- −$2,367
- After-tax cash flow
- $7,457/yr
For passive investors: Depreciation is non-cash, so a rental often shows a tax loss while cash-flowing — sheltering income. Rental losses are passive: they offset passive income freely, and up to $25,000/yr can offset ordinary (W-2) income if you actively participate and your MAGI is under $100k (phasing out to $0 by $150k); unused losses carry forward. On sale, claimed depreciation is recaptured at up to 25%, and gains may owe capital-gains tax (a 1031 exchange can defer both). Figures are a year-1 estimate at your 24.0% rate — not tax advice; consult a CPA.
Schools (NCES district)
- District
- Detroit Public Schools Community District
- NCES district ID
- 2601103
- Math proficiency
- 10% ▼ -2.00%
- Reading proficiency
- 24% ▲ 6.00%
- Median HH income
- $25,815
- Composite
- 13.06/100
- National rank
- #9564
- State rank
- #499 of 540 in MI
Livability — Detroit
- Score
- 73/100
- State rank
- #218
- US rank
- #5427
Category grades
Schools grade is shown separately in the Schools card above.
Census & demographics
- Census place
- Detroit, MI
- County
- Wayne County · 1,562,939 people
- City population
- 572,865
- Metro
- Detroit-Warren-Dearborn, MI
- Population (ZIP)
- 15,227
- Household income
- $45,046
- Rent vs Own
- Severe rent burden
- 646.0
Population outlook (Wayne County) Hauer SSP2
- Today (2025)
- 1,675,273 people
- By 2030
- 1,620,300 · -3.3%
- By 2040
- 1,502,341 · -10.3%
- By 2050
- 1,384,039 · -17.4%
- By 2075
- 1,124,592 · -32.9%
- By 2100
- 881,193 · -47.4%
Race, ethnicity, and origin ACS 2023
- Neighborhood character
- Predominantly Black (81%)
- Race & ethnicity
- Black 81% White 12% Two or more races 5% Hispanic / Latino 3%
- Common ancestry
- Iranian 3% Romanian 1% Slovak 1%
- Foreign-born
- 4% · Canada
- Languages at home
- 94% English-only · Spanish 4% Other Indo-European 1%
Political lean MEDSL · Wayne
- 2024 margin
- Strong D (+29.0) · D 62.7% · R 33.7% · Other 3.6%
- 2008→2024 swing
- -20.5pp toward R · 2008: 49.5pp · 2024: 29.0pp
- All cycles
- 2024: D+29.0 2020: D+38.1 2016: D+37.3 2012: D+46.9 2008: D+49.5
Not yet ingested
- Civics
- —
Market trends
- HPI YoY
- ▼ -139.60%
- Current HPI
- 130.9545
- Rent YoY
- ▲ 5.20%
- Metro
- Detroit-Warren-Dearborn, MI
- State GDP YoY
- ▲ 1.37%
- F500 in state
- 28
Industry mix (Fortune 500 HQ in MI)
| Industry | F500 HQs | Revenue |
|---|---|---|
| Automotive Parts | 3 | $48B |
|
||
| Automotive | 2 | $372B |
|
||
| Chemicals | 1 | $45B |
|
||
| Automotive Retail | 1 | $29B |
|
||
| Healthcare / Medical Devices | 1 | $23B |
|
||
| Automotive Technology | 1 | $20B |
|
||
Price history
+0.0% since first listed2 events — show timeline
- 2026-03-23 Listed $45,000 REALCOMP
- 2026-03-22 Listed $45,000 MiRealSource-MiMLS
Property tax history
+0.6%/yrLatest (2025): $675 · -54.3% YoY. Source: county tax records.
Cash-flow waterfall
monthlySold comps — $/sqft
last 12 mo · ≤1 miLoading sold comps…