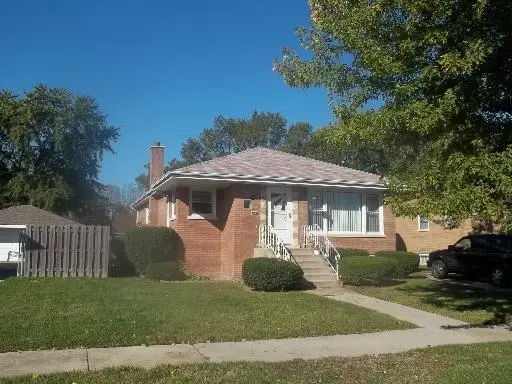
15238 Wabash Ave · South Holland, IL
Flood risk 4/10 · Minor
- FEMA flood zone
- X (unshaded)
- Chance of flooding over 30 yrs
- 0.22%
- Est. flood insurance / yr
- $473 – $860
Fire risk 1/10 · Minimal
- Est. fire insurance / yr
- $804 – $1,492
Heat risk 3/10 · Minor
- Hot days now (above 101°F)
- 7 days/yr
- Hot days in 30 yrs
- 15 days/yr
Wind risk 2/10 · Minimal
- Chance of severe wind over 30 yrs
- —
Air-quality risk 4/10 · Minor
- Unhealthy air days now
- 4 days/yr
- Unhealthy air days in 30 yrs
- 5 days/yr
Risk factors via First Street. Map © Google.
Why this score? — see what drove the F grade
The composite is a weighted blend of 9 inputs, each scored 0–100. Each bar is that input's sub-score; the figure is the points it added to the 100-point composite (weight × sub-score).
- Cash flow +7.9/30.0
- ARV discount +7.5/15.0
- 1% rule +5.3/10.0
- Livability +3.9/5.0
- Rent growth +2.5/5.0
- Condition / age +2.5/5.0
- DSCR +2.0/10.0
- Schools +0.7/10.0
- Appreciation +0.0/10.0
$240,000
🖨 Deal sheet 📄 Offer letter ✓ Due diligence
Listing remarks
This 3-bedroom, 1.1-bath single-family home is located on a residential street in a strong South Holland location. The property offers approximately 1,179 square feet plus a partial basement and presents tremendous upside opportunity. This is a sight-unseen listing because we do not have access, however all offers will be submitted to the seller for review. This property has strong resale potential within the surrounding South Holland market. Great opportunity to maximize value in a highly desirable area. Property is being sold AS-IS, taxes 100%, no survey will be provided. Buyer responsible for any inspections, repairs, and due diligence.
Key facts
- 7,975 sq ft lot
- 2 garage spots
- Built 1960
Property features AI
Finance
- Other: Assessor listed living area; Possession at closing
- HOA & community: No master association fee required
Exterior
- Parking: Detached owned garage (2 garage spaces, 2 total parking spaces)
- Utilities: Public water; Public sewer
- Home design: Detached single-family home; One-story design; Fee simple ownership
- Construction: Brick construction; Built approximately 61–70 years ago; Built before 1978
- Exterior features: Lot less than 0.25 acre; Lot dimensions listed as 7975
Interior
- Kitchen: Kitchen on main level (approx. 12 x 17)
- Bedrooms: 3 bedrooms total; 1 bedroom in the basement (possible 4th bedroom)
- Bathrooms: 1 full bathroom; 1 half bathroom
- Heating & cooling: Natural gas heating; Central air conditioning
- Interior features: Partially finished basement; 8 total rooms
- Laundry & utility: Laundry room in basement (approx. 12 x 12)
Neighborhood map
What this means for you Summary
Snapshot
- This is a 3-bed/1.5-bath single-family listed at $240k.
Deal economics
- At list price, monthly cash flow is $-252 ($-3k/yr) — negative.
- To cash-flow at today's rent, offer at most $202k (16.0% below list).
- Meets the 1% rule at list price ($2k rent vs $240k).
- Recommended offer: $202k (16.0% below list) — sets the bar for cash-flow.
- Cap rate 5.0% vs local median 8.4% in South Holland — below-typical yield; the buyer is paying a premium for something (appreciation thesis, condition, location) that the cap rate doesn't capture.
Location & tenants
- Location reads 77/100 on livability (#167 in IL, #3,071 nationally) — a middle-class / working-renter tenant base. Strengths: commute A+, housing A+, cost of living A; Watch: crime C-, amenities C-, schools D+.
- Thornton Twp Hsd 205 (suburban): math 7% / reading 8% proficiency, ranked #594 of 620 in IL (top 96%) — low school quality limits family demand, transient renter base, plan for 1-2y turnover.
- Market conditions: 135 active listings in the ZIP; 9 comparable units currently listed for rent nearby; rentals at typical pace (median 25d on market — plan ~3-4 weeks tenant-placement turnaround); 6,272 units permitted in Cook County in 2024 (4,658 in 5+ unit buildings).
Forward outlook
- Local home prices are declining (-3.0%/yr); year-one equity from $2k of loan paydown is wiped out by about $7k of value loss. Plan a longer hold.
Negotiation context
- It's been on market 35 days — a 3% lower offer ($233k) is reasonable based on typical stale-listing flexibility.
- 2 sale attempts since 15y ago with the ask held roughly flat each time — persistent listings suggest the price (not the market) is what's stuck; bring a comps-based counter.
Risks & watch-outs
- Watch-outs: property tax is 4.2% of price.
Questions for the listing agent
- What do current leases actually rent for vs. the listed asking? Can we see a recent rent roll and the last 12 months of T-12 income?
- It's been on market 35 days. Have you received any prior offers? Is the seller open to a 16% concession, seller financing, or rate buy-down credit?
- Built in 1960 — when were the roof, HVAC, electrical panel, plumbing, and water heater last replaced?
- Property tax is high relative to price — has the assessment been appealed recently, and will the sale trigger a re-assessment?
- Is there a deadline driving the sale (1031 exchange, divorce, estate, relocation)? That informs how much negotiation room exists.
- Schools are D-rated, which usually means shorter tenancies and higher turnover. Who's the typical renter profile here, and what's been the actual vacancy rate?
- The area grade is low — what's the realistic commute time and amenity access for the typical tenant pool here? Any planned neighborhood developments (good or bad) we should know about?
- What's the average days-on-market for RENTAL listings here right now (not sales)? A rising rental-DOM trend means longer vacancies and softer asking-rent achievability than the comps imply.
- What's the recent tenant-quality profile in this submarket — average credit score on applications, eviction rate, late-payment / NSF rate, and stable-employment percentage? A property-management company in the area should have these aggregated.
- How much new for-sale + rental construction is in the pipeline within 1–3 miles? Heavy new supply typically softens prices + rents 12–24 months out; constrained supply supports both.
Investment metrics
- 1% rule
- 1.03% ✓
- Cap rate
- 5.03%
- Cash-on-cash
- -4.49%
- DSCR
- 0.80
- GRM
- 8.1
CMA / ARV
- ARV (on-the-fly)
- $157,986
- Comps found
- 12
Show comp detail 12 sales within ~0.75 mi
| Address | Dist | Beds/Ba | Sqft | Sold | Price | $/sf | Match |
|---|---|---|---|---|---|---|---|
| 15061 Wabash Ave | 0.24mi | 3/1.5 | 1,116 (-5%) | 2mo | $150,000 | $134 | 78 |
| 619 E 152nd St | 0.50mi | 3/1.5 | 1,146 (-3%) | 1mo | $153,000 | $134 | 72 |
| 15444 State St | 0.26mi | 3/2.5 | 1,254 (+6%) | 2mo | $207,000 | $165 | 71 |
| 523 E 149th St | 0.50mi | 3/1.5 | 1,143 (-3%) | 2mo | $80,000 | $70 | 70 |
| 14914 Edbrooke Ave | 0.46mi | 3/1.0 | 1,287 (+9%) | 2mo | $100,000 | $78 | 60 |
| 14828 Wabash Ave | 0.60mi | 3/1.0 | 1,296 (+10%) | 1mo | $112,000 | $86 | 53 |
| 931 Miller Pl | 0.61mi | 3/1.5 | 1,042 (-12%) | 1mo | $140,000 | $134 | 51 |
| 15542 S Park Ave | 0.55mi | 4/2.0 (+1) | 1,066 (-10%) | 1mo | $193,900 | $182 | 50 |
| 15310 Oak St | 0.61mi | 4/1.5 (+1) | 1,037 (-12%) | 1mo | $190,000 | $183 | 45 |
| 910 E 152nd Pl | 0.57mi | 4/2.0 (+1) | 1,349 (+14%) | 0mo | $190,000 | $141 | 42 |
| 15518 Maple St | 0.62mi | 4/2.0 (+1) | 1,345 (+14%) | 1mo | $120,000 | $89 | 40 |
| 14825 Perry Ave | 0.68mi | 4/2.0 (+1) | 1,014 (-14%) | 1mo | $200,000 | $197 | 37 |
Match score weights: distance 35% · size 25% · config 20% · recency 20%. Top-matched comps best support the ARV.
Projected returns pro-forma
-3.0% appreciation · 3.0% rent growth · sell at horizon
- IRR
- -23.7%
- Equity multiple
- 0.19×
- Total profit
- $-54,552
- Equity at exit
- $35,785
- IRR
- -18.1%
- Equity multiple
- 0.01×
- Total profit
- $-66,645
- Equity at exit
- $20,751
Cash invested: $67,200 (down + closing). Projections, not guarantees.
Landlord ↔ Tenant lean methodology
- Overall (STATE)
- 43 Moderately Tenant-Leaning
- State Illinois
- 43 Moderately Tenant-Leaning · D+7
- County
- — inherits STATE
- City
- — inherits STATE
ZIP-level market 60473
- Active inventory
- 135
- Price-to-rent
- 8.1×
Monthly cashflow live
- Estimated rent
- $2,465 high interval (Pro) →
- Mortgage (P&I)
- −$1,259
- Tax from tax record
- −$840 /mo · $10,083/yr
- Insurance
- −$100
- HOA
- −$0
- Vacancy / Maint / Mgmt
- −$518
- Net cashflow
- $-252
Break-even live
UW: 25.0% down · 7.5% · 30yr · 1.5% tax · 5.0% vac · 8.0% maint · 8.0% mgmt
Financing live
Cash to close
- Down payment
- $60,000
- Closing costs
- $7,200
- Reserves months
- —
- Total cash needed
- —
Loan-product check · same deal, 3 products live
Conventional
25% down · 7.5% · 30yr
- Down + closing
- —
- Monthly P&I
- —
- Monthly cashflow
- —
- DSCR
- —
- Eligible?
- —
Personal DTI + credit; lowest rate.
DSCR
20% down · 8.5% · 30yr
- Down + closing
- —
- Monthly P&I
- —
- Monthly cashflow
- —
- DSCR
- —
- Eligible?
- —
No personal income docs; deal must DSCR.
Hard money
10% down · 12.0% · 12mo
- Down + closing
- —
- Monthly P&I
- —
- Monthly cashflow
- —
- DSCR
- —
- Eligible?
- —
Short-term bridge; refi at stabilization.
Rent comps 9 comps
| Address | Beds | Baths | Sqft | Rent | $/sqft | DOM | Units | Dist |
|---|---|---|---|---|---|---|---|---|
| 15238 Doctor Martin Luther King Junior Dr Unit 2W Dolton, IL | 2.0 | 1.0 | 800 | $1,500 | $1.88 | 10d | 1 | 0.43mi |
| 14844 Wabash Ave Dolton, IL | 3.0 | 1.5 | 1277 | $2,320 | $1.82 | 24d | 1 | 0.59mi |
| 15509 Park Ln South Holland, IL | 4.0 | 1.5 | 1200 | $3,400 | $2.83 | 7d | 1 | 0.71mi |
| 15509 Park Ln South Holland, IL | 4.0 | 1.5 | 1200 | $3,400 | $2.83 | 24d | 1 | 0.71mi |
| 14916 Langley Ave Dolton, IL | 3.0 | 1.5 | 1418 | $2,500 | $1.76 | 24d | 1 | 0.93mi |
| 14817 Champlain Ave Dolton, IL | 2.0 | 1.0 | 980 | $2,430 | $2.48 | 22d | 1 | 0.97mi |
| 14500 Cottage Grove Ave Unit 3 Dolton, IL | 2.0 | 1.0 | 1000 | $1,475 | $1.48 | 24d | 1 | 1.39mi |
| 14305 Irving Ave Unit 2 Dolton, IL | 3.0 | 1.0 | 1100 | $2,200 | $2.00 | 24d | 1 | 1.42mi |
| 14124 Manor Ave Dolton, IL | 3.0 | 2.0 | 1440 | $2,390 | $1.66 | 24d | 1 | 1.46mi |
Listing history 20 events
-
2026-06-18days on market $240,000 Active 35 DOM
-
2026-06-17days on market $240,000 Active 34 DOM
-
2026-06-16days on market $240,000 Active 33 DOM
-
2026-06-15days on market $240,000 Active 32 DOM
-
2026-06-13days on market $240,000 Active 30 DOM
-
2026-06-13days on market $240,000 Active 29 DOM
-
2026-06-09days on market $240,000 Active 26 DOM
-
2026-06-08days on market $240,000 Active 25 DOM
-
2026-06-07days on market $240,000 Active 24 DOM
-
2026-06-04days on market $240,000 Active 21 DOM
-
2026-06-03days on market $240,000 Active 20 DOM
-
2026-06-02days on market $240,000 Active 19 DOM
-
2026-06-01days on market $240,000 Active 18 DOM
-
2026-05-31days on market $240,000 Active 17 DOM
-
2026-05-14$240,000 Active
-
2022-07-08soldstatus $240,000
-
2011-11-14historical
-
2011-11-01historical Contingent
-
2011-10-19New
-
2003-08-15soldstatus $123,000
ⓘ Source: listings_history table (triggers on properties + properties_extension) + one-shot
backfill from property_details.listing_events for pre-trigger history.
Tax reassessment forecast IL · Partial reset (capped growth)
- Current annual tax
- $10,083 · $840/mo
- Projected year-2 tax
- $10,083 · $840/mo
- Expected delta
- $0/yr ($0/mo · 0.0%)
ⓘ Screening estimate from a state-policy table — verify with the county assessor before closing.
Climate risk First Street
- Flood 4/10 Moderate FEMA zone X (unshaded) · 22% chance over 30 yrs
- Wildfire 1/10 Low
- Heat 3/10 Moderate 7 d/yr ≥101°F today · 15 d/yr by 30 yrs out
- Wind 2/10 Low
- Air quality 4/10 Moderate 4 unhealthy d/yr today · 5 by 30 yrs out
Nearby sold comps map
Loading sold comps map…
Walkable amenities ~0.75 mi
Loading nearby amenities…
Taxation est. · year 1
- Rental income
- $29,577
- − Mortgage interest
- −$13,444
- − Property taxes
- −$10,083
- − Insurance
- −$1,200
- − Repairs & maintenance
- −$2,366
- − Management
- −$2,366
- − Depreciation
- −$6,982
- Taxable loss
- −$6,864
- Est. tax savings @ 24.0%
- +$1,647
- After-tax cash flow
- $-1,373/yr
For passive investors: Depreciation is non-cash, so a rental often shows a tax loss while cash-flowing — sheltering income. Rental losses are passive: they offset passive income freely, and up to $25,000/yr can offset ordinary (W-2) income if you actively participate and your MAGI is under $100k (phasing out to $0 by $150k); unused losses carry forward. On sale, claimed depreciation is recaptured at up to 25%, and gains may owe capital-gains tax (a 1031 exchange can defer both). Figures are a year-1 estimate at your 24.0% rate — not tax advice; consult a CPA.
Schools (NCES district)
- District
- Thornton Twp Hsd 205
- NCES district ID
- 1738970
- Math proficiency
- 7% ▬ 0.00%
- Reading proficiency
- 8% ▼ -2.00%
- Median HH income
- $43,392
- Composite
- 6.92/100
- National rank
- #9976
- State rank
- #594 of 620 in IL
Livability — South Holland
- Score
- 77/100
- State rank
- #167
- US rank
- #3071
Category grades
Schools grade is shown separately in the Schools card above.
Census & demographics
- Census place
- South Holland, IL
- City population
- 21,407
- Population (ZIP)
- 21,407
Population outlook (Cook County) Hauer SSP2
- Today (2025)
- 5,347,519 people
- By 2030
- 5,357,703 · +0.2%
- By 2040
- 5,324,924 · -0.4%
- By 2050
- 5,230,762 · -2.2%
- By 2075
- 4,785,735 · -10.5%
- By 2100
- 4,188,836 · -21.7%
Race, ethnicity, and origin ACS 2023
- Neighborhood character
- Predominantly Black (75%)
- Race & ethnicity
- Black 75% White 10% Hispanic / Latino 10% Two or more races 3% Asian 1%
- Hispanic origin (detail)
- Mexican 9% Puerto Rican 1%
- Common ancestry
- Iranian 3% Romanian 2%
- Foreign-born
- 6% · Canada, China
- Languages at home
- 87% English-only · Spanish 8% Other Asian/Pacific 1% Russian/Polish/Slavic 1%
Political lean MEDSL · Cook
- 2024 margin
- Solid D (+42.0) · D 70.4% · R 28.4% · Other 1.2%
- 2008→2024 swing
- -11.4pp toward R · 2008: 53.4pp · 2024: 42.0pp
- All cycles
- 2024: D+42.0 2020: D+50.3 2016: D+53.0 2012: D+49.4 2008: D+53.4
Not yet ingested
- Civics
- —
Market trends
- HPI YoY
- ▼ -114.36%
- Current HPI
- 201.2479
- Rent YoY
- —
- Metro
- —
- State GDP YoY
- ▲ 1.59%
- F500 in state
- 60
Industry mix (Fortune 500 HQ in IL)
| Industry | F500 HQs | Revenue |
|---|---|---|
| Insurance | 4 | $201B |
|
||
| Consumer Goods | 4 | $87B |
|
||
| Industrial Machinery | 3 | $64B |
|
||
| Healthcare | 2 | $55B |
|
||
| Retail / Pharmacy | 1 | $148B |
|
||
| Agriculture / Food | 1 | $86B |
|
||
Price history
+95.1% since first listed6 events — show timeline
- 2026-05-14 Listed $240,000 MRED as Distributed by MLS Grid
- 2022-07-08 Sold (Public Records) $240,000 Public Records
- 2011-11-14 Listing Removed — MRED as Distributed by MLS Grid
- 2011-11-01 Contingent — MRED as Distributed by MLS Grid
- 2011-10-19 Listed — MRED as Distributed by MLS Grid
- 2003-08-15 Sold (Public Records) $123,000 Public Records
Property tax history
+8.2%/yrLatest (2023): $10,083 · +385.8% YoY. Source: county tax records.
Cash-flow waterfall
monthlySold comps — $/sqft
last 12 mo · ≤1 miLoading sold comps…