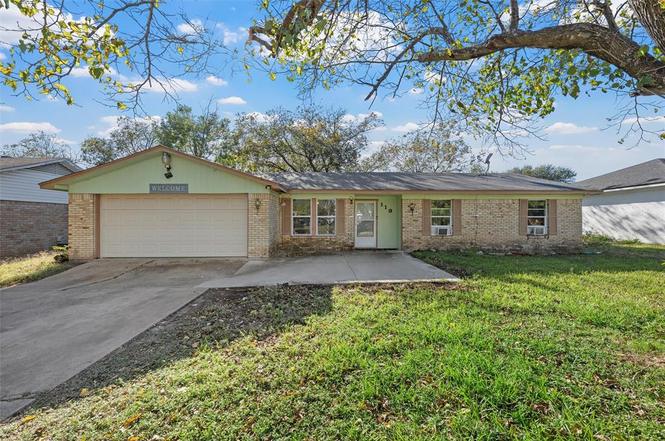
119 New Acres Dr · Hewitt, TX
Flood risk 5/10 · Moderate
- FEMA flood zone
- X (unshaded)
- Chance of flooding over 30 yrs
- 0.51%
- Est. flood insurance / yr
- $507 – $1,088
Fire risk 5/10 · Moderate
- Est. fire insurance / yr
- $1,222 – $2,270
Heat risk 7/10 · Major
- Hot days now (above 108°F)
- 7 days/yr
- Hot days in 30 yrs
- 22 days/yr
Wind risk 6/10 · Moderate
- Chance of severe wind over 30 yrs
- 61.0%
Air-quality risk 2/10 · Minimal
- Unhealthy air days now
- 0 days/yr
- Unhealthy air days in 30 yrs
- 1 days/yr
Risk factors via First Street. Map © Google.
Why this score? — see what drove the D- grade
The composite is a weighted blend of 9 inputs, each scored 0–100. Each bar is that input's sub-score; the figure is the points it added to the 100-point composite (weight × sub-score).
- Cash flow +9.8/30.0
- ARV discount +7.5/15.0
- Schools +5.2/10.0
- Livability +3.6/5.0
- 1% rule +3.1/10.0
- Rent growth +2.9/5.0
- DSCR +2.8/10.0
- Condition / age +2.5/5.0
- Appreciation +0.0/10.0
$275,000
🖨 Deal sheet 📄 Offer letter ✓ Due diligence
Listing remarks
Welcome to a home that just fits your life — spacious, comfortable, and set in the highly sought-after Midway ISD. With 4 bedrooms, 3 full baths, and 1,922 sq. ft. of living space, this home gives you the freedom to spread out, settle in, and truly make it your own. Inside, the layout feels warm and practical from the moment you step in. You’ll love having two primary suites, perfect for multigenerational living, hosting long-term guests, or creating a private retreat for anyone who needs it. The secondary suite even has the potential to add a stove, making it easy to turn into a fully functioning studio with its own entrance. The galley kitchen keeps everything close and conven
Key facts
- Large backyard
- 2 car garage
- Two primary suites
Tags
Property features AI
Finance
- Financial info: Listing terms include Cash and Conventional
- HOA & community: No homeowners association
Exterior
- Parking: Attached garage; 2 covered/garage spaces
- Utilities: City water; City sewer; Municipal utility district: No
- Home design: Single-family residence; Residential property; Attached property; Built in 1974
- Construction: Year built: 1974
- Exterior features: Chain link fencing; Lot under 0.5 acre (approximately 0.241 acre); Subdivision: New Acres
Interior
- Kitchen: Electric range
- Bedrooms: 4 bedrooms; Primary bedroom on main level; Primary bedroom suite with built-ins, ensuite bath, sitting area and walk-in closet
- Bathrooms: 3 full bathrooms
- Heating & cooling: Central heating (electric); Central air; Ceiling fan(s); Wall/window unit(s)
- Interior features: One-level layout; Two dining areas; One living area; Electric range
- Laundry & utility: No smart home features listed
Neighborhood map
What this means for you Summary
Snapshot
- This is a 3-bed/2.0-bath single-family listed at $275k.
Deal economics
- At list price, monthly cash flow is $-177 ($-2k/yr) — negative.
- To cash-flow at today's rent, offer at most $244k (11.4% below list).
- To meet the 1% rule (rent ≥ 1% of price), the offer needs to be $224k (18.5% below list).
- Recommended offer: $224k (18.5% below list) — sets the bar for 1% rule.
- Cap rate 5.5% vs local median 3.4% in Hewitt — top-decile yield for the area; either an underpriced asset or a hidden risk that comps aren't pricing in. Stress-test before assuming the spread holds.
Location & tenants
- Location reads 71/100 on livability (#301 in TX) — a middle-class / working-renter tenant base. Strengths: cost of living A+, housing A+, crime A; Watch: amenities F, commute F, health & safety F.
- Midway ISD (other): math 61% / reading 58% proficiency, ranked #56 of 826 in TX (top 7%) — acceptable for families but not a draw, mixed tenant base, ~2y average lease.
- Zoned schools: Castleman Creek El (math 48% / reading 47%, grade D, #989 of 4,322 statewide, top 23%, 585 students, 51% FRL) — zoned schools average 51% FRL vs 28% district-wide (23 pts higher); higher-poverty schools than district average — tighter screening recommended.
- Zoned-school proficiency averages 48% at this address vs 60% district-wide (-12 pts) — the specific schools serving this property underperform the Midway ISD average; the district grade overstates school quality for this exact location.
- Market conditions: Rents rising (+1.6%/yr); 98 active listings in the ZIP; 5 comparable units currently listed for rent nearby; rentals at typical pace (median 21d on market — plan ~3-4 weeks tenant-placement turnaround); solid renter incomes; 1,014 units permitted in McLennan County in 2024 (200 in 5+ unit buildings).
- This rent runs 32% of the median local income ($84k/yr) — at the standard rent-burdened threshold; future hikes will face affordability resistance.
Forward outlook
- Local home prices are declining (-3.0%/yr); year-one equity from $2k of loan paydown is wiped out by about $8k of value loss. Plan a longer hold.
- McLennan County population projected at +17% by 2050 — long-run rental-demand tailwind backs the buy-and-hold thesis.
Negotiation context
- It's been on market 218 days — a 12% lower offer ($242k) is reasonable based on typical stale-listing flexibility.
Risks & watch-outs
- Climate carrying-cost: moderate flood risk; major wind risk, 61% chance of damaging wind over 30y; moderate wildfire risk; extreme-heat days projected 7→22/yr by 2055 (HVAC capex compounding) — expect insurance premiums to compound above CPI over the hold.
Questions for the listing agent
- What do current leases actually rent for vs. the listed asking? Can we see a recent rent roll and the last 12 months of T-12 income?
- It's been on market 218 days. Have you received any prior offers? Is the seller open to a 19% concession, seller financing, or rate buy-down credit?
- Built in 1974 — when were the roof, HVAC, electrical panel, plumbing, and water heater last replaced?
- Why hasn't it sold? Are there any deal-killer items the seller is aware of (foundation, flood, title, zoning, code violations)?
- Is there a deadline driving the sale (1031 exchange, divorce, estate, relocation)? That informs how much negotiation room exists.
- Schools are B-rated — typically a magnet for longer-tenancy family renters. What's the average tenant stay here, and is there a school-zone premium baked into asking?
- The area grade is low — what's the realistic commute time and amenity access for the typical tenant pool here? Any planned neighborhood developments (good or bad) we should know about?
- What's the average days-on-market for RENTAL listings here right now (not sales)? A rising rental-DOM trend means longer vacancies and softer asking-rent achievability than the comps imply.
- What's the recent tenant-quality profile in this submarket — average credit score on applications, eviction rate, late-payment / NSF rate, and stable-employment percentage? A property-management company in the area should have these aggregated.
- How much new for-sale + rental construction is in the pipeline within 1–3 miles? Heavy new supply typically softens prices + rents 12–24 months out; constrained supply supports both.
Investment metrics
- 1% rule
- 0.81% ✗
- Cap rate
- 5.52%
- Cash-on-cash
- -2.75%
- DSCR
- 0.88
- GRM
- 10.2
CMA / ARV
No comps found within radius.
Projected returns pro-forma
-3.0% appreciation · 1.57% rent growth · sell at horizon
- IRR
- -22.5%
- Equity multiple
- 0.23×
- Total profit
- $-58,936
- Equity at exit
- $41,003
- IRR
- -20.8%
- Equity multiple
- -0.02×
- Total profit
- $-78,236
- Equity at exit
- $23,777
Cash invested: $77,000 (down + closing). Projections, not guarantees.
Landlord ↔ Tenant lean methodology
- Overall (STATE)
- 87 Strongly Landlord-Friendly
- State Texas
- 87 Strongly Landlord-Friendly · R+5
- County
- — inherits STATE
- City
- — inherits STATE
ZIP-level market 76643
- Rents YoY
- 1.6%
- Active inventory
- 98
- Price-to-rent
- 10.2×
Monthly cashflow live
- Estimated rent
- $2,241 high interval (Pro) →
- Mortgage (P&I)
- −$1,442
- Tax from tax record
- −$390 /mo · $4,682/yr
- Insurance
- −$115
- HOA
- −$0
- Vacancy / Maint / Mgmt
- −$471
- Net cashflow
- $-177
Break-even live
UW: 25.0% down · 7.5% · 30yr · 1.5% tax · 5.0% vac · 8.0% maint · 8.0% mgmt
Financing live
Cash to close
- Down payment
- $68,750
- Closing costs
- $8,250
- Reserves months
- —
- Total cash needed
- —
Loan-product check · same deal, 3 products live
Conventional
25% down · 7.5% · 30yr
- Down + closing
- —
- Monthly P&I
- —
- Monthly cashflow
- —
- DSCR
- —
- Eligible?
- —
Personal DTI + credit; lowest rate.
DSCR
20% down · 8.5% · 30yr
- Down + closing
- —
- Monthly P&I
- —
- Monthly cashflow
- —
- DSCR
- —
- Eligible?
- —
No personal income docs; deal must DSCR.
Hard money
10% down · 12.0% · 12mo
- Down + closing
- —
- Monthly P&I
- —
- Monthly cashflow
- —
- DSCR
- —
- Eligible?
- —
Short-term bridge; refi at stabilization.
Rent comps 5 comps
| Address | Beds | Baths | Sqft | Rent | $/sqft | DOM | Units | Dist |
|---|---|---|---|---|---|---|---|---|
| 10312 Sierra West Dr Waco, TX | 3.0 | 2.0 | 1560 | $2,300 | $1.47 | 20d | 1 | 1.17mi |
| 3217 Jackal Dr Lorena, TX | 4.0 | 2.0 | 1840 | $2,400 | $1.30 | 20d | 1 | 1.29mi |
| 525 E Spring Valley Rd Unit N/A Hewitt, TX | 3.0 | 2.0 | 1406 | $2,100 | $1.49 | 20d | 1 | 1.40mi |
| 606 Circle Creek Dr Hewitt, TX | 3.0 | 2.0 | 1535 | $1,995 | $1.30 | 13d | 1 | 1.42mi |
| 2701 Skinner Dr Lorena, TX | 3.0 | 2.0 | 1573 | $2,400 | $1.53 | 43d | 1 | 1.50mi |
Listing history 16 events
-
2026-06-18days on market $275,000 Active 218 DOM
-
2026-06-17days on market $275,000 Active 217 DOM
-
2026-06-16days on market $275,000 Active 216 DOM
-
2026-06-15days on market $275,000 Active 215 DOM
-
2026-06-15days on market $275,000 Active 214 DOM
-
2026-06-13days on market $275,000 Active 213 DOM
-
2026-06-12days on market $275,000 Active 212 DOM
-
2026-06-10days on market $275,000 Active 209 DOM
-
2026-06-08days on market $275,000 Active 208 DOM
-
2026-06-08days on market $275,000 Active 207 DOM
-
2026-06-07days on market $275,000 Active 206 DOM
-
2026-06-03days on market $275,000 Active 203 DOM
-
2026-06-02days on market $275,000 Active 202 DOM
-
2026-06-01days on market $275,000 Active 201 DOM
-
2026-05-31remarks 687-char remark
-
2026-05-31$275,000 Active 200 DOM
ⓘ Source: listings_history table (triggers on properties + properties_extension) + one-shot
backfill from property_details.listing_events for pre-trigger history.
Tax reassessment forecast TX · Resets to sale price
- Current annual tax
- $4,682 · $390/mo
- Projected year-2 tax
- $5,032 · $419/mo
- Expected delta
- +$351/yr (+$29/mo · 7.5%)
ⓘ Screening estimate from a state-policy table — verify with the county assessor before closing.
Climate risk First Street
- Flood 5/10 Major FEMA zone X (unshaded) · 51% chance over 30 yrs
- Wildfire 5/10 Major
- Heat 7/10 Severe 7 d/yr ≥108°F today · 22 d/yr by 30 yrs out
- Wind 6/10 Major 61% chance of damaging wind over 30 yrs
- Air quality 2/10 Low 0 unhealthy d/yr today · 1 by 30 yrs out
Nearby sold comps map
Loading sold comps map…
Walkable amenities ~0.75 mi
Loading nearby amenities…
Taxation est. · year 1
- Rental income
- $26,888
- − Mortgage interest
- −$15,404
- − Property taxes
- −$4,682
- − Insurance
- −$1,375
- − Repairs & maintenance
- −$2,151
- − Management
- −$2,151
- − Depreciation
- −$8,000
- Taxable loss
- −$6,875
- Est. tax savings @ 24.0%
- +$1,650
- After-tax cash flow
- $-471/yr
For passive investors: Depreciation is non-cash, so a rental often shows a tax loss while cash-flowing — sheltering income. Rental losses are passive: they offset passive income freely, and up to $25,000/yr can offset ordinary (W-2) income if you actively participate and your MAGI is under $100k (phasing out to $0 by $150k); unused losses carry forward. On sale, claimed depreciation is recaptured at up to 25%, and gains may owe capital-gains tax (a 1031 exchange can defer both). Figures are a year-1 estimate at your 24.0% rate — not tax advice; consult a CPA.
Schools (NCES district)
- District
- Midway ISD
- NCES district ID
- 4830640
- Math proficiency
- 61% ▼ -8.00%
- Reading proficiency
- 58% ▼ -7.00%
- Median HH income
- $67,076
- Composite
- 52.32/100
- National rank
- #1593
- State rank
- #56 of 826 in TX
Livability — Hewitt
- Score
- 71/100
- State rank
- #301
- US rank
- #6841
Category grades
Schools grade is shown separately in the Schools card above.
Census & demographics
- Census place
- Hewitt, TX
- County
- McLennan County · 213,088 people
- City population
- 16,432
- Metro
- Waco, TX
- Population (ZIP)
- 16,432
- Household income
- $83,511
- Rent vs Own
- Severe rent burden
- 433.0
Population outlook (McLennan County) Hauer SSP2
- Today (2025)
- 264,191 people
- By 2030
- 273,578 · +3.6%
- By 2040
- 291,506 · +10.3%
- By 2050
- 308,044 · +16.6%
- By 2075
- 349,648 · +32.3%
- By 2100
- 364,779 · +38.1%
Race, ethnicity, and origin ACS 2023
- Neighborhood character
- Predominantly White (67%)
- Race & ethnicity
- White 67% Hispanic / Latino 21% Two or more races 8% Black 6% Asian 3%
- Hispanic origin (detail)
- Mexican 13% Puerto Rican 1%
- Common ancestry
- Slovak 2% Lithuanian 2% Italian 1%
- Foreign-born
- 4% · Canada, Vietnam
- Languages at home
- 89% English-only · Spanish 8% Vietnamese 1%
Political lean MEDSL · McLennan
- 2024 margin
- Solid R (+30.9) · D 34.0% · R 64.9% · Other 1.0%
- 2008→2024 swing
- -7.0pp toward R · 2008: -23.9pp · 2024: -30.9pp
- All cycles
- 2024: R+30.9 2020: R+23.4 2016: R+27.1 2012: R+29.8 2008: R+23.9
Not yet ingested
- Civics
- —
Market trends
- HPI YoY
- ▼ -125.02%
- Current HPI
- 210.9229
- Rent YoY
- ▲ 1.57%
- Metro
- Waco, TX
- State GDP YoY
- ▲ 3.95%
- F500 in state
- 110
Industry mix (Fortune 500 HQ in TX)
| Industry | F500 HQs | Revenue |
|---|---|---|
| Energy | 16 | $1,198B |
|
||
| Technology | 5 | $198B |
|
||
| Engineering / Construction | 4 | $72B |
|
||
| Energy Services | 3 | $60B |
|
||
| Utilities | 3 | $41B |
|
||
| Healthcare | 2 | $330B |
|
||
Price history
-8.3% since first listed4 events — show timeline
- 2026-05-06 Price Changed $275,000 NTREIS
- 2025-12-10 Price Changed $289,900 NTREIS
- 2025-11-12 Listed $299,900 NTREIS
- 2010-04-07 Sold (Public Records) — Public Records
Property tax history
+5.6%/yrLatest (2025): $4,682 · +10.9% YoY. Source: county tax records.
Cash-flow waterfall
monthlySold comps — $/sqft
last 12 mo · ≤1 miLoading sold comps…