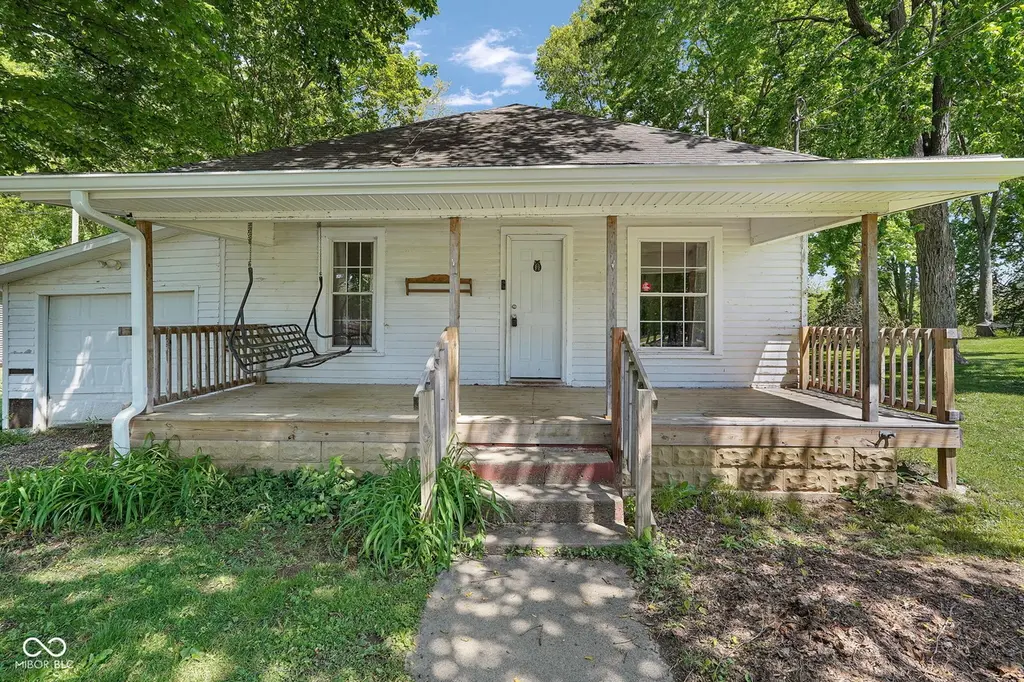
106 Orchard St · Waynetown, IN
Flood risk 1/10 · Minimal
- FEMA flood zone
- X (unshaded)
- Chance of flooding over 30 yrs
- 0.0%
- Est. flood insurance / yr
- $473 – $860
Fire risk 1/10 · Minimal
- Est. fire insurance / yr
- $717 – $1,331
Heat risk 3/10 · Minor
- Hot days now (above 102°F)
- 7 days/yr
- Hot days in 30 yrs
- 18 days/yr
Wind risk 2/10 · Minimal
- Chance of severe wind over 30 yrs
- 1.0%
Air-quality risk 2/10 · Minimal
- Unhealthy air days now
- 1 days/yr
- Unhealthy air days in 30 yrs
- 2 days/yr
Risk factors via First Street. Map © Google.
Why this score? — see what drove the B+ grade
The composite is a weighted blend of 9 inputs, each scored 0–100. Each bar is that input's sub-score; the figure is the points it added to the 100-point composite (weight × sub-score).
- Cash flow +30.0/30.0
- DSCR +10.0/10.0
- 1% rule +8.8/10.0
- ARV discount +7.5/15.0
- Appreciation +6.4/10.0
- Schools +4.3/10.0
- Livability +3.2/5.0
- Rent growth +2.5/5.0
- Condition / age +2.5/5.0
$89,900
🖨 Deal sheet 📄 Offer letter ✓ Due diligence
Listing remarks
Charming 1 bedroom, 1 bathroom home full of potential and character! This home features hardwood floors, a welcoming front porch, and a one-car garage. Enjoy the private backyard with mature trees and a deck perfect for relaxing or entertaining. Several major updates have already been completed, including a farmhouse large kitchen sink, newer stainless steel kitchen appliances (approximately 2 years old), updated HVAC within the last 3 years, newer sump pump in the basement, and new gutters. While the home could use some cosmetic updates and repairs, it offers solid bones and a great opportunity for someone looking to renovate, personalize, or invest. A wonderful chance to bring new life t
Key facts
- Private backyard
- Deck
- Hardwood floors
Tags
Property features AI
Exterior
- Parking: Gravel parking; 1-car garage (approx. 264 sq ft)
- Utilities: Public water; Municipal sewer connected; Electricity connected; Cable available
- Home design: Single-family residence; One level
- Construction: Wood siding; Block foundation
- Exterior features: Deck; Porch; Mature trees; Located in a suburb
Interior
- Kitchen: Gas oven; Refrigerator
- Bedrooms: 1 bedroom on the main level (13 x 11)
- Bathrooms: 1 full bathroom with tub and shower
- Heating & cooling: Natural gas heating; Central air conditioning
- Interior features: Attic access; Has basement
- Laundry & utility: Dryer; Laundry room (basement, 13 x 13); Multiple utility rooms in basement (16 x 11; 13 x 10; 13 x 12)
Neighborhood map
What this means for you Summary
Snapshot
- This is a 1-bed/1.0-bath single-family listed at $90k.
Deal economics
- At list price, monthly cash flow is $446 ($5k/yr) — positive.
- The deal already cash-flows at list — no discount required.
- Meets the 1% rule at list price ($1k rent vs $90k).
Location & tenants
- Location reads 65/100 on livability (#341 in IN) — a middle-class / working-renter tenant base. Strengths: crime A+, cost of living A+, housing A+; Watch: amenities F, commute F, health & safety F.
- North Montgomery Community School Corporation (rural): math 47% / reading 53% proficiency, ranked #50 of 301 in IN (top 17%) — acceptable for families but not a draw, mixed tenant base, ~2y average lease.
- Zoned schools: North Montgomery High School (math 32% / reading 62%, grade D-, #143 of 369 statewide, top 44%, 516 students, 34% FRL) — zoned schools at 34% FRL track the district average.
- Market conditions: 7 active listings in the ZIP; 52 units permitted in Montgomery County in 2024 (0 in 5+ unit buildings).
Forward outlook
- In year one you build about $3k of equity ($622 loan paydown + $2k appreciation (2.8% local appreciation)).
- Montgomery County population projected to shrink 9% by 2050 — rents likely to lag national; underwrite the cash flow, not the appreciation.
- At projected returns (2.8% appreciation + 3.0% rent growth), your $25k cash investment doubles in ~3 years — after that, you're playing with house money.
- By year 10, paydown + projected appreciation supports a ~$30k cash-out refi (75% LTV) — recoverable capital for the next deal without selling this one.
Negotiation context
- Only 3 days on market — expect competitive offers; lowballing is unlikely to land.
- 2 sale attempts since 14y ago with the ask held roughly flat each time — persistent listings suggest the price (not the market) is what's stuck; bring a comps-based counter.
Risks & watch-outs
- Watch-outs: built in 1956 — expect roof / HVAC / electrical / plumbing capex.
Questions for the listing agent
- Built in 1956 — when were the roof, HVAC, electrical panel, plumbing, and water heater last replaced?
- Is there a deadline driving the sale (1031 exchange, divorce, estate, relocation)? That informs how much negotiation room exists.
- Schools are F-rated, which usually means shorter tenancies and higher turnover. Who's the typical renter profile here, and what's been the actual vacancy rate?
- What's the average days-on-market for RENTAL listings here right now (not sales)? A rising rental-DOM trend means longer vacancies and softer asking-rent achievability than the comps imply.
- What's the recent tenant-quality profile in this submarket — average credit score on applications, eviction rate, late-payment / NSF rate, and stable-employment percentage? A property-management company in the area should have these aggregated.
- How much new for-sale + rental construction is in the pipeline within 1–3 miles? Heavy new supply typically softens prices + rents 12–24 months out; constrained supply supports both.
Investment metrics
- 1% rule
- 1.38% ✓
- Cap rate
- 12.25%
- Cash-on-cash
- 21.28%
- DSCR
- 1.95
- GRM
- 6.1
CMA / ARV
No comps found within radius.
Projected returns pro-forma
2.76% appreciation · 3.0% rent growth · sell at horizon
- IRR
- 27.0%
- Equity multiple
- 2.51×
- Total profit
- $38,104
- Equity at exit
- $39,229
- IRR
- 27.9%
- Equity multiple
- 4.86×
- Total profit
- $97,169
- Equity at exit
- $59,544
Cash invested: $25,172 (down + closing). Projections, not guarantees.
Landlord ↔ Tenant lean methodology
- Overall (STATE)
- 90 Strongly Landlord-Friendly
- State Indiana
- 90 Strongly Landlord-Friendly · R+11
- County
- — inherits STATE
- City
- — inherits STATE
ZIP-level market 47990
- Home prices YoY
- 1.2%
- Active inventory
- 7
- Price-to-rent
- 6.1×
Monthly cashflow live
- Estimated rent
- $1,237 medium interval (Pro) →
- Mortgage (P&I)
- −$471
- Tax from tax record
- −$22 /mo · $263/yr
- Insurance
- −$37
- HOA
- −$0
- Vacancy / Maint / Mgmt
- −$260
- Net cashflow
- $446
Break-even live
UW: 25.0% down · 7.5% · 30yr · 1.5% tax · 5.0% vac · 8.0% maint · 8.0% mgmt
Financing live
Cash to close
- Down payment
- $22,475
- Closing costs
- $2,697
- Reserves months
- —
- Total cash needed
- —
Loan-product check · same deal, 3 products live
Conventional
25% down · 7.5% · 30yr
- Down + closing
- —
- Monthly P&I
- —
- Monthly cashflow
- —
- DSCR
- —
- Eligible?
- —
Personal DTI + credit; lowest rate.
DSCR
20% down · 8.5% · 30yr
- Down + closing
- —
- Monthly P&I
- —
- Monthly cashflow
- —
- DSCR
- —
- Eligible?
- —
No personal income docs; deal must DSCR.
Hard money
10% down · 12.0% · 12mo
- Down + closing
- —
- Monthly P&I
- —
- Monthly cashflow
- —
- DSCR
- —
- Eligible?
- —
Short-term bridge; refi at stabilization.
Listing history 4 events
-
2026-06-01statusdays on market $89,900 Pending 3 DOM
-
2026-05-31days on market $89,900 Active 2 DOM
-
2026-05-30remarks 699-char remark
-
2026-05-30$89,900 Active 1 DOM
ⓘ Source: listings_history table (triggers on properties + properties_extension) + one-shot
backfill from property_details.listing_events for pre-trigger history.
Tax reassessment forecast IN · Partial reset (capped growth)
- Current annual tax
- $263 · $22/mo
- Projected year-2 tax
- $514 · $43/mo
- Expected delta
- +$251/yr (+$21/mo · 95.3%)
ⓘ Screening estimate from a state-policy table — verify with the county assessor before closing.
Climate risk First Street
- Flood 1/10 Low FEMA zone X (unshaded) · 0% chance over 30 yrs
- Wildfire 1/10 Low
- Heat 3/10 Moderate 7 d/yr ≥102°F today · 18 d/yr by 30 yrs out
- Wind 2/10 Low 100% chance of damaging wind over 30 yrs
- Air quality 2/10 Low 1 unhealthy d/yr today · 2 by 30 yrs out
Nearby sold comps map
Loading sold comps map…
Walkable amenities ~0.75 mi
Loading nearby amenities…
Taxation est. · year 1
- Rental income
- $14,844
- − Mortgage interest
- −$5,036
- − Property taxes
- −$263
- − Insurance
- −$450
- − Repairs & maintenance
- −$1,188
- − Management
- −$1,188
- − Depreciation
- −$2,615
- Taxable income
- $4,106
- Est. tax owed @ 24.0%
- −$985
- After-tax cash flow
- $4,372/yr
For passive investors: Depreciation is non-cash, so a rental often shows a tax loss while cash-flowing — sheltering income. Rental losses are passive: they offset passive income freely, and up to $25,000/yr can offset ordinary (W-2) income if you actively participate and your MAGI is under $100k (phasing out to $0 by $150k); unused losses carry forward. On sale, claimed depreciation is recaptured at up to 25%, and gains may owe capital-gains tax (a 1031 exchange can defer both). Figures are a year-1 estimate at your 24.0% rate — not tax advice; consult a CPA.
Schools (NCES district)
- District
- North Montgomery Community School Corporation
- NCES district ID
- 1807900
- Math proficiency
- 47% ▼ -1.00%
- Reading proficiency
- 53% ▲ 3.00%
- Median HH income
- $53,844
- Composite
- 43.14/100
- National rank
- #3076
- State rank
- #50 of 301 in IN
Livability — Waynetown
- Score
- 65/100
- State rank
- #341
- US rank
- #13119
Category grades
Schools grade is shown separately in the Schools card above.
Census & demographics
- Census place
- Waynetown, IN
- Population (ZIP)
- 1,374
Population outlook (Montgomery County) Hauer SSP2
- Today (2025)
- 37,893 people
- By 2030
- 37,539 · -0.9%
- By 2040
- 36,536 · -3.6%
- By 2050
- 34,454 · -9.1%
- By 2075
- 28,852 · -23.9%
- By 2100
- 21,145 · -44.2%
Race, ethnicity, and origin ACS 2023
- Neighborhood character
- Predominantly White (91%)
- Race & ethnicity
- White 91% Two or more races 5% Hispanic / Latino 4%
- Common ancestry
- Serbian 8% Slovak 1% Iranian 1%
- Foreign-born
- 2% · Canada
- Languages at home
- 93% English-only · Spanish 6% French/Haitian/Cajun 1%
Political lean MEDSL · Montgomery
- 2024 margin
- Solid R (+48.2) · D 24.9% · R 73.2% · Other 1.9%
- 2008→2024 swing
- -28.3pp toward R · 2008: -19.9pp · 2024: -48.2pp
- All cycles
- 2024: R+48.2 2020: R+49.1 2016: R+50.9 2012: R+38.5 2008: R+19.9
Not yet ingested
- Civics
- —
Market trends
- HPI YoY
- ▲ 2.76%
- Current HPI
- 231.2375
- Rent YoY
- —
- Metro
- —
- State GDP YoY
- ▲ 2.90%
- F500 in state
- 18
Industry mix (Fortune 500 HQ in IN)
| Industry | F500 HQs | Revenue |
|---|---|---|
| Industrial Machinery | 2 | $37B |
|
||
| Healthcare | 1 | $177B |
|
||
| Pharmaceuticals | 1 | $45B |
|
||
| Metals / Steel | 1 | $18B |
|
||
| Agriculture | 1 | $17B |
|
||
| Packaging | 1 | $12B |
|
||
Price history
+50.1% since first listed3 events — show timeline
- 2026-05-29 Listed $89,900 MIBOR as Distributed by MLS Grid
- 2013-01-26 Listing Removed — MIBOR as Distributed by MLS Grid
- 2012-09-25 Listed $59,900 MIBOR as Distributed by MLS Grid
Property tax history
+9.2%/yrLatest (2025): $263 · +7.1% YoY. Source: county tax records.
Cash-flow waterfall
monthlySold comps — $/sqft
last 12 mo · ≤1 miLoading sold comps…