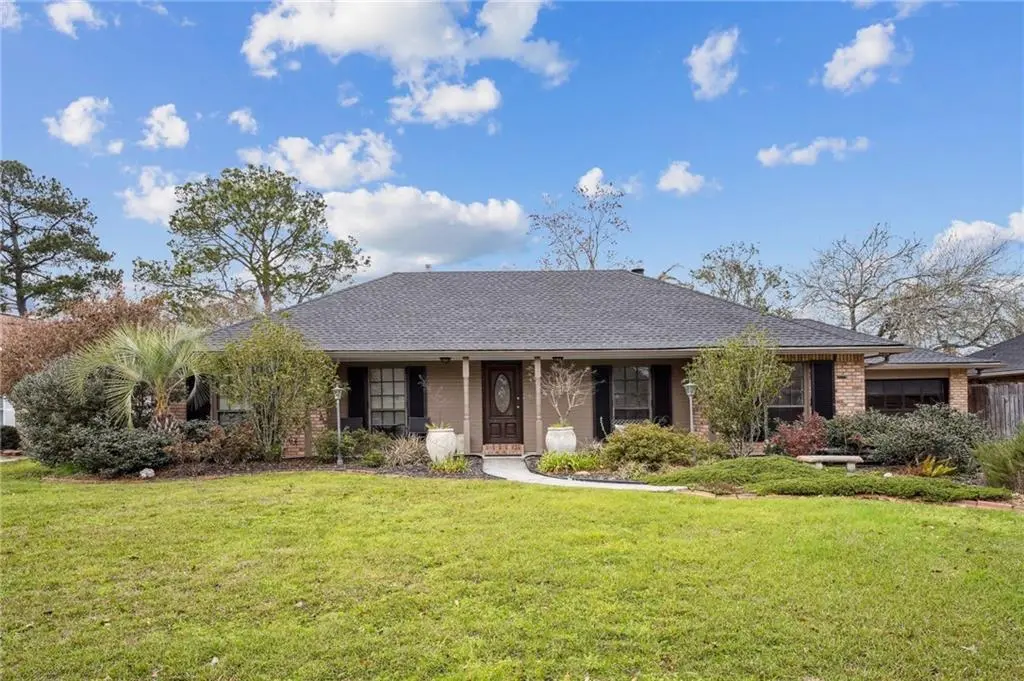
834 Cross Gates Blvd Blvd · Slidell, LA
Flood risk 5/10 · Moderate
- FEMA flood zone
- X
- Chance of flooding over 30 yrs
- 0.47%
- Est. flood insurance / yr
- $507 – $1,088
Fire risk 2/10 · Minimal
- Est. fire insurance / yr
- $1,269 – $2,357
Heat risk 10/10 · Severe
- Hot days now (above 108°F)
- 7 days/yr
- Hot days in 30 yrs
- 22 days/yr
Wind risk 9/10 · Severe
- Chance of severe wind over 30 yrs
- 99.0%
Air-quality risk 2/10 · Minimal
- Unhealthy air days now
- 1 days/yr
- Unhealthy air days in 30 yrs
- 2 days/yr
Risk factors via First Street. Map © Google.
Why this score? — see what drove the D- grade
The composite is a weighted blend of 9 inputs, each scored 0–100. Each bar is that input's sub-score; the figure is the points it added to the 100-point composite (weight × sub-score).
- ARV discount +11.6/15.0
- Cash flow +9.8/30.0
- Schools +4.3/10.0
- Livability +3.5/5.0
- Rent growth +2.9/5.0
- DSCR +2.8/10.0
- 1% rule +2.5/10.0
- Condition / age +2.5/5.0
- Appreciation +0.0/10.0
$329,900
🖨 Deal sheet (PDF) 📄 Offer letter ✓ Due diligence
Listing remarks MLS
Well maintained home in beautiful Cross Gates Subdivision with plenty of extras! New roof in 2024, no carpet, whole house generator, working hurricane shutters and so much more! You'll have plenty of space between your great room, living room and dining room, along with a large kitchen to entertain to your heart's content! Speaking of the kitchen, it has a double oven, granite counters, ss appliances and lots of counterspace to enjoy. There's also an oversized garage with a workshop built in the back, along with a fenced yard filled with a variety of lemon, fig, satsuma, blackberry and more. Flood zone "C" so no flood insurance needed here! In demand schools, great access to I-10 and plenty of amenities nearby....what more could you want or need? Owner financing is available as bond for deed with 20% down, 30 year term with 5 year balloon. Call to see this home today!
Key facts
- Fenced yard
- Double oven
- Granite counters
Tags
Neighborhood map
What this means for you Summary
Snapshot
- This is a 4-bed/2.0-bath single-family listed at $330k.
Deal economics
- At list price, monthly cash flow is $-213 ($-3k/yr) — negative.
- To cash-flow at today's rent, offer at most $292k (11.4% below list).
- To meet the 1% rule (rent ≥ 1% of price), the offer needs to be $249k (24.7% below list).
- Recommended offer: $249k (24.7% below list) — sets the bar for 1% rule.
Location & tenants
- Location reads 70/100 on livability (#57 in LA) — a middle-class / working-renter tenant base. Strengths: cost of living A+, housing A+, health & safety A+; Watch: amenities F, commute F.
- St. Tammany Parish (suburban): math 43% / reading 55% proficiency, ranked #11 of 98 in LA (top 11%) — families likely to look elsewhere, expect single-tenant / working-renter base with shorter leases.
- Market conditions: Rents rising (+1.7%/yr); 594 active listings in the ZIP; 7 comparable units currently listed for rent nearby; rentals lingering (median 45d on market — plan ~5-8 weeks vacancy on turnover, expect pricing pressure); 57% of comp listings sitting > 30 days — soft ceiling on asking rent; solid renter incomes; 1,064 units permitted in St. Tammany Parish in 2024 (0 in 5+ unit buildings).
- This rent runs 34% of the median local income ($89k/yr) — at the standard rent-burdened threshold; future hikes will face affordability resistance.
Forward outlook
- Local home prices are declining (-3.0%/yr); year-one equity from $2k of loan paydown is wiped out by about $10k of value loss. Plan a longer hold.
- St. Tammany County population projected at +27% by 2050 — long-run rental-demand tailwind backs the buy-and-hold thesis.
Negotiation context
- It's been on market 146 days — a 12% lower offer ($290k) is reasonable based on typical stale-listing flexibility.
- 7 sale attempts since 30y ago with the ask held roughly flat each time — persistent listings suggest the price (not the market) is what's stuck; bring a comps-based counter.
- Current owner paid $140k; list at $330k implies a 136% gain — meaningful room to come down on a strong offer.
Risks & watch-outs
- Climate carrying-cost: moderate flood risk; severe wind risk, 99% chance of damaging wind over 30y; extreme-heat days projected 7→22/yr by 2055 (HVAC capex compounding) — expect insurance premiums to compound above CPI over the hold.
Questions for the listing agent
- What do current leases actually rent for vs. the listed asking? Can we see a recent rent roll and the last 12 months of T-12 income?
- It's been on market 146 days. Have you received any prior offers? Is the seller open to a 25% concession, seller financing, or rate buy-down credit?
- What does the HOA fee cover, when was the last increase, and are there any pending special assessments or reserve-fund shortfalls?
- Why hasn't it sold? Are there any deal-killer items the seller is aware of (foundation, flood, title, zoning, code violations)?
- Is there a deadline driving the sale (1031 exchange, divorce, estate, relocation)? That informs how much negotiation room exists.
- Schools are B-rated — typically a magnet for longer-tenancy family renters. What's the average tenant stay here, and is there a school-zone premium baked into asking?
- The area grade is low — what's the realistic commute time and amenity access for the typical tenant pool here? Any planned neighborhood developments (good or bad) we should know about?
- What's the average days-on-market for RENTAL listings here right now (not sales)? A rising rental-DOM trend means longer vacancies and softer asking-rent achievability than the comps imply.
- What's the recent tenant-quality profile in this submarket — average credit score on applications, eviction rate, late-payment / NSF rate, and stable-employment percentage? A property-management company in the area should have these aggregated.
- How much new for-sale + rental construction is in the pipeline within 1–3 miles? Heavy new supply typically softens prices + rents 12–24 months out; constrained supply supports both.
Investment metrics
- 1% rule
- 0.75% ✗
- Cap rate
- 5.52%
- Cash-on-cash
- -2.77%
- DSCR
- 0.88
- GRM
- 11.1
CMA / ARV
- ARV (median comp)
- $362,906
- List price
- $329,900
- Delta
- -9.09%
- Verdict
- FAIR
- Comps
- 20 within 1.0 mi
Show comp detail 12 sales within ~0.75 mi
| Address | Dist | Beds/Ba | Sqft | Sold | Price | $/sf | Match |
|---|---|---|---|---|---|---|---|
| 111 Thatcher Dr | 0.13mi | 4/2.0 | 2,353 (+3%) | 1mo | $290,000 | $123 | 87 |
| 148 Woodruff Dr | 0.29mi | 4/2.5 | 2,348 (+3%) | 1mo | $386,000 | $164 | 78 |
| 307 N Buckingham Dr | 0.56mi | 4/2.0 | 2,260 (-1%) | 1mo | $265,000 | $117 | 72 |
| 105 Honeywood Dr | 0.59mi | 3/2.5 (-1) | 2,275 (-0%) | 0mo | $270,000 | $119 | 65 |
| 804 N Lake Verret Ct | 0.44mi | 4/2.0 | 2,083 (-8%) | 2mo | $284,000 | $136 | 64 |
| 245 Cross Gates Blvd | 0.66mi | 3/2.5 (-1) | 2,284 (+0%) | 1mo | $345,000 | $151 | 61 |
| 105 Harrow Dr | 0.42mi | 4/2.0 | 2,014 (-12%) | 2mo | $307,000 | $152 | 60 |
| 700 S Lake Verret Ct | 0.35mi | 3/2.0 (-1) | 2,011 (-12%) | 0mo | $273,000 | $136 | 59 |
| 102 Circlewood Ct | 0.65mi | 4/2.5 | 2,411 (+6%) | 1mo | $265,000 | $110 | 57 |
| 424 Dockside Dr | 0.68mi | 4/3.0 | 2,433 (+7%) | 1mo | $420,000 | $173 | 52 |
| 40590 Cara Mae St | 0.66mi | 4/3.0 | 2,038 (-10%) | 1mo | $309,900 | $152 | 47 |
| 40702 Cara Mae St | 0.66mi | 5/3.0 (+1) | 2,016 (-12%) | 1mo | $307,900 | $153 | 40 |
Match score weights: distance 35% · size 25% · config 20% · recency 20%. Top-matched comps best support the ARV.
Projected returns pro-forma
-3.0% appreciation · 1.72% rent growth · sell at horizon
- IRR
- -22.3%
- Equity multiple
- 0.24×
- Total profit
- $-70,220
- Equity at exit
- $49,189
- IRR
- -19.7%
- Equity multiple
- 0.01×
- Total profit
- $-91,372
- Equity at exit
- $28,524
Cash invested: $92,372 (down + closing). Projections, not guarantees.
Landlord ↔ Tenant lean methodology
- Overall (STATE)
- 90 Strongly Landlord-Friendly
- State Louisiana
- 90 Strongly Landlord-Friendly · R+12
- County
- — inherits STATE
- City
- — inherits STATE
ZIP-level market 70461
- Home prices YoY
- -33.0%
- Rents YoY
- 1.7%
- Active inventory
- 594
- Price-to-rent
- 11.1×
Monthly cashflow live
- Estimated rent
- $2,485 high interval (Pro) →
- Mortgage (P&I)
- −$1,730
- Tax from tax record
- −$301 /mo · $3,611/yr
- Insurance
- −$137
- HOA
- −$8
- Vacancy / Maint / Mgmt
- −$522
- Net cashflow
- $-213
Break-even live
Sensitivity live
| Price | -10% $-26 | -5% $-120 | +0% $-213 | +5% $-307 | +10% $-400 |
|---|---|---|---|---|---|
| Rent | -10% $-409 | -5% $-311 | +0% $-213 | +5% $-115 | +10% $-17 |
| Rate | -1.0pp $-47 | -0.5pp $-129 | base $-213 | +0.5pp $-299 | +1.0pp $-386 |
UW: 25.0% down · 7.5% · 30yr · 1.5% tax · 5.0% vac · 8.0% maint · 8.0% mgmt
Financing live
Cash to close
- Down payment
- $82,475
- Closing costs
- $9,897
- Reserves months
- —
- Total cash needed
- —
Loan-product check · same deal, 3 products live
Conventional
25% down · 7.5% · 30yr
- Down + closing
- —
- Monthly P&I
- —
- Monthly cashflow
- —
- DSCR
- —
- Eligible?
- —
Personal DTI + credit; lowest rate.
DSCR
20% down · 8.5% · 30yr
- Down + closing
- —
- Monthly P&I
- —
- Monthly cashflow
- —
- DSCR
- —
- Eligible?
- —
No personal income docs; deal must DSCR.
Hard money
10% down · 12.0% · 12mo
- Down + closing
- —
- Monthly P&I
- —
- Monthly cashflow
- —
- DSCR
- —
- Eligible?
- —
Short-term bridge; refi at stabilization.
Rent comps 7 comps
| Address | Beds | Baths | Sqft | Rent | $/sqft | DOM | Units | Dist |
|---|---|---|---|---|---|---|---|---|
| 555 Cross Gates Blvd Slidell, LA | 4.0 | 2.5 | 2300 | $2,425 | $1.05 | 45d | 1 | 0.31mi |
| 812 N Lake Verret Ct Slidell, LA | 3.0 | 2.0 | 1862 | $2,500 | $1.34 | 25d | 1 | 0.51mi |
| 507 Cross Gates Blvd Slidell, LA | 3.0 | 2.0 | 2045 | $2,150 | $1.05 | 25d | 1 | 0.57mi |
| 221 Lake Tahoe Dr Slidell, LA | 3.0 | 2.0 | 1671 | $1,850 | $1.11 | 45d | 1 | 0.85mi |
| 361 Autumn Lakes Rd Slidell, LA | 4.0 | 2.5 | 2250 | $3,000 | $1.33 | 13d | 1 | 1.07mi |
| 361 Autumn Lakes Rd Slidell, LA | 4.0 | 2.5 | 2250 | $3,500 | $1.56 | 45d | 1 | 1.07mi |
| 3517 Meadow Lake Dr W Slidell, LA | 3.0 | 2.0 | 1931 | $2,200 | $1.14 | 45d | 1 | 1.25mi |
HOA detail
- Monthly dues
- $8 · $96/yr
Listing history 33 events
-
2026-06-21days on market $329,900 Active 146 DOM
-
2026-06-18days on market $329,900 Active 143 DOM
-
2026-06-17days on market $329,900 Active 142 DOM
-
2026-06-16days on market $329,900 Active 141 DOM
-
2026-06-15days on market $329,900 Active 140 DOM
-
2026-06-13days on market $329,900 Active 138 DOM
-
2026-06-10days on market $329,900 Active 135 DOM
-
2026-06-09days on market $329,900 Active 134 DOM
-
2026-06-08days on market $329,900 Active 133 DOM
-
2026-06-07days on market $329,900 Active 132 DOM
-
2026-06-03days on market $329,900 Active 128 DOM
-
2026-06-02days on market $329,900 Active 127 DOM
-
2026-06-01days on market $329,900 Active 126 DOM
-
2026-05-31days on market $329,900 Active 125 DOM
-
2026-01-26$329,900 Active 890-char remark
Show marketing remark (895 chars)
Well maintained home in beautiful Cross Gates Subdivision with plenty of extras! New roof in 2024, no carpet, whole house generator, working hurricane shutters and so much more! You'll have plenty of space between your great room, living room and dining room, along with a large kitchen to entertain to your heart's content! Speaking of the kitchen, it has a double oven, granite counters, ss appliances and lots of counterspace to enjoy. There's also an oversized garage with a workshop built in the back, along with a fenced yard filled with a variety of lemon, fig, satsuma, blackberry and more. Flood zone "C" so no flood insurance needed here! In demand schools, great access to I-10 and plenty of amenities nearby. .. .what more could you want or need? Owner financing is available as bond for deed with 20% down, 30 year term with 5 year balloon. Call to see this home today!
-
2026-01-26$329,900 Active 895-char remark
Show marketing remark (895 chars)
Well maintained home in beautiful Cross Gates Subdivision with plenty of extras! New roof in 2024, no carpet, whole house generator, working hurricane shutters and so much more! You'll have plenty of space between your great room, living room and dining room, along with a large kitchen to entertain to your heart's content! Speaking of the kitchen, it has a double oven, granite counters, ss appliances and lots of counterspace to enjoy. There's also an oversized garage with a workshop built in the back, along with a fenced yard filled with a variety of lemon, fig, satsuma, blackberry and more. Flood zone "C" so no flood insurance needed here! In demand schools, great access to I-10 and plenty of amenities nearby. .. .what more could you want or need? Owner financing is available as bond for deed with 20% down, 30 year term with 5 year balloon. Call to see this home today!
-
2025-07-10price $329,900
-
2025-07-10price $329,900
-
2025-06-23price $334,900
-
2025-06-23price $334,900
-
2025-05-22price $349,000
-
2025-05-22price $349,000
-
2025-04-21price $359,900
-
2025-04-21price $359,900
-
2025-03-19price $374,000
-
2025-03-19price $374,000
-
2025-02-18$385,000 Active
-
2018-04-13historical
-
2018-01-12$299,700 Active
-
2018-01-12$299,700
-
1996-06-27soldstatus $139,500
-
1996-04-03$142,500
-
1996-04-03$142,500
ⓘ Source: listings_history table (triggers on properties + properties_extension) + one-shot
backfill from property_details.listing_events for pre-trigger history.
Tax reassessment forecast LA · Resets to sale price
- Current annual tax
- $3,611 · $301/mo
- Projected year-2 tax
- $3,611 · $301/mo
- Expected delta
- $0/yr ($0/mo · 0.0%)
ⓘ Screening estimate from a state-policy table — verify with the county assessor before closing.
Climate risk First Street
- Flood 5/10 Major FEMA zone X · 47% chance over 30 yrs
- Wildfire 2/10 Low
- Heat 10/10 Extreme 7 d/yr ≥108°F today · 22 d/yr by 30 yrs out
- Wind 9/10 Extreme 99% chance of damaging wind over 30 yrs
- Air quality 2/10 Low 1 unhealthy d/yr today · 2 by 30 yrs out
Nearby sold comps map
Loading sold comps map…
Walkable amenities ~0.75 mi
Loading nearby amenities…
Taxation est. · year 1
- Rental income
- $29,822
- − Mortgage interest
- −$18,480
- − Property taxes
- −$3,611
- − Insurance
- −$1,650
- − Repairs & maintenance
- −$2,386
- − Management
- −$2,386
- − HOA
- −$96
- − Depreciation
- −$9,597
- Taxable loss
- −$8,383
- Est. tax savings @ 24.0%
- +$2,012
- After-tax cash flow
- $-546/yr
For passive investors: Depreciation is non-cash, so a rental often shows a tax loss while cash-flowing — sheltering income. Rental losses are passive: they offset passive income freely, and up to $25,000/yr can offset ordinary (W-2) income if you actively participate and your MAGI is under $100k (phasing out to $0 by $150k); unused losses carry forward. On sale, claimed depreciation is recaptured at up to 25%, and gains may owe capital-gains tax (a 1031 exchange can defer both). Figures are a year-1 estimate at your 24.0% rate — not tax advice; consult a CPA.
Schools (NCES district)
- District
- St. Tammany Parish
- NCES district ID
- 2201650
- Math proficiency
- 43% ▼ -32.00%
- Reading proficiency
- 55% ▼ -26.00%
- Median HH income
- $61,752
- Composite
- 43.04/100
- National rank
- #3098
- State rank
- #11 of 98 in LA
Livability — Slidell
- Score
- 70/100
- State rank
- #57
- US rank
- #7673
Category grades
Schools grade is shown separately in the Schools card above.
Census & demographics
- County
- Saint Tammany Parish · 228,296 people
- City population
- 95,511
- Metro
- New Orleans-Metairie, LA
- Population (ZIP)
- 34,808
- Household income
- $89,003
- Rent vs Own
- Severe rent burden
- 328.0
Population outlook (St. Tammany County) Hauer SSP2
- Today (2025)
- 286,725 people
- By 2030
- 304,175 · +6.1%
- By 2040
- 336,203 · +17.3%
- By 2050
- 364,590 · +27.2%
- By 2075
- 433,362 · +51.1%
- By 2100
- 470,333 · +64.0%
Race, ethnicity, and origin ACS 2023
- Neighborhood character
- Diverse neighborhood (Simpson 0.63)
- Race & ethnicity
- White 55% Black 24% Two or more races 14% Hispanic / Latino 11% Asian 3%
- Hispanic origin (detail)
- Common ancestry
- Lithuanian 9% Italian 1% Romanian 1%
- Foreign-born
- 8% · Canada, China, Vietnam
- Languages at home
- 89% English-only · Spanish 7% Chinese 1% Vietnamese 1%
Political lean MEDSL · St. Tammany
- 2024 margin
- Solid R (+43.8) · D 27.3% · R 71.1% · Other 1.6%
- 2008→2024 swing
- +9.6pp toward D · 2008: -53.4pp · 2024: -43.8pp
- All cycles
- 2024: R+43.8 2020: R+44.2 2016: R+50.8 2012: R+52.2 2008: R+53.4
Not yet ingested
- Civics
- —
Market trends
- HPI YoY
- ▼ -74.47%
- Current HPI
- 151.3353
- Rent YoY
- ▲ 1.72%
- Metro
- New Orleans-Metairie, LA
- State GDP YoY
- ▲ 3.29%
- F500 in state
- 10
Industry mix (Fortune 500 HQ in LA)
| Industry | F500 HQs | Revenue |
|---|---|---|
| Telecommunications | 2 | $23B |
|
||
| Utilities | 1 | $12B |
|
||
| Wholesale / Distribution | 1 | $5B |
|
||
| Advertising | 1 | $2B |
|
||
Price history
+131.5% since first listed19 events — show timeline
- 2026-01-26 Listed $329,900 GSREIN
- 2026-01-26 Listed $329,900 AcadianaMLS
- 2025-07-10 Price Changed $329,900 AcadianaMLS
- 2025-07-10 Price Changed $329,900 GSREIN
- 2025-06-23 Price Changed $334,900 AcadianaMLS
- 2025-06-23 Price Changed $334,900 GSREIN
- 2025-05-22 Price Changed $349,000 AcadianaMLS
- 2025-05-22 Price Changed $349,000 GSREIN
- 2025-04-21 Price Changed $359,900 AcadianaMLS
- 2025-04-21 Price Changed $359,900 GSREIN
- 2025-03-19 Price Changed $374,000 AcadianaMLS
- 2025-03-19 Price Changed $374,000 GSREIN
- 2025-02-18 Listed $385,000 AcadianaMLS
- 2018-04-13 Listing Removed — GSREIN
- 2018-01-12 Listed $299,700 AcadianaMLS
- 2018-01-12 Listed $299,700 GSREIN
- 1996-06-27 Sold (MLS) $139,500 GSREIN
- 1996-04-03 Listed $142,500 GSREIN
- 1996-04-03 Listed $142,500 AcadianaMLS
Property tax history
+2.1%/yrLatest (2025): $3,611 · +30.2% YoY. Source: county tax records.
Cash-flow waterfall
monthlySold comps — $/sqft
last 12 mo · ≤1 miLoading sold comps…